b) Use the ppt to guide the activity.
c) The students will need to get into 6 groups. Give each group one colour of money and ask them to cut it up. You should keep the ‘insured’ slips.
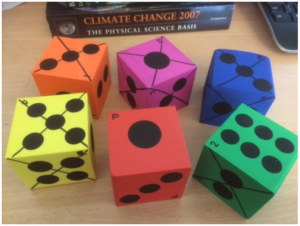
d) Each time you play, roll the P dice first. On the basis of which side it shows, the students should decide whether to insure their businesses or not (if a 6 is shown, then there is no chance of bad weather and presumably no-one will insure). If they choose to insure, they should pay you the appropriate sum in return for an ‘Insured’ slip. Then, roll the appropriate die (so if the P die gave a 3, next roll the die labelled 3). If a crossed-out side is rolled, then anyone who was not insured should pay you the appropriate sum.
e) Collect in all the insured slips and start again.
f) Continue until either one team, or all teams except one are out, depending on time.
5) Flooding, floating gardens and raft building
Time: 2.5 hours
You will need: Laptop and projector (for PowerPoint)
Whiteboard or flipchart for recording “purchases” by teams and competition results
5 or 6 small ziplock bags containing soil or sand and representing the crops of the garden.
Large and deep plastic box for use as “lake”
Towels
Access to water
Bundles of building materials e.g. plastic straws, lolly sticks, willow sticks, elastic bands, string, corks
Tape dispenser and scissors for each team
Additional materials for teams to “purchase” e.g. small plastic bottles with lids, plastic trays, bubble wrap, bags (anything else you can think of).
Topic: Flooding and climate change, developing world, adaptation.
Skills: teamwork, raft building, communication, budgeting, testing
Based on the Flooding Gardens activity from Practical Action.
Summary:
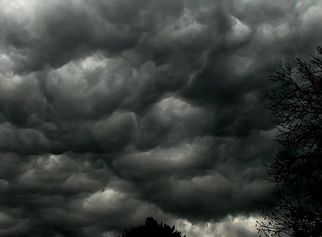
• Short powerpoint on flooding and impact of climate change. (15 mins)
• Set up problem of agriculture in Bangladesh (5 mins)
• Design and build of floating garden rafts according to specification in the power point (see also
below) – 40 mins including one opportunity for testing design
• Public competition – 20 mins
• Final few slides on real life application – 10 mins
Plus need a bit of time to set up in advance and definitely some to pack / clear up afterwards
Raft building part:
Each team needs to build a raft that could hold a floating garden. The winner is the team that builds a raft that can hold the most weight (small bags of soil) without the top surface of the raft being inundated with water. If using the budgeting version, secondary awards for cheap designs that work (although maybe not quite as well as the expensive ones).
Students are provided with a bag containing e.g. straws, willow sticks, elastic bands, sellotape dispenser, scissors, corks, lolly sticks. These represent “free” and available materials.
Also available are plastic bottles, plastic trays, bubble wrap and anything else you can think of – but these are kept at the front and have a price attached to them. The actual value you give them is arbitrary but they are supposed to represent things that are scarce in the communities we are considering. For example, plastic bottles might represent sealed oil drums, bubble wrap might be tarpaulins etc.
(Note, all materials can and should be recovered at the end of the session – the rafts are broken down and materials reused on other occasions).
With a year 6 group, you should be able to get them to discuss and draw out their design as a team first (maybe first 10 mins of building section), then send one person to get what they need (including paying – I haven’t given them a budget as such, just kept a record of what they have “spent”, but you could give each group a fixed budget if you wanted to (and then judge your winner differently).
6) Greenhouse Effect Bulldog
Time: 30 minutes
You will need: A playground. Chalk or similar. Hats or sashes (see below).
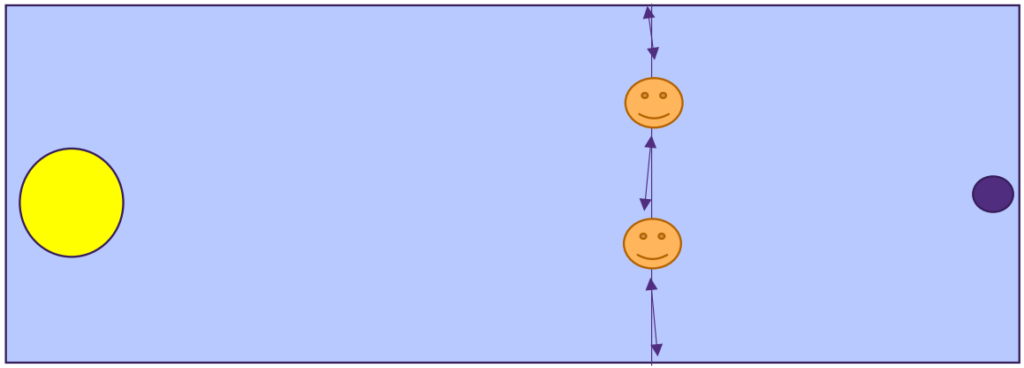
This playground game demonstrates the way Greenhouse gases return energy to the Earth’s surface – as well as allowing the students to run off some energy!
a) With chalk or similar, mark a Sun and an Earth at opposite ends of the school playground. If possible also draw a line across the playground, a third of the way between the Earth and the Sun.
b) Choose 2 students to be greenhouse gases – if possible give them a hat or sash to identify them.
Which greenhouse gases have they heard of? One could be water and the other carbon dioxide.
They are allowed to move only along the line you have drawn. Their role is to try and touch the other students as they run past but only when they are running from the Earth towards the Sun!
c) The other students are all ‘energy’ and start off by the Sun.
d) The ‘energy’ should run to the Earth and back again, repeatedly. If the ‘greenhouse gas’ students manage to touch them, then they have to run 10 times between the greenhouse gas line and the Earth before being allowed to return to the Sun.
e) After a few minutes of doing this, stop the students and increase the numbers of ‘greenhouse gas’ students – you could add a methane, or another water.
f) Again, let them play this for a while, then stop them and ask what has changed. They should notice that there is now more ‘energy’ trapped near the Earth.
g) You could increase the amount of greenhouse gas again and let them see what happens.
h) Finish by talking about how greenhouse gases are essential to maintaining our climate, but that increasing the amount of greenhouse gas leads to heating. You may need to talk a little bit about the different forms energy can take – light, heat etc.