


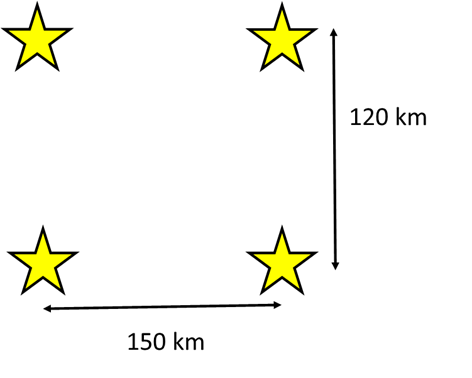
Calculate the best flight time from A to B and reduce greenhouse gas emissions!
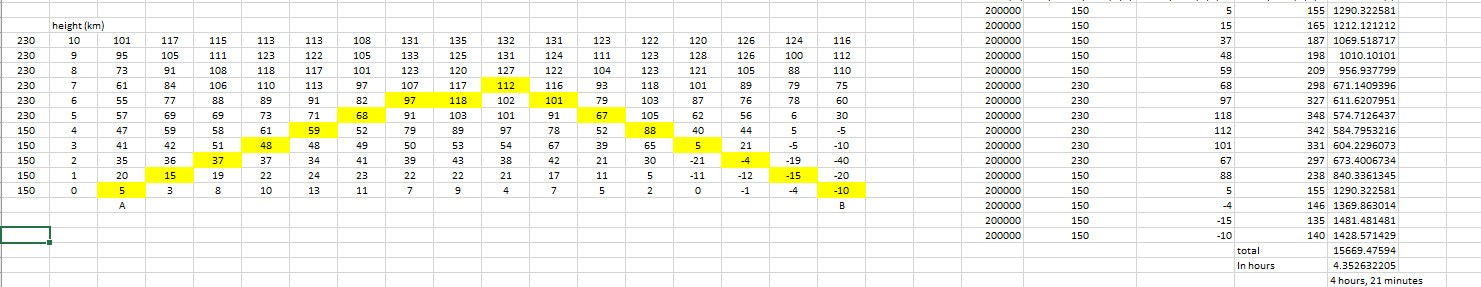
The table below represents a cross section through the atmosphere and gives wind speeds (in m/s) in boxes which are 200km long and 1km high.
Your task is to pilot an aircraft, which flies at 230m/s when it is flying in the less dense atmosphere higher than 5km, and 150m/s when it is flying in the more dense atmosphere lower than 5km, from A to B in the shortest time possible.
Remember, flying in the same direction as the wind increases your speed but flying against the wind slows you down.
Map your route on the chart below and then calculate the flight time!
Rules
Some students may find the following table useful:

In this activity students use current data to investigate the UK’s energy sources.
Go to gridwatch.co.uk and use the table and the key at the bottom of the page to complete the following table. This website shows you where the UK’s electric power is coming from and what the total demand (use) is and has been over the past year.
(1 GW = 1 000 000 000W)

Extension
By looking at the total energy demand, and the production by wind energy, what can you deduce is the purpose of gas turbines?
Can you see any correlation between wind output and gas turbine output?
Opportunity for Group Work
Make a poster or presentation showing what you have learned.
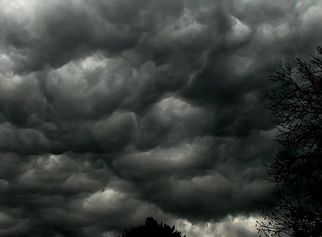
In this activity, students will test the hypothesis that “When the clouds are darker, more of the Sun’s light has been scattered and so less light reaches the ground”
Advice for teachers
Ideally, this activity should be carried out over a week or longer. This could mean that different classes contribute towards collecting the data.
You will need
Advice

Extension
Draw a graph which shows light level against grey scale number

Questions


These resources are designed to be used in one session with year 6 (10/ 11 year old) students. Although they will support numeracy, literacy and various other aspects of the curriculum, they are designed to prepare students for secondary school rather than support the year 6 curriculum.
There are 6 suggested activities. Although they are designed to be run sequentially, you may choose to use only some of the activities, or to supplement them with your own ideas.
You may like to ask them to summarise their learning after each activity – this could be on post it notes on a cloud, or …
It should be possible to use these activities with any class size.
Many people, including Ellie Highwood, Cristina Charlton-Perez, Helen Johnson and Laila Gohar, have contributed to these resources.
Time: 30 minutes
You will need: Weather or Climate.pptx, one printed copy of Weather or Climate.docx for each pair of students and two dice per pair of students.
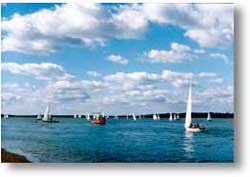
a) Show the images in the PowerPoint presentation and ask the students what each image shows and whether it is ‘weather’ or ‘climate’. Some may not have a clear answer!
b) Ask the students to get into pairs and give each pair one sheet and two dice.
c) Give them 5 minutes to roll both dice and record the combined score each time they roll as a tally chart.
d) Optional: ask them to turn this tally into a bar chart on the graph paper provided.
e) Can they predict what number they would roll next, if they had the chance?
f) Talk about how the graph shows the most likely score (the climate) but also the complete range of possible scores (the weather). What scores are ‘extreme’?
g) What happens to the numbers if the ‘1’ on one of the dice is changed into a ‘7’?
Time: 30 minutes
You will need: 120 multicoloured lollipop sticks (at least 10 sticks each of 6 colours), Climate_Change_Picture.pptx, lollipop.xls, blue tack or similar
Note: this probably works best with groups of about 6 students working on each graph, with larger groups more teacher involvement will be required to keep the whole group engaged.
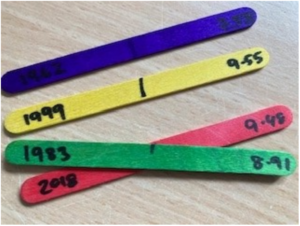
a) Before the event, mark on the middle of each lollipop stick. On each stick, write the year and the temperature for one of the data points in the spreadsheet (e.g. 1970 14.47), differentiating between global and CET data. Use a different coloured lollipop for each decade – so the 60s are all one colour etc.
b) You’ll also need to print a blank graph – the document supplied will work on A3 paper.
c) Divide the students into two groups. Within each group, divide out the lollipop sticks.
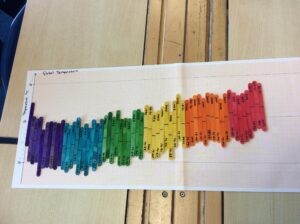
d) They should then work together to stick the sticks to the graphs in the right places, using the line in the middle of the stick as the marker.
e) Whilst doing so, they can look at years that mean something to them – the year they were born, their parents were born etc.
f) When they’ve finished, ask them to complete the table on the ppt
g) What does their graph show? What surprises them? What are the similarities and differences between the graphs?
h) Optional: take the sticks back off the graph and, within their groups, line the sticks up in temperature order with the coldest on the left and the warmest on the right. What does this show?
Time: 30 – 60 minutes
You will need: Lucky dip bag of things that have some link (vague or otherwise) to climate change. Each group takes an object, and then together works out what the connection is. After 10 mins groups swap
objects until all groups have seen all objects. (You could make a simple worksheet with a box for them to write their ideas for each item).
At the end – ask for feedback on each object and give them the “correct answer” – this can take a while – if you have 4 objects, this would make a 60 minute activity. I think they lose interest after 4 objects.
Example objects, depending on what you have available. Try and use objects which have both obvious and higher level ideas associated with them. Try and balance ‘doom and gloom’ with ‘opportunity and hope’ ideas.
Toy car: Emissions of greenhouse gases, also ozone and air pollution. Move talk
onto electric vehicles, nighttime charging etc.
Tree ring slice: Tree rings are an indirect way of measuring our climate etc, trees remove
carbon dioxide from the atmosphere, forestation and deforestation.
Cuddly cow: Methane – but you could also talk about the climate impact of beef etc. as
that is now much more talked about.
Butterfly brooch: Most of the kids talk about different species adapting to climate change (they do evolution in year 6) but you can also refer to chaos and internal links between different parts of the climate system
Mini trainer shoe: Some “air” trainers used to have SF6 in which is a really strong
greenhouse gas. You could also use baby shoes to represent babies and population growth. Also transportation – where were these shoes made?
Mirror: Geo-engineering and space mirrors – but can also explain albedo in this
way.
Solar powered toy: Renewable energy sources
Windmill: Renewable energy sources, changing weather patterns
Bag of rice: Methane production, plants as absorbers of CO2
Cuddly polar bear, puffin or other iconic animal threatened by climate change.
Sponge: Link to bleaching coral reefs and plankton as photosynthesisers equivalent to land plants.
Chocolate bar: Clearing of rainforests for production and threat to cocoa plants as
temperature rises.
Bottle of frozen water: Melting glaciers and ice caps; link to albedo and positive feedback;
hydrogen fuel
Piece of charred wood: Sustainable fuels; increased forest fires.
Time: 30 minutes
You will need: money.docx printed in colour, WeatherRiskGame.pptx, 6 dice – large ones which the whole class can see work best. I got some foam ones very cheaply.
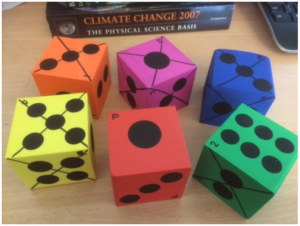
a) Before the event, mark the dice ‘p’ and 1-5. On the die marked 1, cross out or otherwise mark one side, on the die marked 2 cross out or otherwise mark two sides etc.
b) Use the ppt to guide the activity.
c) The students will need to get into 6 groups. Give each group one colour of money and ask them to cut it up. You should keep the ‘insured’ slips.
d) Each time you play, roll the P dice first. On the basis of which side it shows, the students should decide whether to insure their businesses or not (if a 6 is shown, then there is no chance of bad weather and presumably no-one will insure). If they choose to insure, they should pay you the appropriate sum in return for an ‘Insured’ slip. Then, roll the appropriate die (so if the P die gave a 3, next roll the die labelled 3). If a crossed-out side is rolled, then anyone who was not insured should pay you the appropriate sum.
e) Collect in all the insured slips and start again.
f) Continue until either one team, or all teams except one are out, depending on time.
Time: 2.5 hours
You will need: Laptop and projector (for PowerPoint)
Whiteboard or flipchart for recording “purchases” by teams and competition results
5 or 6 small ziplock bags containing soil or sand and representing the crops of the garden.
Large and deep plastic box for use as “lake”
Towels
Access to water
Bundles of building materials e.g. plastic straws, lolly sticks, willow sticks, elastic bands, string, corks
Tape dispenser and scissors for each team
Additional materials for teams to “purchase” e.g. small plastic bottles with lids, plastic trays, bubble wrap, bags (anything else you can think of).
Topic: Flooding and climate change, developing world, adaptation.
Skills: teamwork, raft building, communication, budgeting, testing
Based on the Flooding Gardens activity from Practical Action.
Summary:
• Short powerpoint on flooding and impact of climate change. (15 mins)
• Set up problem of agriculture in Bangladesh (5 mins)
• Design and build of floating garden rafts according to specification in the power point (see also
below) – 40 mins including one opportunity for testing design
• Public competition – 20 mins
• Final few slides on real life application – 10 mins
Plus need a bit of time to set up in advance and definitely some to pack / clear up afterwards
Raft building part:
Each team needs to build a raft that could hold a floating garden. The winner is the team that builds a raft that can hold the most weight (small bags of soil) without the top surface of the raft being inundated with water. If using the budgeting version, secondary awards for cheap designs that work (although maybe not quite as well as the expensive ones).
Students are provided with a bag containing e.g. straws, willow sticks, elastic bands, sellotape dispenser, scissors, corks, lolly sticks. These represent “free” and available materials.
Also available are plastic bottles, plastic trays, bubble wrap and anything else you can think of – but these are kept at the front and have a price attached to them. The actual value you give them is arbitrary but they are supposed to represent things that are scarce in the communities we are considering. For example, plastic bottles might represent sealed oil drums, bubble wrap might be tarpaulins etc.
(Note, all materials can and should be recovered at the end of the session – the rafts are broken down and materials reused on other occasions).
With a year 6 group, you should be able to get them to discuss and draw out their design as a team first (maybe first 10 mins of building section), then send one person to get what they need (including paying – I haven’t given them a budget as such, just kept a record of what they have “spent”, but you could give each group a fixed budget if you wanted to (and then judge your winner differently).
Time: 30 minutes
You will need: A playground. Chalk or similar. Hats or sashes (see below).
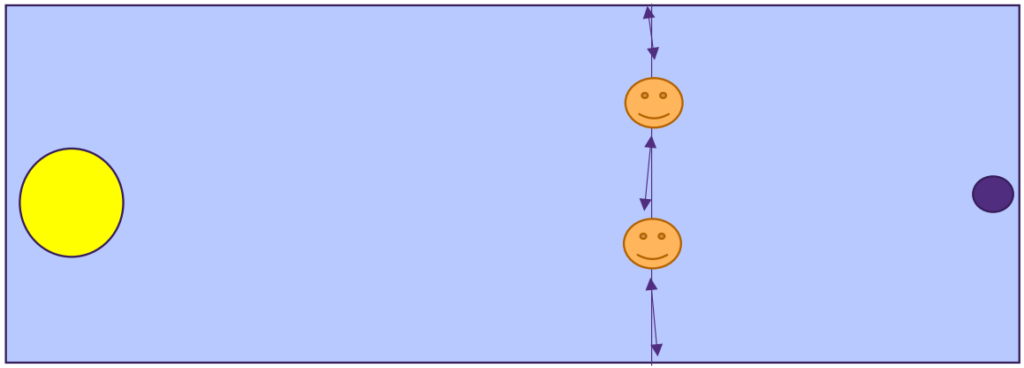
This playground game demonstrates the way Greenhouse gases return energy to the Earth’s surface – as well as allowing the students to run off some energy!
a) With chalk or similar, mark a Sun and an Earth at opposite ends of the school playground. If possible also draw a line across the playground, a third of the way between the Earth and the Sun.
b) Choose 2 students to be greenhouse gases – if possible give them a hat or sash to identify them.
Which greenhouse gases have they heard of? One could be water and the other carbon dioxide.
They are allowed to move only along the line you have drawn. Their role is to try and touch the other students as they run past but only when they are running from the Earth towards the Sun!
c) The other students are all ‘energy’ and start off by the Sun.
d) The ‘energy’ should run to the Earth and back again, repeatedly. If the ‘greenhouse gas’ students manage to touch them, then they have to run 10 times between the greenhouse gas line and the Earth before being allowed to return to the Sun.
e) After a few minutes of doing this, stop the students and increase the numbers of ‘greenhouse gas’ students – you could add a methane, or another water.
f) Again, let them play this for a while, then stop them and ask what has changed. They should notice that there is now more ‘energy’ trapped near the Earth.
g) You could increase the amount of greenhouse gas again and let them see what happens.
h) Finish by talking about how greenhouse gases are essential to maintaining our climate, but that increasing the amount of greenhouse gas leads to heating. You may need to talk a little bit about the different forms energy can take – light, heat etc.
Resource produced in conjunction with Sustainability Physics.
This could be used as a starter exercise: Can students do the whole question at once given only the radius of the Earth, the temperature rise and the specific heat capacity of sea water?
Resource produced in conjunction with Sustainability Physics.
The world’s oceans are heating. Their temperature is not rising as fast as that of the land or air, but they are the major store of the excess thermal energy resulting from greenhouse gas emissions
The top 700m of the oceans have warmed by 0.18°C on average between 1955 and 2010.
This resource investigates how big this store of thermal energy is.
The 2022 United Nations climate change conference (27th session of the Conference of Parties – COP27) will be held in Sharm El-Sheikh in Egypt, starting on the 7th of November.
In the introduction video screened at the end of COP26 in Glasgow, Egypt celebrates its road-building project. This resource explores efficient road designs and the climate impacts of car travel.
Resources:
Created with support from MEI
Show the Egypt introduction video from COP26 and show them the pictures of new Egyptian roads.
Road-building clip only:
Or the full Egypt introductory clip: from 09:21-12:26 in https://unfccc-cop26.streamworld.de/webcast/closing-plenary-of-the-cop-followed-by-cmp-and-c-2
Ask students what comments or questions they have on the video: What do they wonder?
They could discuss in pairs or groups before giving feedback to the class.
You could steer the discussion towards some of the following points:
The remainder of the lesson uses maths to explore the last point.
This could be introduced as motivation for the Steiner problem, or as a real world application once the problem has been solved (after section 3).
One of the new roads connects Beni Suef and Zaafarana. https://scoopempire.com/where-to-%EF%BB%BFegypt-launches-a-series-of-road-and-construction-projects-to-link-up-cities-far-and-wide/
Together with the important cities of Cairo and Suez, this can be simplified and framed as an example of the famous ‘Steiner Problem’:
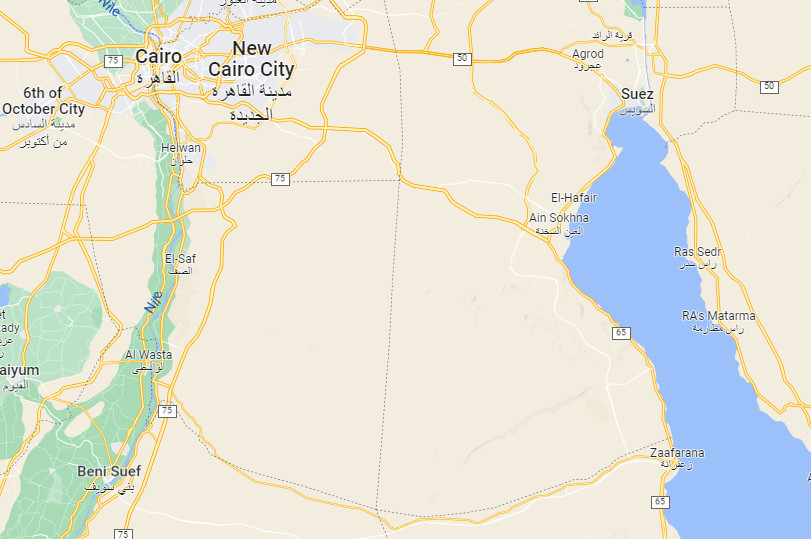
Source: Google maps
Which looks a bit like:
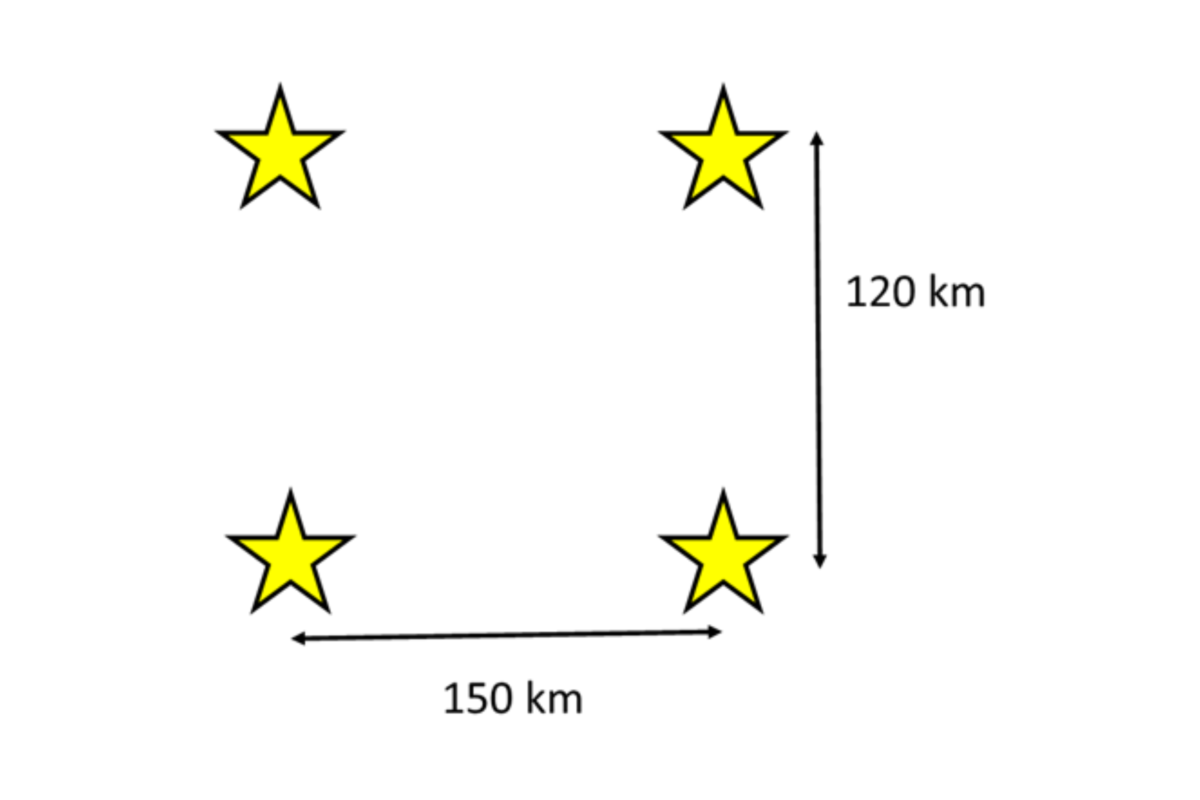
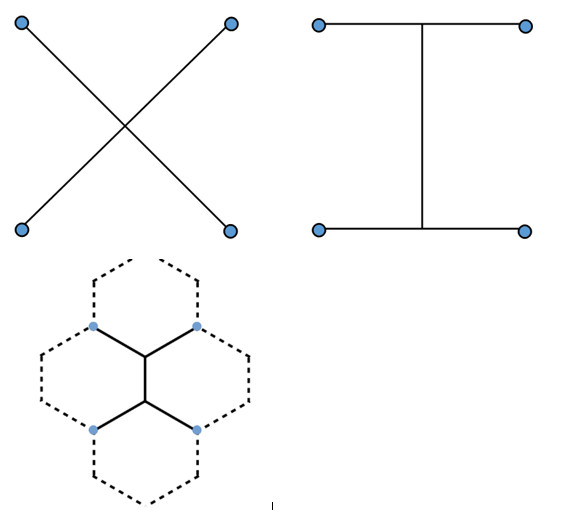
To simplify the problem, start by investigating 4 cities in a square. What is the most efficient way to connect all the cities (using the shortest distance of road)? You need to be able to visit all the cities on the road network, but you can go via other cities.
This problem is also described here: https://nrich.maths.org/14937
Students can use the sheet of squares (or squared paper) to draw as many different designs as they can think of, using curves and straight lines, or just straight lines.
Collect some ideas and ask students to calculate the total road distance required. For the square side length, you could use realistic road-distance numbers (eg 100km), simple numbers (eg 10, 1) or a symbol such as x. Students could first measure the distances using a ruler, then calculate them using Pythagoras’ theorem.
Help students to arrive at the optimal solution by considering the two designs below: Is there an intermediate design that would be even better?
Once students have arrived at the optimal solution, this video gives a good demonstration using soap bubbles: https://www.youtube.com/watch?v=dAyDi1aa40E
At this point you could choose to start using realistic road distances or the fact that the cities are not in a square but are closer to a rectangle (see the first extension point below).

Learning objectives: to apply the equations
energy for a change of state = mass × specific latent heat
energy transferred = power × time
to a real world situation.
When water evaporates from the leaves of trees, is it called evapotranspiration. The latent heat required for this comes from the thermal store of energy in the surroundings. This question compares the cooling power of evapotranspiration from an oak tree to air conditioning.
energy for a change of state = mass × specific latent heat
400 kg * 2700 kJ/kg
power = energy transferred / time
time = 24*3600
power = 10 kW
10 kW / 2.5 kW = 4 units
Aim: Students should be able to describe the effects of reflection, transmission and absorption of waves at material interfaces.
This activity would work well as a think/ pair/ share activity, and could also be displayed as a poster or other presentation.
The chlorophyll in green leaves of a tree absorbs the red and blue light in the visible Electromagnetic radiation from the Sun. The green light is reflected.
A green umbrella would do the same.
Both cast a shadow on the ground, implying that less visible light reaches the ground.
The ground also reflects some of the sunlight and absorbs the rest.
Absorbed sunlight increases the thermal store of energy.
The greater the thermal energy stored in an object, the more infrared radiation, heat, it emits.
Would you feel cooler walking along a road that is shaded by trees than you would if you carried a green umbrella?
Both the umbrella and the trees will reduce the amount of sunlight reaching you and warming you up.
They will also reduce the amount of sunlight reaching the ground. However, the trees are permanent and will have been shading the ground all day, so the ground in the shadow of the trees will be cooler than the ground in the shadow of a moving umbrella.
The heat, infrared radiation, reaching you from the ground will be lower in the shadow of the trees.
Extended ideas
These could include:

Here is a broad range of simple (ish) climate models suitable for relatively advanced students:
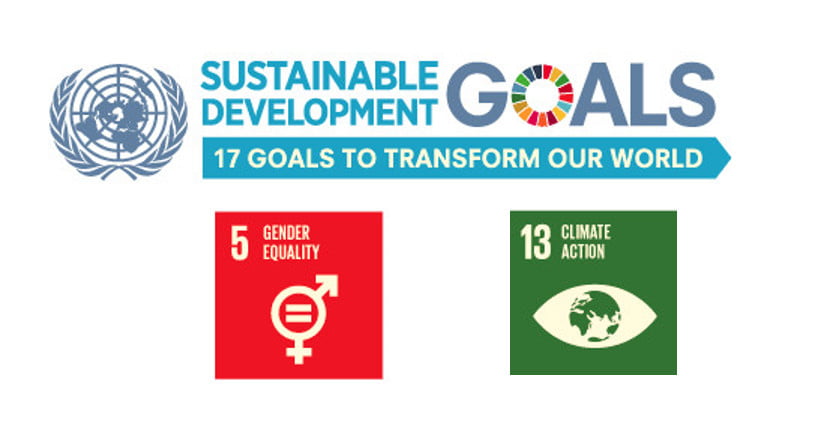
In this resource we will explore the links between two of the Sustainable Development Goals – gender equality, and climate action.
According to the 2022 Intergovernmental Panel on Climate Change Report1
Climate resilient development is facilitated by developing partnerships with traditionally marginalised groups, including women, youth, Indigenous Peoples, local communities and ethnic minorities
IPCC 20221 SPM.D.2
Salinisation-associated changes may disproportionately burden women responsible for securing drinking water and fuel, such as in the Indian Sundarbans.
IPCC 20221, Section 3.5.5.3
Changes in water-related hazards disproportionately impact vulnerable populations such as the poor, women, children, Indigenous Peoples, and the elderly in all locations, especially in the Global South.
IPCC 20221, Chapter 4
Many countries and social groups most threatened by climate change have contributed the least to the problem and do not have the adequate resources to adapt. Water adaptation policies enabled through ethical co-production between holders of Indigenous Knowledge, local knowledge and technical knowledge; through cooperation and coordinated actions among multiple actors, including women and all marginalized groups, at various levels of governance is needed for effective transitions towards Climate Resilient Development.
IPCC 20221, Chapter 4
Climate-induced water scarcity and supply disruptions disproportionately impact women and girls. The necessity of water collection takes away time from income-generating activities, child care, and education.
IPCC 20221, section 4.3.3
Although women are often depicted as victims of climate change-induced water scarcity, they are also proactive adaptation actors
IPCC 20221 section 4.8.3
Optional activity – read out these statements and explore what phrases such as water-related hazards, climate resilient development, adaptation, salinisation, Indian Sundarbans etc. mean.
Optional Activity – watch these clips3 from the gender equality day at COP26.
Read this extract from the Malala Fund report2. The Malala Fund is working for a world where every girl can learn and lead.

Summarise the information in the extract in the following table:

The Malala Fund estimates that in 2021 climate-related events will prevent at least four million girls in low and lower-middle-income countries from completing their education. If current trends continue, by 2025 climate change will be a contributing factor in preventing at least 12.5 million girls from completing their education each year.
Complete this knowledge organiser using your existing knowledge of extreme weather and climate change :

The Mahila Housing Sewa Trust (MHT)’s mission is to organize and empower women in poor communities to improve their habitat.
A quality habitat is a home with all basic services such as clean water, toilets, electricity, and adequate light and ventilation. It is a key financial asset that supports livelihoods, and makes the poor more resilient to heat stress, disease, and other hazards of climate change. Women understand that a strong neighbourhood is essential to upgrading individual homes. They know how to work together to bring much needed services in their under-served communities.
Watch this video:
Watch this video
Watch this video
© 2024 Royal Meteorological Society
RMetS is a registered charity No. 208222
By clicking any link on this page you are giving your consent for us to set cookies. More info
Strictly Necessary Cookie should be enabled at all times so that we can save your preferences for cookie settings.
If you disable this cookie, we will not be able to save your preferences. This means that every time you visit this website you will need to enable or disable cookies again.