Precipitation has been recorded in the British Isles for over 200 years. Through the dedication and enthusiasm of W R Symons, the mid-19th century saw the formation of the British Rainfall Organisation whose main objective was to establish a countrywide network of rain gauges where daily measurements were made. This network has grown to over 7,000 gauges today, including many that are automatic.
As most people in the British Isles know, precipitation can be extremely variable, both in intensity and duration. The spatial distribution of precipitation during an individual month is very uneven, just as it is on an individual day. Rainfall in Britain is associated with several distinct synoptic situations; all places may get rain from most such types, but some areas get more from some types than others. Therefore, it is not surprising that patterns of temporal variation of rainfall are complex.
Precipitation over the British Isles is the result of one or more, of three basic mechanisms.
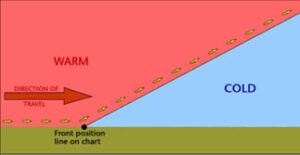
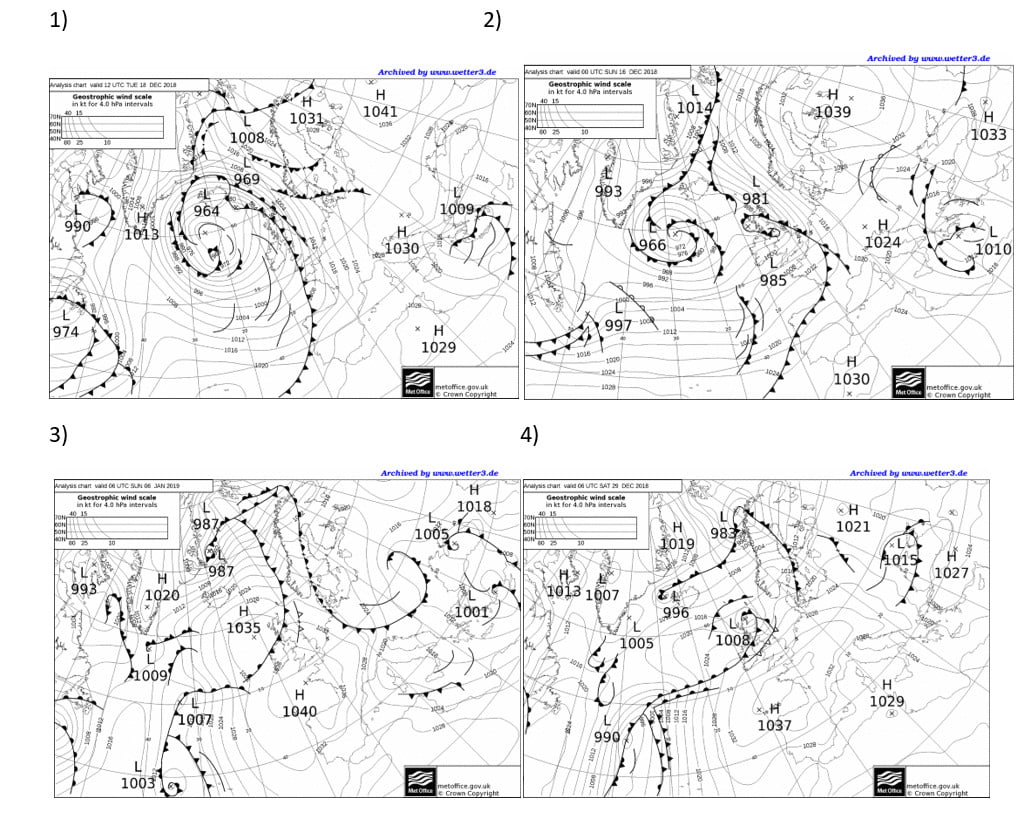
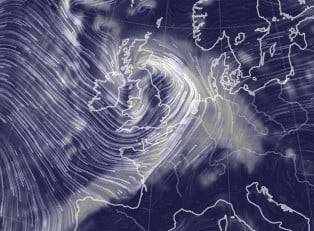
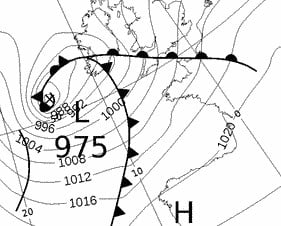
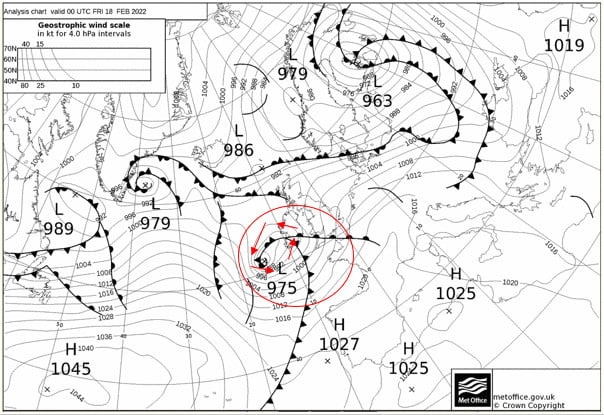
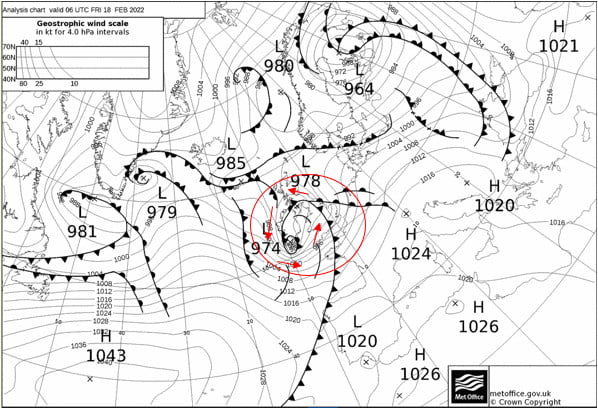
1. Cyclonic, or frontal, rain associated with the passage of low-pressure systems. Bands of rain are associated with the passage of warm and cold fronts across the UK. These rain events are caused by the uplift and cooling of moist air parcels.
2. Convectional, with local showers and thunderstorms, caused by the localised thermal heating and overheating of the ground surface. Large towering cumulonimbus clouds may be generated, producing heavy rain.
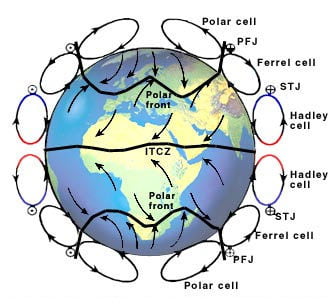
3. Orographic, or relief rain, with precipitation increasing with altitude over upland areas. The mechanism for relief rain is the uplift and cooling of moist air over upland areas. The normal rate of cooling (environmental lapse rate) is 6.5 °C per 1,000 metres. Therefore, near the summit on the windward side of the hill or mountain, the air will have cooled sufficiently for thick cloud, rain and possibly snow to fall.
Air will descend and warm on the leeward side, so there is little or no rain on this leeward side of the hill or mountain. This is called a rain shadow, and sometimes there are warm winds in these sheltered areas as the air, now much drier than during its ascent, descends quickly and warms up. This is called a föhn effect, and the warm winds are called föhn winds.
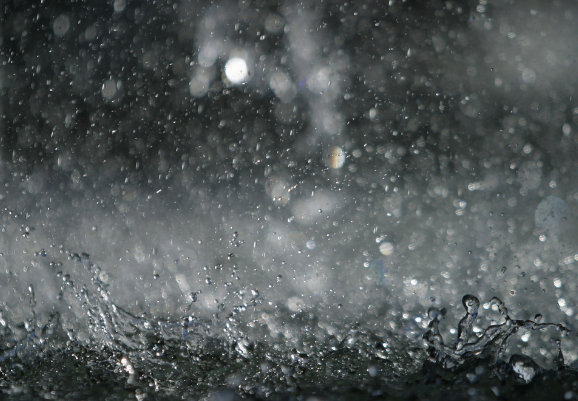
Rain forms when air cools, the rate of condensation becomes faster than the rate at which water is evaporating and cloud droplets form. If these get big enough, they form as rain – or snow, sleet or hail.
There are various ways in which the air can cool to form rain – three common types which are often talked about are frontal, orographic or relief and convective rain. Frontal Rain
This is found where warm air meets cold at the cold and warm fronts in a depression.
Convective Rain
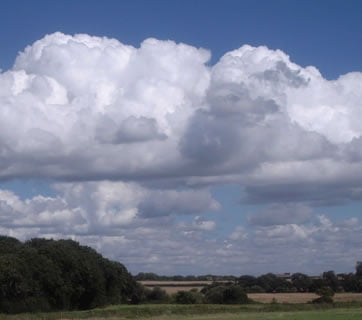
Convection is the term given to warm air rising. Convection is normally marked by cumulus clouds which billow upwards as the air rises. The base of such clouds is usually flat, marking the level where temperatures are cold enough for more condensation to be going on than evaporation.
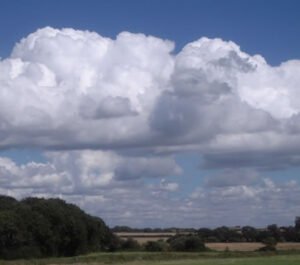
Image copyright RMetS
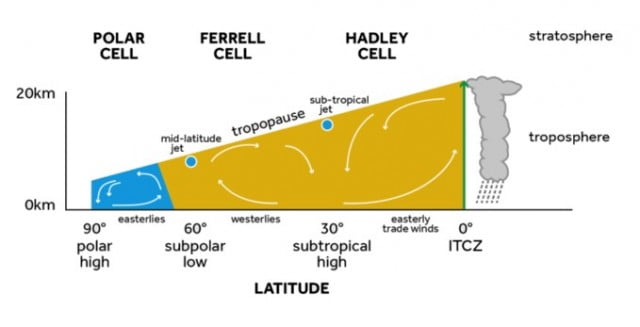
Extreme convection can be found in thunder clouds – towering cumulonimbus, which can reach all the way up to the top of the troposphere – the lowest 10km or so of the atmosphere in which our weather is found. As air can’t rise into the stratosphere above, the top of the cumulonimbus cloud spreads out, giving it a characteristic ‘anvil’ shaped top. Such convection can occur where the ground has become particularly warm, heating the air above it. It is particularly associated with the Tropics, characteristically giving heavy rain in the late afternoon.
Cumulonimbus clouds can give heavy rain, hail, thunder lightning and sometimes tornadoes.

Cumulonimbus cloud over Kettering, UK, August 2014
Image copyright Sylvia Knight
Orographic or Relief Rain
When air is forced to rise over land, particularly higher ground such as hills and mountains, it cools as the pressure falls. Dry air cools at 9.8°C per 1000m it rises. Eventually, the air can cool enough for cloud to form.

Orographic cloud forming upstream of the Matterhorn
Image copyright RMetS
The cloud droplets may get big enough to fall as rain on the upstream side of the mountain. If that happens, then, when the air has passed over the top of the mountain and starts to descend, and warm, on the far side, there will be less water to evaporate back into the air. The air will end up drier than it was on the upstream side of the mountain.
This can produce ‘rain shadow’ – an area of land downstream from some mountains (for the prevailing wind direction, in the UK, this would be to the east) where there is noticeably less rainfall. The Gobi desert in Mongolia and China is so dry because it is in the rain shadow of the Himalayas.
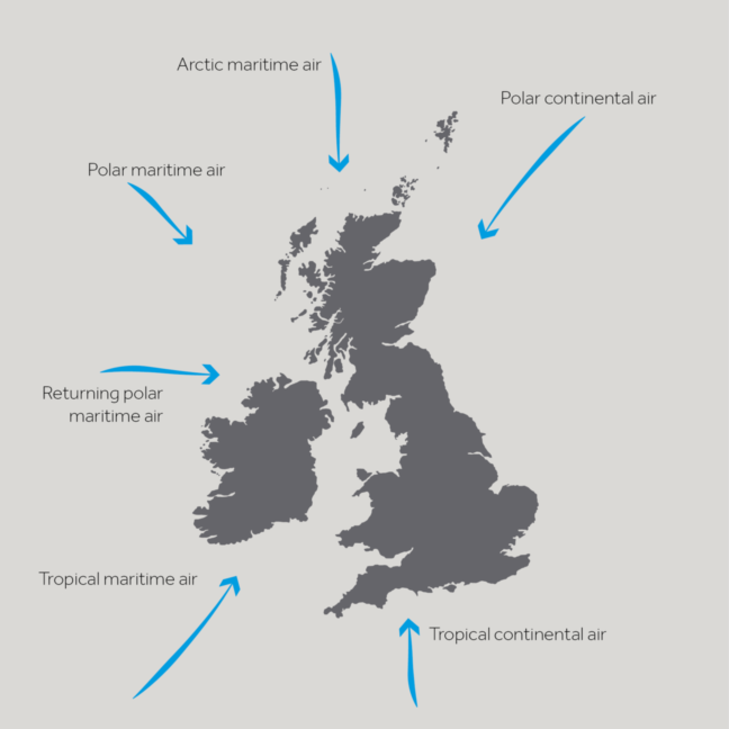
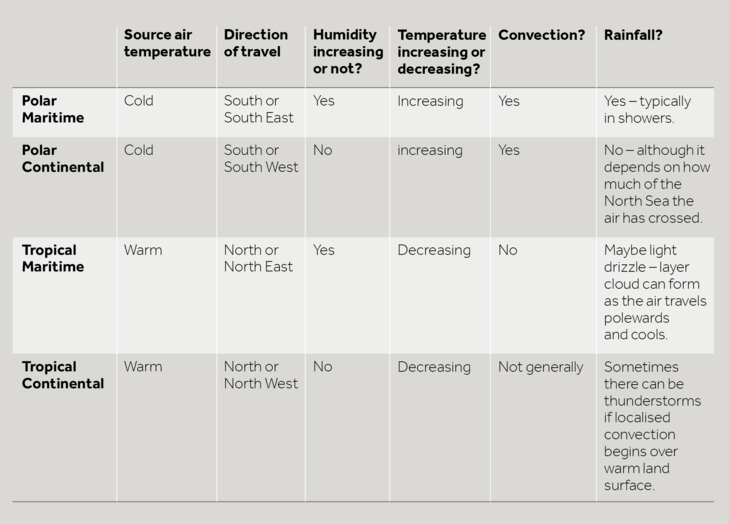
Orography can enhance frontal or convective rain; for example, we have explored how polar maritime air, our prevailing air mass, brings convective rain to the Atlantic. As the air reaches the UK and rises over the land, the precipitation is increased.
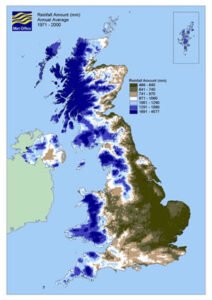
A precipitation map showing the rainfall ‘climate’ (averaged over 30 years) of the UK. With prevailing westerly winds, there is clearly more rain on the western side of the country, enhanced by the mountains of Wales and Scotland and the English Pennines.
As well as being drier on the downwind side of the mountains, it can also be warmer. Remember that water releases heat into the atmosphere as it condenses and takes it up as it evaporates. If there is less water in the air on the downwind side, then there is less to evaporate and not all the heat that was released on the upwind side will be taken up again. This is known as the Föhn Effect.
The onset of a Föhn is generally sudden. For example, the temperature may rise more than 10°C in five minutes and the wind strength increase from almost calm to gale force just as quickly. Föhn winds occur quite often in the Alps (where the name originated) and in the Rockies (where the name chinook is used). They also occur in the Moray Firth and over eastern parts of New Zealand’s South Island. In addition, they occur over eastern Sri Lanka during the south-west monsoon.
Where there are steep snow-covered slopes, a Föhn may cause avalanches from the sudden warming and blustery conditions. In Föhn conditions, the relative humidity may fall to less than 30%, causing vegetation and wooden buildings to dry out. This is a long-standing problem in Switzerland, where so many fires have occurred during Föhn conditions that fire-watching is obligatory when a Föhn is blowing.
Teaching Resources
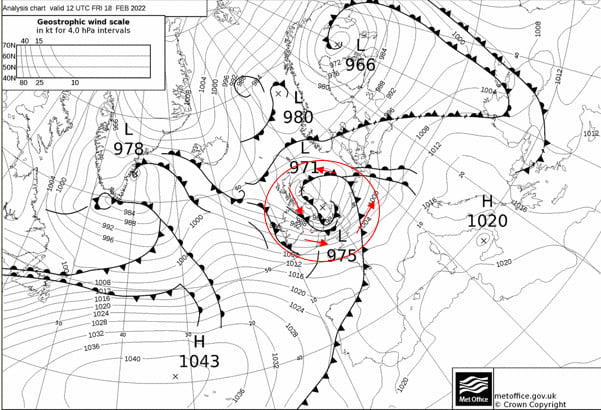
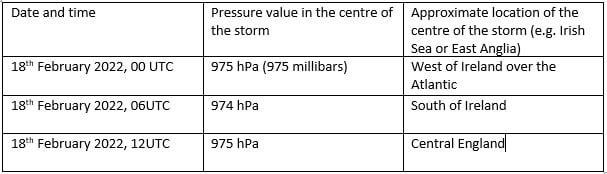
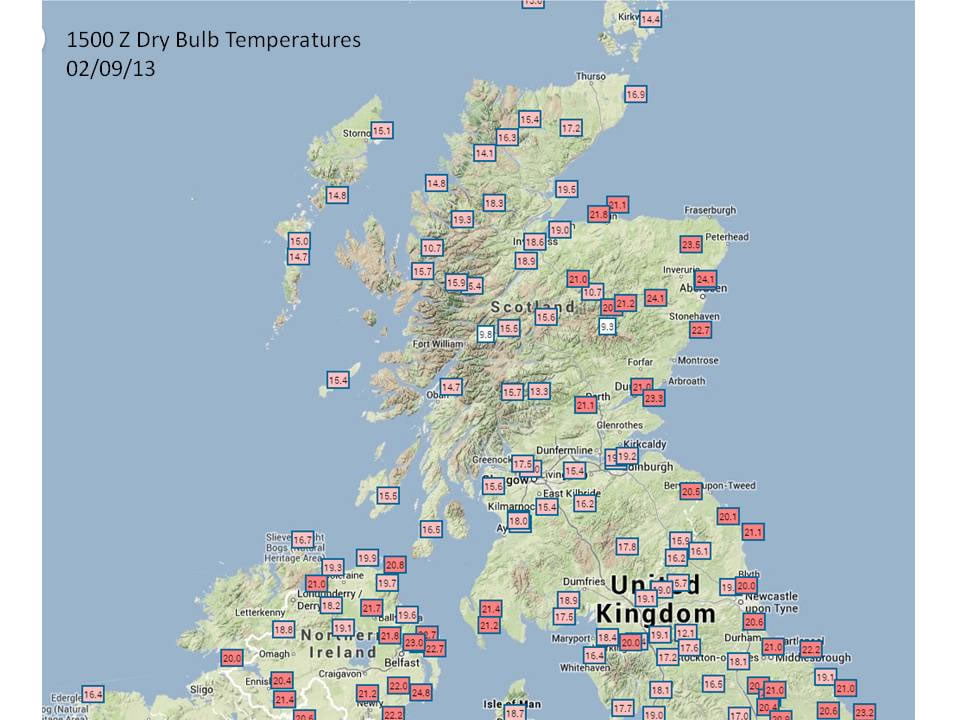
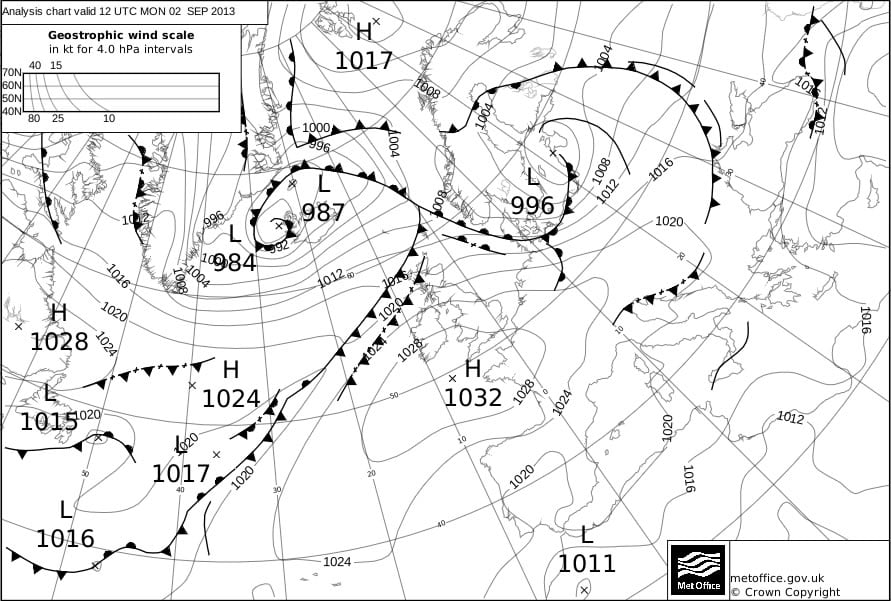
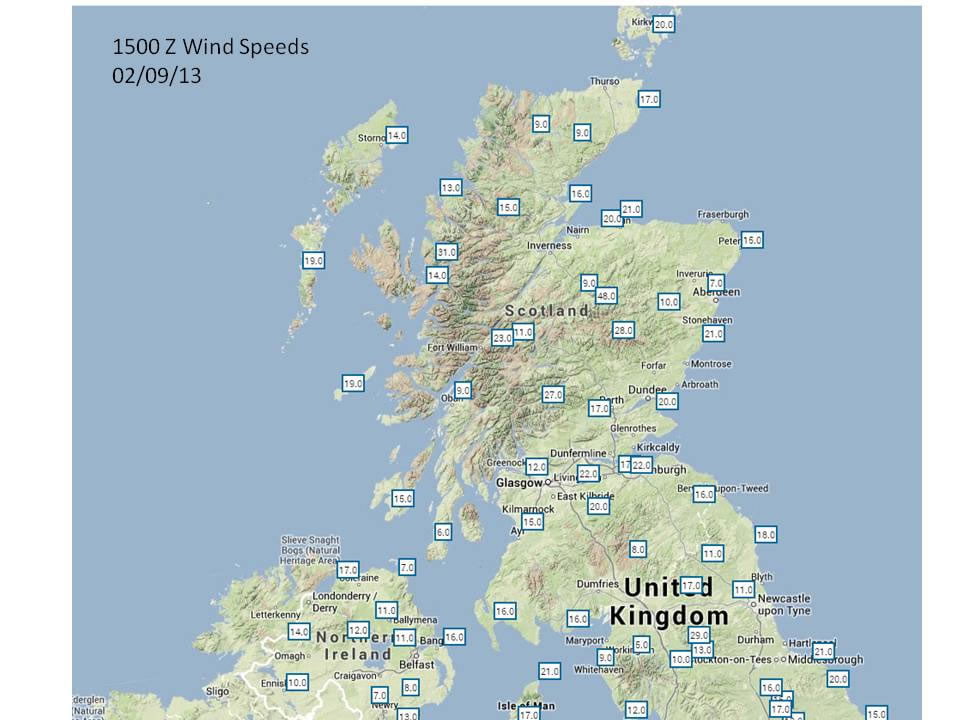
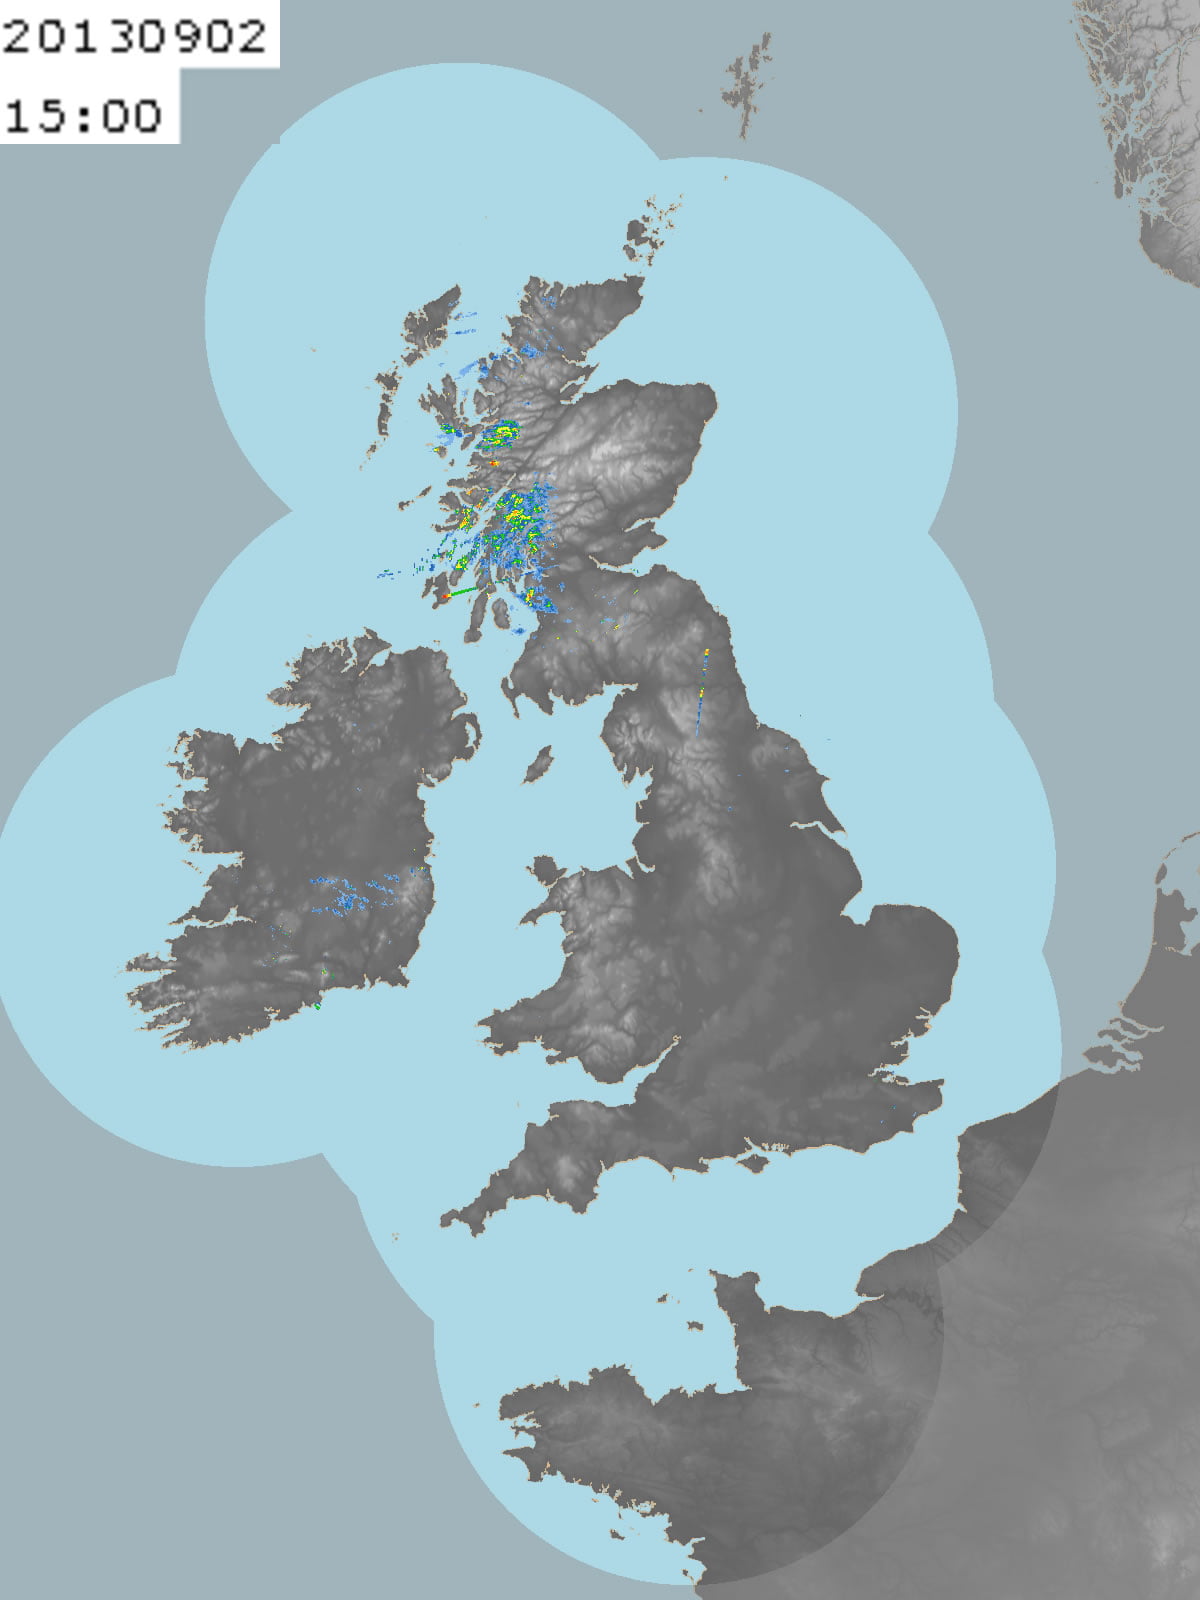
A case study of orographic rainfall and Foehn winds in Scotland with images for students Image 1, Image 2, Image 3, Image 4, Image 5.
Water in the Atmosphere from Weather and Climate: a Teachers’ Guide
Make a cloud in a bottle
Data and Image Sources
UK climate data from the Met Office


