Climate Change Concept Association Tool

This tool is best used on a laptop or other larger screen and may not function correctly on a phone.

Climate Change Glossary and Resources

Select a letter to see a definition of the terms in the climate change association tool. Alternatively, to find a teaching resource associated with any of the terms, use the ‘all climate change’ drop-down menu on the right. Not all the terms have associated resources yet, but we are adding new ones all the time.

Storm Surges

Watch this short animation to learn about the causes and impacts of storm surges in the UK, as well as the expected impact of climate change on them. 

At the bottom of the page, you can download a Knowledge Organiser to complement the animation.

With thanks to the students and staff at Boston College for their contribution to the animation. 

Fieldwork Suggestions for Independent Investigations

Some ideas, data sources and guidance for students wishing to include weather measurements in their NEA or EPQ.

Updated November 2022

A guide to collecting weather data

https://www.rgs.org/CMSPages/GetFile.aspx?nodeguid=59f46632-ae51-4ea7-ab94-a0c537eb3c71&lang=en-GB

Passage of a depression

https://www.metlink.org/wp-content/uploads/2020/12/depression_wow_teacher_Eva.pdf
Data source:

http://wow.metoffice.gov.uk

Weather and Health/ Behaviour

Data source: http://wow.metoffice.gov.uk

Urban Climates

Using Wow data to look at urban heat islands https://www.metlink.org/resource/using-wow-to-illustrate-the-urban-heat-island-effect/

Urban winds: fieldwork guidance can be found on https://www.metlink.org/fieldwork-resource/fieldwork-in-geography/

Urban temperature https://www.metlink.org/fieldwork-resource/urban-heat-island-introduction/
Data source: http://wow.metoffice.gov.uk

Community resilience to extreme weather

Local microclimate

https://www.metlink.org/fieldwork-resource/using-usb-temperature-dataloggers/

https://www.rgs.org/schools/teaching-resources/quick-and-easy-ideas/

Data source: http://wow.metoffice.gov.uk

Factors affecting rainfall:


https://www.manchester.ac.uk/discover/news/tuesday-wettest-day-of-week-suggests-new-analysis/
https://rmets.onlinelibrary.wiley.com/doi/10.1002/joc.2321

Orographic rainfall https://www.metlink.org/resource/orographic-relief-rainfall-and-the-foehn-effect/


Red Sky at Night


https://www.metlink.org/resource/red-sky-teachers/ with an introductory concept cartoon from the ASE 
https://www.metlink.org/blog/folklore/weather-folklore/

Snow

 https://www.metlink.org/blog/extreme-weather/when-will-it-snow/

Sky Colour


https://www.exploringoverland.com/constantapprentice/2021/8/10/making-a-cyanometer-to-measure-sky-moisture-through-color with https://uk-air.defra.gov.uk/interactive-map pollution forecast and pollen forecast http://www.metoffice.gov.uk/health/public/pollen-forecast

Weather and Flooding


Data source: National River Flow Archive http://nrfa.ceh.ac.uk/ and https://environment.data.gov.uk/hydrology/index.html#/landing

Sea level

http://www.coolgeography.co.uk/GCSE/AQA/Coastal%20Zone/Sea%20level%20rise/Sea%20level%20rise.htm

Land and Sea breezes, sea breeze front

Data source: http://wow.metoffice.gov.uk

Air Masses


https://earth.nullschool.net/
http://www1.wetter3.de/Archiv/archiv_ukmet.html
various links on https://www.metlink.org/teaching-resources/?_sft_topic=air-masses
including https://www.metlink.org/resource/pressure-and-rainfall/
Data source: http://wow.metoffice.gov.uk

General resources


https://www.metlink.org/fieldwork-resource/instruments-and-fieldwork/


https://www.rgs.org/schools/teaching-resources/key-stage-five/extreme-weather/


https://www.metlink.org/fieldwork/


https://www.rgs.org/schools/teaching-resources/a-student-guide-to-the-a-level-independent-investi/


https://www.field-studies-council.org/resources/16-18-geography/route-to-enquiry/

IPCC 2021 – Extreme Heat in Urban Africa

Climate Change Quality Mark Content

Climate change has increased heat waves (high confidence) and drought (medium confidence) on land, and doubled the probability of marine heatwaves around most of Africa.

Heat waves on land, in lakes and in the ocean will increase considerably in magnitude and duration with increasing global warming.

Most African countries will enter unprecedented high temperature climates earlier in this century than generally wealthier, higher latitude countries, emphasising the urgency of adaptation measures in Africa.

IPCC 2021 – Energy Security in Africa

Climate Change Quality Mark Content
  • The focus of these resources are to explore climate change and energy security in Africa.
  • Hydro electric power has been identified as a more sustainable way for Africa to achieve energy security in the future.
  • Throughout the continent of Africa there are already many hydroelectric power stations, with many more planned over the coming decades.
  • Climate change could potentially impact upon these plans. These resources focus upon that relationship.

IPCC 2021 – Climate Change in Africa

Climate Change Quality Mark Content

Africa: Climate Change Impact and Mitigation

Africa is one of the lowest contributors to global greenhouse gas emissions, yet key development sectors are already experiencing widespread losses and damages attributed to human-induced climate change.

Widespread negative impacts of 1.5-2°C of global warming are projected for Africa. These impacts are likely to be severe due to reduced food production, reduced economic growth, increased inequality and poverty, biodiversity loss, and increased human mortality.

Exposure to climate change in Africa is multi-dimensional. There are socioeconomic, political, and environmental factors which make people more vulnerable. Socioeconomically, Africans are disproportionately employed in climate-exposed sectors: 55-62% of the sub-Saharan workforce is employed in agriculture and 95% of cropland is rainfed. In decision-making, particularly in rural Africa, poor and female-headed households have less sway and face greater livelihood risks from climate hazards. Environmentally, in urban areas, growing informal settlements without basic services increase the vulnerability of large populations to climate hazards, especially women, children, and the elderly.

Climate adaptation across Africa is therefore crucial to lessen the impact of future warming, is generally cost-effective, and will provide social, economic, and environmental benefits to the vulnerable. However, the current finance available is far less than adaptation costs. Most adaption options are effective at present-day warming but their effectiveness for future warming is unknown.

Climate: Impact and projected risks

Most African countries will enter unprecedented high temperature climates earlier in this century than generally wealthier, higher latitude countries, emphasising the urgency of adaptation measures in Africa.

Both mean temperature and extreme temperature trends will increase across the continent, resulting in more heatwaves and drought. With above 1.5°C of global warming, drought frequency and duration will particularly increase over southern Africa. If 2°C global warming occurs there will be decreased precipitation in North Africa whilst any rise above 3°C of global warming will lead to drought duration in North Africa, the western Sahel, and southern Africa doubling from 2 to 4 months.

Bar north and southwestern Africa, rainfall events will also increase in frequency and intensity across Africa, at all levels of global warming.

Consequently, multiple African countries are facing compounding risks in the twenty-first century.

Hydrological variability and water scarcity will increase and will have a cascading impact on water supply and hydrological power production.

Climate change has already reduced economic growth across Africa, one estimate suggests gross domestic product (GDP) per capita for 1991–2010 in Africa was on average 13.6% lower than if climate change had not occurred.

Future warming will negatively affect food systems in Africa by shortening growing seasons and increasing water stress. With 1.5°C of global warming, declines are projected in suitable areas for coffee and tea in east Africa, for olives yields in north Africa, and for sorghum yields in west Africa.

Mortality and morbidity are expected to escalate as of tens of millions of Africans will be exposed to extreme weather and an increase in the range and transmission of infectious diseases.

Climate change is projected to increase migration. Africa’s rapidly growing cities will be hotspots of risks from climate change and climate-induced in-migration, which will amplify pre-existing stresses such as poverty, informality, social and economic exclusion, and governance.

Increasing temperatures are likely to cause drought-associated conflict risk.

IPCC 2021 – Wildfire

Climate Change Quality Mark Content

Wildfire: Causes, Impacts and Responses

Wildfire is a natural and essential part of many forest, woodland and grassland ecosystems, killing pests, releasing plant seeds to sprout, thinning out small trees and serving other functions essential for ecosystem health. Excessive wildfire, however, can kill people, the smoke can cause breathing illnesses, destroy homes and damage ecosystems.

Anthropogenic climate change increases wildfire by exacerbating its three principal driving factors: heat (by drying out vegetation and accelerating burning), fuel and ignition. Non-climatic factors also contribute to wildfires—in tropical areas, fires are set intentionally to clear forest for agricultural fields and livestock pastures.

Urban areas and roads create ignition hazards. Governments in many temperate-zone countries implement policies to suppress fires, even natural ones, producing unnatural accumulations of fuel in the form of coarse woody debris and high densities of small trees. The fuel accumulations cause particularly severe fires that burn upwards into tree crowns.

Globally, 4.2 million km2 of land per year burned on average from 2002 to 2016, with the highest fire frequencies in the Amazon rainforest, deciduous forests and savannas in Africa and deciduous forests in northern Australia.

Across the western USA, increases in vegetation aridity due to higher temperatures from anthropogenic climate change doubled burned area from 1984 to 2015 over what would have burned due to non-climate factors including unnatural fuel accumulation from fire suppression, with the burned area attributed to climate change accounting for 49%  of cumulative burned area.

Anthropogenic climate change doubled the severity of a southwest North American drought from 2000 to 2020 that has reduced soil moisture to its lowest levels since the 1500s, driving half of the increase in burned area. In British Columbia, Canada, the increased maximum temperatures due to anthropogenic climate change increased burned area in 2017 to its highest extent in the 1950–2017 record, seven to eleven times the area that would have burned without climate change.

In Alaska, USA, the high maximum temperatures and extremely low relative humidity due to anthropogenic climate change accounted for 33–60% of the probability of wildfire in 2015, when the area burned was the second highest in the 1940–2015 record.

In National Parks and other protected areas of Canada and the USA, climate factors (temperature, precipitation, relative humidity and evapotranspiration) accounted for 60% of burned area from local human and natural ignitions from 1984 to 2014, outweighing local human factors (population density, roads and built area).

In summary, field evidence shows that anthropogenic climate change has increased the area burned by wildfire above natural levels across western North America in the period 1984–2017, at Global Mean Surface Temperature increases of 0.6°C–0.9°C, increasing burned area up to 11 times in one extreme year and doubling it (over natural levels) in a 32-year period.

Regarding global terrestrial area as a whole, from 1900 to 2000, fire frequency increased on one-third of global land, mainly from burning for agricultural clearing in Africa, Asia and South America.

Where the global average burned area has decreased in the past two decades, higher correlations of rates of change in burning to human population density, cropland area and livestock density than to precipitation indicate that agricultural expansion and intensification were the main causes.  The fire-reducing effect of reduced vegetation cover following expansion of agriculture and livestock herding can counteract the fire-increasing effect of the increased heat and drying associated with climate change.

The human influence on fire ignition can be seen through the decrease documented on holy days (Sundays and Fridays) and traditional religious days of rest. Overall, human land use exerts an influence on wildfire trends for global terrestrial area as a whole that can be stronger than climate change.

In the Amazon, deforestation for agricultural expansion and the degradation of forests adjacent to deforested areas cause wildfire in moist humid tropical forests not adapted to fire. Roads facilitate deforestation, fragmenting the rainforest and increasing the dryness and flammability of vegetation.

In the extreme fire year 2019, 85% of the area burned in the Amazon occurred in areas deforested in 2018. In the Amazon, deforestation exerts an influence on wildfire that can be stronger than climate change.

Overall, burned area has increased in the Amazon, Arctic, Australia and parts of Africa and Asia, consistent with, but not formally attributed to, anthropogenic climate change.

Deforestation, peat draining, agricultural expansion or abandonment, fire suppression and inter-decadal climate cycles exert a stronger influence than climate change on wildfire trends in numerous regions outside of North America.

The global increases in temperature from anthropogenic climate change have increased aridity and drought, lengthening the fire weather season (the annual period with a heat and aridity index greater than half of its annual range) on one-quarter of global vegetated area and increasing the average fire season length by one-fifth from 1979 to 2013.

Climate change has contributed to increases in the fire weather season or the probability of fire weather conditions in the Amazon, Australia, Canada, central Asia, East Africa and North America

In non-forest areas, the burned area correlates with high precipitation in the previous year, which can produce high grass fuel loads.

Globally, fire has contributed to biome shifts and tree mortality attributed to anthropogenic climate change. Through increased temperature and aridity, anthropogenic climate change has driven post-fire changes in plant regeneration and species composition in South Africa – in the fynbos vegetation of the Cape Floristic Region, South Africa, post-fire heat and drought and the legacy effects of exotic plant species reduced the regeneration of native plant species, decreasing species richness by 12% from 1966 to 2010

Continued climate change under high-emission scenarios that increase global temperature ~4°C by 2100 could increase global burned area by 50% to 70% and global mean fire frequency by ~30%. Lower emissions that would limit the global temperature increase to <2°C would reduce projected increases of global burned area to 30% to 35% and projected increases of fire frequency to ~20%.

Increased wildfire increases risks of tree mortality, biome shifts and carbon emissions as well as high risks from invasive species. Wildfire risks to people include death and destruction of their homes, respiratory illnesses from smoke, post-fire flooding from areas exposed by vegetation loss and degraded water quality due to increased sediment flow. Increased wildfire under continued climate change increases the probability of human exposure to fire and risks to public health.

Regions identified as being at a high risk of increased burned area, fire frequency and fire weather include: the Amazon, Mediterranean Europe, the Arctic tundra, Western Australia and the western USA.  Moreover, increased fire, deforestation and drought, acting via vegetation–atmosphere feedbacks, increase the risk of extensive forest dieback and potential biome shifts of up to half of the Amazon rainforest to grassland, a tipping point that could release an amount of carbon that would substantially increase global emissions.

In the Arctic tundra, boreal forests and northern peatlands, including permafrost areas, climate change under the scenario of a 4°C temperature increase could triple the burned area in Canada, double the number of fires in Finland and double the burned area in Alaska. Thawing of Arctic permafrost due to wildfires could release 11–200 Gt Carbon which could substantially exacerbate climate change.

In Venezuela, Brazil and Guyana, Indigenous knowledge systems have led to a lower incidence of wildfires, reducing the risk of rising temperatures and droughts.

The Tasmanian Wilderness World Heritage Area has a high concentration of plant species which are restricted to living in cool, wet climates and fire-free environments, but recent wildfires have burnt substantial stands that are unlikely to recover. Most of the area is managed as a wilderness zone and is currently carried out in a manner that allows natural processes to predominate. There has been a realisation that this ‘hands off’ approach will not be sufficient.  After the wildfires in 2016 caused extensive damage, significant efforts and resources were spent trying to protect the remaining stands of pencil pine during the 2019 fires, using new approaches including the strategic application of long-term fire retardant and the installation of kilometres of sprinkler lines.  However, there is concern that these interventions may have adverse effects if applied widely. Increasingly, there is an acknowledgment that the cessation of traditional fire use has led to changes in vegetation and there are calls to incorporate Aboriginal burning knowledge into fire management.

Wildfires pose a significant threat to electricity systems in dry conditions and arid regions.  Solar PV generation is reduced by clouds and is less efficient under extreme heat, dust storms, and wildfires.

Severe impacts on railway infrastructure and operations can arise from the occurrence of temperatures below freezing, excess precipitation, storms and wildfires.

Adaptation for natural forests includes conservation, protection and restoration measures.

Restoring natural forests and drained peatlands and improving sustainability of managed forests generally enhances the resilience of carbon stocks and sinks.

In managed forests, adaptation options include sustainable forest management, diversifying and adjusting tree species compositions to build resilience, and managing increased risks from pests and diseases and wildfires.

Successful forest adaptation requires cooperation, inclusive decision making with local communities, and recognition of the inherent rights of indigenous people.

Ecosystem-based adaptation measures can reduce climatic risks to people, for example restoring natural vegetation cover and wildfire regimes can reduce risks to people from catastrophic fires.

A case study to illustrate the innovativeness of indigenous adaptation is the Bedouin pastoralists of Israel, where wildfires are a major cause of deforestation. Competing land use has reshaped the landscape with pine monocultures and cattle farming, reducing the availability of land suitable for herding goats the indigenous way, across the original landscape of shrubland or maquis (consisting mostly of oak and Pistacia). In addition, since 1950, plant protection legislation has decreased Bedouin forest pastoralism by defining indigenous black goats as an environmental threat. This has led to nature reserves where no human interference is allowed and shrubland regeneration, which is susceptible to wildfires.

In 2019, many severe wildfires occurred in Israel due to extreme heatwaves and, in response, plant protection legislation was repealed, allowing Bedouin pastoralists to graze their goats in these areas once more. The amount of combustible undergrowth subsequently decreased, reducing the risk for wildfire whilst also facilitating indigenous food sovereignty among the Bedouin.

Modelling of the interactions between climate-induced vegetation shifts, wildfire and human activities can provide keys to how people may be able to adapt to climate change.

Fire management plans and programmes are increasingly being developed, even in parts of Europe where wildfires are less common.

There is growing recognition of the need to shift fire management and suppression activities to co-exist with more fire on the landscape, particularly in North America. This includes widespread use of prescribed fire across landscapes to increase ecological and community-based resilience.

Climate-informed post-fire ecosystem recovery measures (e.g., strategic seeding, planting, natural regeneration), restoration of habitat connectivity and managing for carbon sequestration (e.g., soil conservation through erosion control, preservation of old growth forests, sustainable agroforestry) are critical to maximise long-term adaptation potential and reduce future risk through co-benefits with carbon mitigation. Prescribed fire and thinning approaches, including the use of indigenous practices, are receiving a new level of awareness.

Enhanced coordination between the health sector and fire suppression agencies can also reduce the health impacts of wildfire smoke via improving communication, weather forecasting, mapping, fire shelters and coordinating decision making.

All text and diagrams adapted from the WGII and WGIII reports of the IPCC Sixth Assessment Report https://www.ipcc.ch/report/ar6/wg3/ and https://www.ipcc.ch/report/ar6/wg2

KS3 Geography – Egypt’s Construction Problem

In this resource linked to COP27 in Egypt, geography students explore population growth, urbanisation and climate change. 

Introduction/Motivation

The 2022 United Nations climate change conference (27th session of the Conference of Parties – COP27) will be held in Sharm El-Sheikh in Egypt, starting on the 7th of November.

In the introduction video screened at the end of COP26 in Glasgow, Egypt celebrated its adaptations and mitigations to climate change. In this resource, students will explore population growth, urbanisation and the greenhouse gas emissions from the construction industry in Egypt.

Resources:

PowerPoint

Learning Outcomes

  • To understand what COP27 is
  • To describe how the population of Egypt has grown and is projected to grow in the future
  • To be able to interpret a population pyramid for Egypt and use that to explain Egypt’s changing population
  • To explain how the construction industry has an impact on the climate and what steps can be taken to reduce that impact.

Climate Change Transition Day

Climate Change Quality Mark Content

Notes for Person Delivering the Event

These resources are designed to be used in one session with year 6 (10/ 11 year old) students. Although they will support numeracy, literacy and various other aspects of the curriculum, they are designed to prepare students for secondary school rather than support the year 6 curriculum.

There are 6 suggested activities. Although they are designed to be run sequentially, you may choose to use only some of the activities, or to supplement them with your own ideas.

You may like to ask them to summarise their learning after each activity – this could be on post it notes on a cloud, or …

It should be possible to use these activities with any class size.

Many people, including Ellie Highwood, Cristina Charlton-Perez, Helen Johnson and Laila Gohar, have contributed to these resources.

1) The difference between weather and climate

Time: 30 minutes

You will need: Weather or Climate.pptx, one printed copy of Weather or Climate.docx for each pair of students and two dice per pair of students.

a) Show the images in the PowerPoint presentation and ask the students what each image shows and whether it is ‘weather’ or ‘climate’. Some may not have a clear answer!
b) Ask the students to get into pairs and give each pair one sheet and two dice.
c) Give them 5 minutes to roll both dice and record the combined score each time they roll as a tally chart.
d) Optional: ask them to turn this tally into a bar chart on the graph paper provided.
e) Can they predict what number they would roll next, if they had the chance?
f) Talk about how the graph shows the most likely score (the climate) but also the complete range of possible scores (the weather). What scores are ‘extreme’?
g) What happens to the numbers if the ‘1’ on one of the dice is changed into a ‘7’?

2) Climate change graph

lollipop sticks

Time: 30 minutes

You will need: 120 multicoloured lollipop sticks (at least 10 sticks each of 6 colours), Climate_Change_Picture.pptx, lollipop.xls, blue tack or similar

Note: this probably works best with groups of about 6 students working on each graph, with larger groups more teacher involvement will be required to keep the whole group engaged.
a) Before the event, mark on the middle of each lollipop stick. On each stick, write the year and the temperature for one of the data points in the spreadsheet (e.g. 1970 14.47), differentiating between global and CET data. Use a different coloured lollipop for each decade – so the 60s are all one colour etc.
b) You’ll also need to print a blank graph – the document supplied will work on A3 paper.
c) Divide the students into two groups. Within each group, divide out the lollipop sticks.
d) They should then work together to stick the sticks to the graphs in the right places, using the line in the middle of the stick as the marker.
e) Whilst doing so, they can look at years that mean something to them – the year they were born, their parents were born etc.
f) When they’ve finished, ask them to complete the table on the ppt
g) What does their graph show? What surprises them? What are the similarities and differences between the graphs?
h) Optional: take the sticks back off the graph and, within their groups, line the sticks up in temperature order with the coldest on the left and the warmest on the right. What does this show?

Climate change graph

3) Climate change lucky dip

Time: 30 – 60 minutes

You will need: Lucky dip bag of things that have some link (vague or otherwise) to climate change. Each group takes an object, and then together works out what the connection is. After 10 mins groups swap
objects until all groups have seen all objects. (You could make a simple worksheet with a box for them to write their ideas for each item).
At the end – ask for feedback on each object and give them the “correct answer” – this can take a while – if you have 4 objects, this would make a 60 minute activity. I think they lose interest after 4 objects.

Example objects, depending on what you have available. Try and use objects which have both obvious and higher level ideas associated with them. Try and balance ‘doom and gloom’ with ‘opportunity and hope’ ideas.

Toy car: Emissions of greenhouse gases, also ozone and air pollution. Move talk
onto electric vehicles, nighttime charging etc.

Tree ring slice: Tree rings are an indirect way of measuring our climate etc, trees remove
carbon dioxide from the atmosphere, forestation and deforestation.

Cuddly cow: Methane – but you could also talk about the climate impact of beef etc. as
that is now much more talked about.

Butterfly brooch: Most of the kids talk about different species adapting to climate change (they do evolution in year 6) but you can also refer to chaos and internal links between different parts of the climate system

Mini trainer shoe: Some “air” trainers used to have SF6 in which is a really strong
greenhouse gas. You could also use baby shoes to represent babies and population growth. Also transportation – where were these shoes made?

Mirror: Geo-engineering and space mirrors – but can also explain albedo in this
way.

Solar powered toy: Renewable energy sources

Windmill: Renewable energy sources, changing weather patterns

Bag of rice: Methane production, plants as absorbers of CO2

Cuddly polar bear, puffin or other iconic animal threatened by climate change.

Sponge: Link to bleaching coral reefs and plankton as photosynthesisers equivalent to land plants.

Chocolate bar: Clearing of rainforests for production and threat to cocoa plants as
temperature rises.

Bottle of frozen water: Melting glaciers and ice caps; link to albedo and positive feedback;
hydrogen fuel

Piece of charred wood: Sustainable fuels; increased forest fires.

4) Weather risk game

Time: 30 minutes

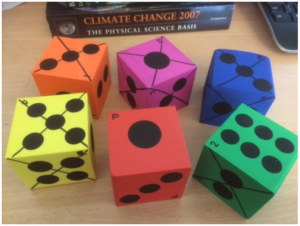
You will need: money.docx printed in colour, WeatherRiskGame.pptx, 6 dice – large ones which the whole class can see work best. I got some foam ones very cheaply.

a) Before the event, mark the dice ‘p’ and 1-5. On the die marked 1, cross out or otherwise mark one side, on the die marked 2 cross out or otherwise mark two sides etc.

foam dice

b) Use the ppt to guide the activity.
c) The students will need to get into 6 groups. Give each group one colour of money and ask them to cut it up. You should keep the ‘insured’ slips.
d) Each time you play, roll the P dice first. On the basis of which side it shows, the students should decide whether to insure their businesses or not (if a 6 is shown, then there is no chance of bad weather and presumably no-one will insure). If they choose to insure, they should pay you the appropriate sum in return for an ‘Insured’ slip. Then, roll the appropriate die (so if the P die gave a 3, next roll the die labelled 3). If a crossed-out side is rolled, then anyone who was not insured should pay you the appropriate sum.
e) Collect in all the insured slips and start again.
f) Continue until either one team, or all teams except one are out, depending on time.

5) Flooding, floating gardens and raft building

Time: 2.5 hours

You will need: Laptop and projector (for PowerPoint)
Whiteboard or flipchart for recording “purchases” by teams and competition results
5 or 6 small ziplock bags containing soil or sand and representing the crops of the garden.
Large and deep plastic box for use as “lake”
Towels
Access to water
Bundles of building materials e.g. plastic straws, lolly sticks, willow sticks, elastic bands, string, corks
Tape dispenser and scissors for each team
Additional materials for teams to “purchase” e.g. small plastic bottles with lids, plastic trays, bubble wrap, bags (anything else you can think of).
Topic: Flooding and climate change, developing world, adaptation.
Skills: teamwork, raft building, communication, budgeting, testing

Based on the Flooding Gardens activity from Practical Action.

Summary:
• Short powerpoint on flooding and impact of climate change. (15 mins)
• Set up problem of agriculture in Bangladesh (5 mins)
• Design and build of floating garden rafts according to specification in the power point (see also
below) – 40 mins including one opportunity for testing design
• Public competition – 20 mins
• Final few slides on real life application – 10 mins
Plus need a bit of time to set up in advance and definitely some to pack / clear up afterwards

Raft building part:
Each team needs to build a raft that could hold a floating garden. The winner is the team that builds a raft that can hold the most weight (small bags of soil) without the top surface of the raft being inundated with water. If using the budgeting version, secondary awards for cheap designs that work (although maybe not quite as well as the expensive ones).

Students are provided with a bag containing e.g. straws, willow sticks, elastic bands, sellotape dispenser, scissors, corks, lolly sticks. These represent “free” and available materials.

Also available are plastic bottles, plastic trays, bubble wrap and anything else you can think of – but these are kept at the front and have a price attached to them. The actual value you give them is arbitrary but they are supposed to represent things that are scarce in the communities we are considering. For example, plastic bottles might represent sealed oil drums, bubble wrap might be tarpaulins etc.

(Note, all materials can and should be recovered at the end of the session – the rafts are broken down and materials reused on other occasions).

With a year 6 group, you should be able to get them to discuss and draw out their design as a team first (maybe first 10 mins of building section), then send one person to get what they need (including paying – I haven’t given them a budget as such, just kept a record of what they have “spent”, but you could give each group a fixed budget if you wanted to (and then judge your winner differently).

6) Greenhouse Effect Bulldog

Time: 30 minutes
You will need: A playground. Chalk or similar. Hats or sashes (see below).
This playground game demonstrates the way Greenhouse gases return energy to the Earth’s surface – as well as allowing the students to run off some energy!
a) With chalk or similar, mark a Sun and an Earth at opposite ends of the school playground. If possible also draw a line across the playground, a third of the way between the Earth and the Sun.
b) Choose 2 students to be greenhouse gases – if possible give them a hat or sash to identify them.

Which greenhouse gases have they heard of? One could be water and the other carbon dioxide.

They are allowed to move only along the line you have drawn. Their role is to try and touch the other students as they run past but only when they are running from the Earth towards the Sun!
c) The other students are all ‘energy’ and start off by the Sun.
d) The ‘energy’ should run to the Earth and back again, repeatedly. If the ‘greenhouse gas’ students manage to touch them, then they have to run 10 times between the greenhouse gas line and the Earth before being allowed to return to the Sun.
e) After a few minutes of doing this, stop the students and increase the numbers of ‘greenhouse gas’ students – you could add a methane, or another water.
f) Again, let them play this for a while, then stop them and ask what has changed. They should notice that there is now more ‘energy’ trapped near the Earth.
g) You could increase the amount of greenhouse gas again and let them see what happens.
h) Finish by talking about how greenhouse gases are essential to maintaining our climate, but that increasing the amount of greenhouse gas leads to heating. You may need to talk a little bit about the different forms energy can take – light, heat etc.

greenhouse bulldog