

Precipitation has been recorded in the British Isles for over 200 years. Through the dedication and enthusiasm of W R Symons, the mid-19th century saw the formation of the British Rainfall Organisation whose main objective was to establish a countrywide network of rain gauges where daily measurements were made. This network has grown to over 7,000 gauges today, including many that are automatic.
As most people in the British Isles know, precipitation can be extremely variable, both in intensity and duration. The spatial distribution of precipitation during an individual month is very uneven, just as it is on an individual day. Rainfall in Britain is associated with several distinct synoptic situations; all places may get rain from most such types, but some areas get more from some types than others. Therefore, it is not surprising that patterns of temporal variation of rainfall are complex.
Precipitation over the British Isles is the result of one or more, of three basic mechanisms.
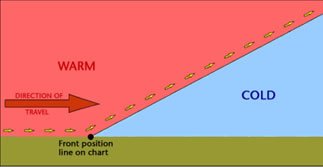
1. Cyclonic, or frontal, rain associated with the passage of low-pressure systems. Bands of rain are associated with the passage of warm and cold fronts across the UK. These rain events are caused by the uplift and cooling of moist air parcels.
2. Convectional, with local showers and thunderstorms, caused by the localised thermal heating and overheating of the ground surface. Large towering cumulonimbus clouds may be generated, producing heavy rain.
3. Orographic, or relief rain, with precipitation increasing with altitude over upland areas. The mechanism for relief rain is the uplift and cooling of moist air over upland areas. The normal rate of cooling (environmental lapse rate) is 6.5 °C per 1,000 metres. Therefore, near the summit on the windward side of the hill or mountain, the air will have cooled sufficiently for thick cloud, rain and possibly snow to fall.
Air will descend and warm on the leeward side, so there is little or no rain on this leeward side of the hill or mountain. This is called a rain shadow, and sometimes there are warm winds in these sheltered areas as the air, now much drier than during its ascent, descends quickly and warms up. This is called a föhn effect, and the warm winds are called föhn winds.
Rain forms when air cools, the rate of condensation becomes faster than the rate at which water is evaporating and cloud droplets form. If these get big enough, they form as rain – or snow, sleet or hail.
There are various ways in which the air can cool to form rain – three common types which are often talked about are frontal, orographic or relief and convective rain. Frontal Rain
This is found where warm air meets cold at the cold and warm fronts in a depression.
Convective Rain
Convection is the term given to warm air rising. Convection is normally marked by cumulus clouds which billow upwards as the air rises. The base of such clouds is usually flat, marking the level where temperatures are cold enough for more condensation to be going on than evaporation.
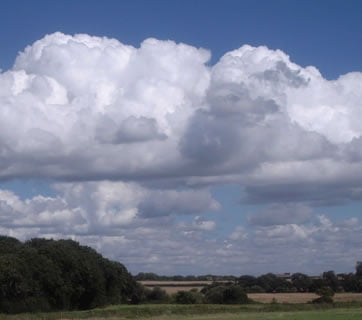
Image copyright RMetS
Extreme convection can be found in thunder clouds – towering cumulonimbus, which can reach all the way up to the top of the troposphere – the lowest 10km or so of the atmosphere in which our weather is found. As air can’t rise into the stratosphere above, the top of the cumulonimbus cloud spreads out, giving it a characteristic ‘anvil’ shaped top. Such convection can occur where the ground has become particularly warm, heating the air above it. It is particularly associated with the Tropics, characteristically giving heavy rain in the late afternoon.
Cumulonimbus clouds can give heavy rain, hail, thunder lightning and sometimes tornadoes.

Cumulonimbus cloud over Kettering, UK, August 2014
Image copyright Sylvia Knight
Orographic or Relief Rain
When air is forced to rise over land, particularly higher ground such as hills and mountains, it cools as the pressure falls. Dry air cools at 9.8°C per 1000m it rises. Eventually, the air can cool enough for cloud to form.

Orographic cloud forming upstream of the Matterhorn
Image copyright RMetS
The cloud droplets may get big enough to fall as rain on the upstream side of the mountain. If that happens, then, when the air has passed over the top of the mountain and starts to descend, and warm, on the far side, there will be less water to evaporate back into the air. The air will end up drier than it was on the upstream side of the mountain.
This can produce ‘rain shadow’ – an area of land downstream from some mountains (for the prevailing wind direction, in the UK, this would be to the east) where there is noticeably less rainfall. The Gobi desert in Mongolia and China is so dry because it is in the rain shadow of the Himalayas.
Orography can enhance frontal or convective rain; for example, we have explored how polar maritime air, our prevailing air mass, brings convective rain to the Atlantic. As the air reaches the UK and rises over the land, the precipitation is increased.
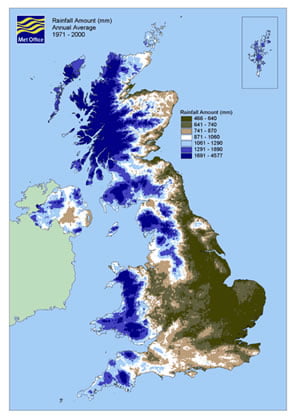
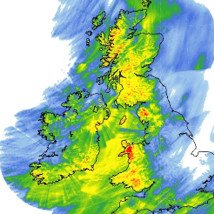
A precipitation map showing the rainfall ‘climate’ (averaged over 30 years) of the UK. With prevailing westerly winds, there is clearly more rain on the western side of the country, enhanced by the mountains of Wales and Scotland and the English Pennines.
As well as being drier on the downwind side of the mountains, it can also be warmer. Remember that water releases heat into the atmosphere as it condenses and takes it up as it evaporates. If there is less water in the air on the downwind side, then there is less to evaporate and not all the heat that was released on the upwind side will be taken up again. This is known as the Föhn Effect.
The onset of a Föhn is generally sudden. For example, the temperature may rise more than 10°C in five minutes and the wind strength increase from almost calm to gale force just as quickly. Föhn winds occur quite often in the Alps (where the name originated) and in the Rockies (where the name chinook is used). They also occur in the Moray Firth and over eastern parts of New Zealand’s South Island. In addition, they occur over eastern Sri Lanka during the south-west monsoon.
Where there are steep snow-covered slopes, a Föhn may cause avalanches from the sudden warming and blustery conditions. In Föhn conditions, the relative humidity may fall to less than 30%, causing vegetation and wooden buildings to dry out. This is a long-standing problem in Switzerland, where so many fires have occurred during Föhn conditions that fire-watching is obligatory when a Föhn is blowing.
Teaching Resources
A case study of orographic rainfall and Foehn winds in Scotland with images for students Image 1, Image 2, Image 3, Image 4, Image 5.
Water in the Atmosphere from Weather and Climate: a Teachers’ Guide
Data and Image Sources
This case study or ‘mystery’ is taken from the afternoon of the 2nd September 2013. It focusses on Scotland and N. England. It can be used for two different purposes – either to identify orographic/ relief rain (use images 2-6 below), or to go on to identify a case study of the Foehn Effect (use all images).
We recommend that teachers present students in groups with a series of images, sequentially, to allow them to work out what the weather is doing and why.
Students should be
Make a cloud in a bottle or watch the video.
Students can be helped, where appropriate to identify some of these points
Image 1 – temperatures in degrees Centigrade at 15Z (1500GMT) (copyright Met Office)
The temperatures show that it is considerably warmer on the East side of Scotland than on the West. Temperatures are up to 9°C warmer on the East.
Why?
Image 2 – a synoptic chart at 12Z (1200GMT) (copyright Met Office)
Image 3 – wind speed in knots at 15Z (1500GMT) (copyright Met Office)
Image 4 – satellite image at 15Z (1500GMT) : (c) EUMETSAT / Met Office
This is a satellite image from 1500Z (1500GMT) showing visible radiation ie light. The white areas are where the Sun’s light is being reflected from clouds.
There is cloud over the west coast of Scotland and N. England
You can also see the cloud associated with the warm front to the East of the UK, and the cold front to the west.
Image 5: Rainfall on 2nd September 2013 (copyright Met Office)
It is raining over the west coast of Scotland. Why?
A relief map of Scotland clearly shows the high ground on the East coast.
As the easterly winds blow in from the west, the air is forced to rise. As it rises, it cools until the rate of condensation is faster than the rate of evaporation. Cloud droplets form, which eventually become large enough to fall as rain.
Therefore, this rain is orographic or relief rain.
As the air descends again downwind of the mountains, the air warms and the cloud droplets evaporate.
As the cloud droplets form, they emit latent energy (heat) into the air around. This heat is remains in the air if the rain reaches the ground. This means that, downwind of the mountains when the air sinks, warms, and any remaining cloud droplets evaporate, there is more heat in the air than there was upwind of the mountains.
This is why temperatures were so much warmer on the east coast than on the west on this day!
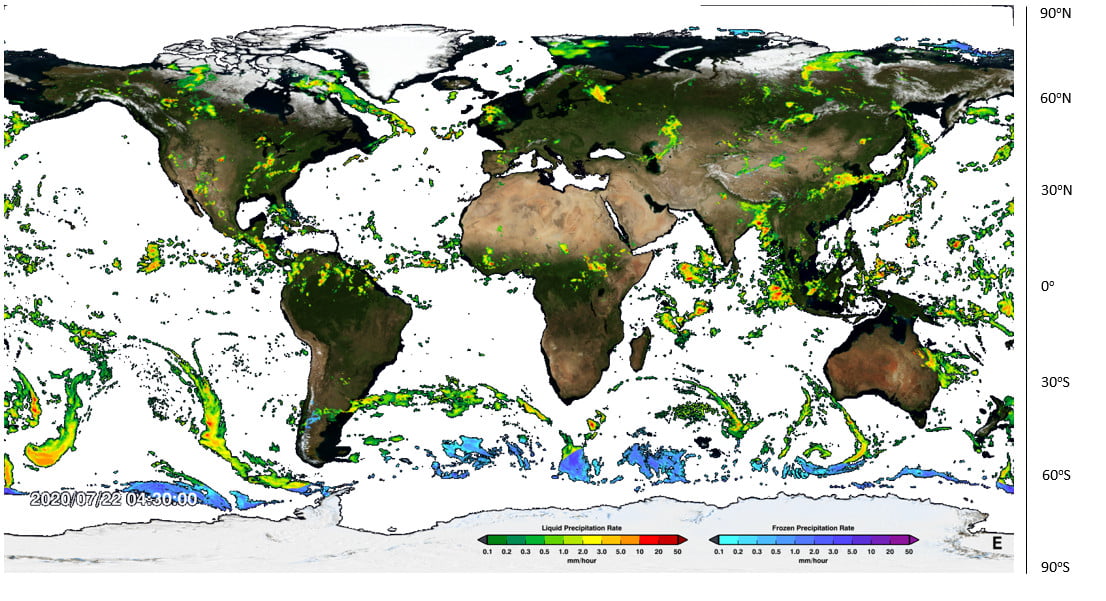

3. What is the type of land is below these rainfall patterns? (Green is forest, brown is desert).
4. In what latitude bands are these rainfall patterns?
Use these terms to fill in the blanks below for Questions 5-8: Hadley, cloud, humid, Sun, cloud, rainfall, low, ground, Ferrel, fronts, Equator, Hadley, poles, rainfall.
5. Rainfall occurs when ______ air cools down. Air cools when it rises, or when it moves away from the _______.
6. The Atmospheric Circulation is driven by the _____. In the Tropics, the Sun warms the _____ which in turn warms the air above. hot air rises, leading to _____ and _______. This drives the ________ cells.
7. Colder air sinks at the poleward edge of the _______ cells and over the __________. Sinking air has no _______ or __________.
8. In the _______ Cells, rainfall is mainly associated with ____ pressure systems (depressions). Rainfall is mainly on the ________.
9. Complete the following table (Look at the map for help):
Tropics | Sub Tropics | Poles | |
Skies | Clear/ Cloudy | Clear/ Cloudy | Clear/ Cloudy |
Rain (or snow)-fall | Dry/ Wet | Dry/ Wet | Dry/ Wet |
Pressure | High/ Low | High/ Low | High/ Low |
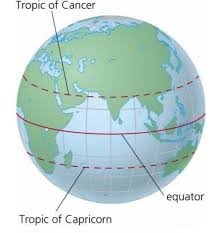
10. Sketch what you think the Hadley Cell looks like in December and June by the images of the Earth below. Hint: the Equator and Tropics of Cancer and Capricorn are shown on the map.
Visit https://earth.nullschool.net/#current/wind/surface/level/overlay=precip_3hr/orthographic to see today’s rainfall patterns. Click on ‘Earth’ and then choose in the Overlay settings ‘3HPA’ to see the rainfall patterns together with surface wind speeds. Change in the settings the ‘Control’ to change the date and see rainfall patterns over time. Compare January and July rainfall patterns.
11. In the Tropics, how does the latitude of highest rainfall change between January and July? ___________________________________
12. How does this relate to the sketches you drew above? ___________________________________________________________________________________________________________________________________________________________________________________________________________________________________________________
Extension question: Why do you think you are asked to look at rainfall in January and July, rather than December and June? ___________________________________________________________________________________________________________________________________________________________________________________________________________________________________________________
Pathway: Basic weather
Climate Zones – Air Masses – Pressure and Wind – Water in the Atmosphere
Lesson overview: In this lesson, we focus on cloud formation due to convection, orography (relief) and frontal uplift.
The atmosphere is one of the smallest reservoirs of water in the hydrosphere. Clouds form when air is cooled. Air can cool due to convection, when air is heated from below and rises, or when air is forced to rise at a front between two air masses. When air is forced to rise over hills and mountains, cloud formation is enhanced. Climate change will intensify the water cycle, increasing the amount of water vapour in the atmosphere. As water vapour is a greenhouse gas this creates a positive feedback loop, amplifying climate change.
Learning objectives:
To understand why clouds form in the atmosphere.
To be able to explain two ways in which clouds form
Key Teaching Resources
Water in the Atmosphere PowerPoint
Water in the Atmosphere PowerPoint (easier)
Water in the Atmosphere Worksheet
Water in the Atmosphere Worksheet (easier)
Back-to-back image
Teacher CPD/ Extended Reading
Read
Water in the Atmosphere – More for Teachers
Or watch
Alternative or Extension Resources
Global Atmospheric Circulation and Global Precipitation Patterns
A ‘mystery’ – a case study of orographic rainfall in Scotland (with optional extension looking at the Foehn Effect)
Resources required
Computers with Internet access would be desirable. Alternatively if Internet access is not available, printed copies of student sheets and worksheets should be made.
Prior knowledge required
A basic background of weather and climate.
Students can visit the following pages to gain a basic background into the topics covered:
The information on the student sheets can be delivered by the teacher and activities completed individually. Alternatively students can work through the whole lesson themselves.
Part A – Isobars, pressure and wind
Part B – Identifying pressure systems and fronts
Part C – Plotted weather charts
Three worksheets with exercises are provided to consolidate learning.
A series of additional exercises are provided for more able students, or those who have already studied pressure systems and fronts in more detail prior to this lesson.
Any of the worksheet activities can be completed. Alternatively students can collect weather charts from the Internet or a newspaper and repeat the exercises using these.
Web page reproduced with the kind permission of the Met Office
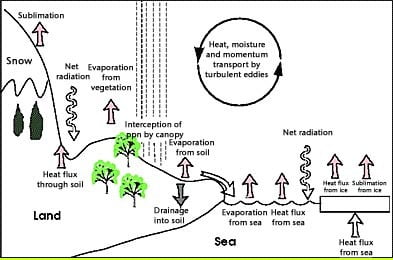
The water cycle, also known as the hydrological cycle, is the process by which water travels from the Earth’s surface to the atmosphere and then back to the ground again. The sun provides the energy for a continuous exchange of moisture between the oceans, the land and the atmosphere.
Nearly all (about 97%) of the Earth’s water is contained in the oceans. A smaller amount is locked away as ice sheets and glaciers. This leaves a very small amount which travels around in our water cycle, although it may not always seem this way on wet days.
Water enters the atmosphere as water vapour through evaporation, transpiration and sublimation. Water vapour high in the atmosphere forms into clouds through condensation. Water eventually returns to earth through precipitation as rain, snow, sleet and hail. When precipitation occurs over land, some water seeps into the ground as groundwater, a small amount is taken up by plants and animals, and the rest will return to rivers and streams as surface run-off to begin its journey back to the oceans.

Surface runoff
Surface runoff is the precipitation that falls on land and flows downhill towards stream channels which join rivers and eventually reach the oceans. Only about one third of precipitation falling on land will return to rivers and oceans. The rest will be soaked into the soil as groundwater, evaporated or transpired.
Groundwater
Some of the water from precipitation will soak into the soil and rocks as groundwater. A varying proportion of groundwater stays in the shallow soil layer, and will move slowly towards streams and rivers. When groundwater soaks deeper into the soil it refills the underground aquifers, where it can stay for long periods of time or be used by humans through drilling wells into aquifers.
Aquifer
An aquifer is a layer of water soaked sand, soil, stone, silt or clay underground. Aquifers act as huge underground water storage systems which people all over the world rely on for fresh water.
Reversible change of state
A change that can be undone or reversed. Energy is required for a material to change state and whilst it may change in appearance, it will still remain the same material. Melting, freezing, boiling, evaporating and condensing are always reversible changes and can be reversed by heating or cooling.


Web page reproduced with the kind permission of the Met Office

Questions to consider:
Explain two reasons why a warming climate results in a more intense water cycle.
How do changes in the water cycle impact i) the surface water of oceans in the subtropics ii) the surface water of oceans in tropical and polar regions.
Describe the potential global change in annual mean precipitation for the period 2081 -2100.
Identify three key differences between the carbon cycle and the water cycle.
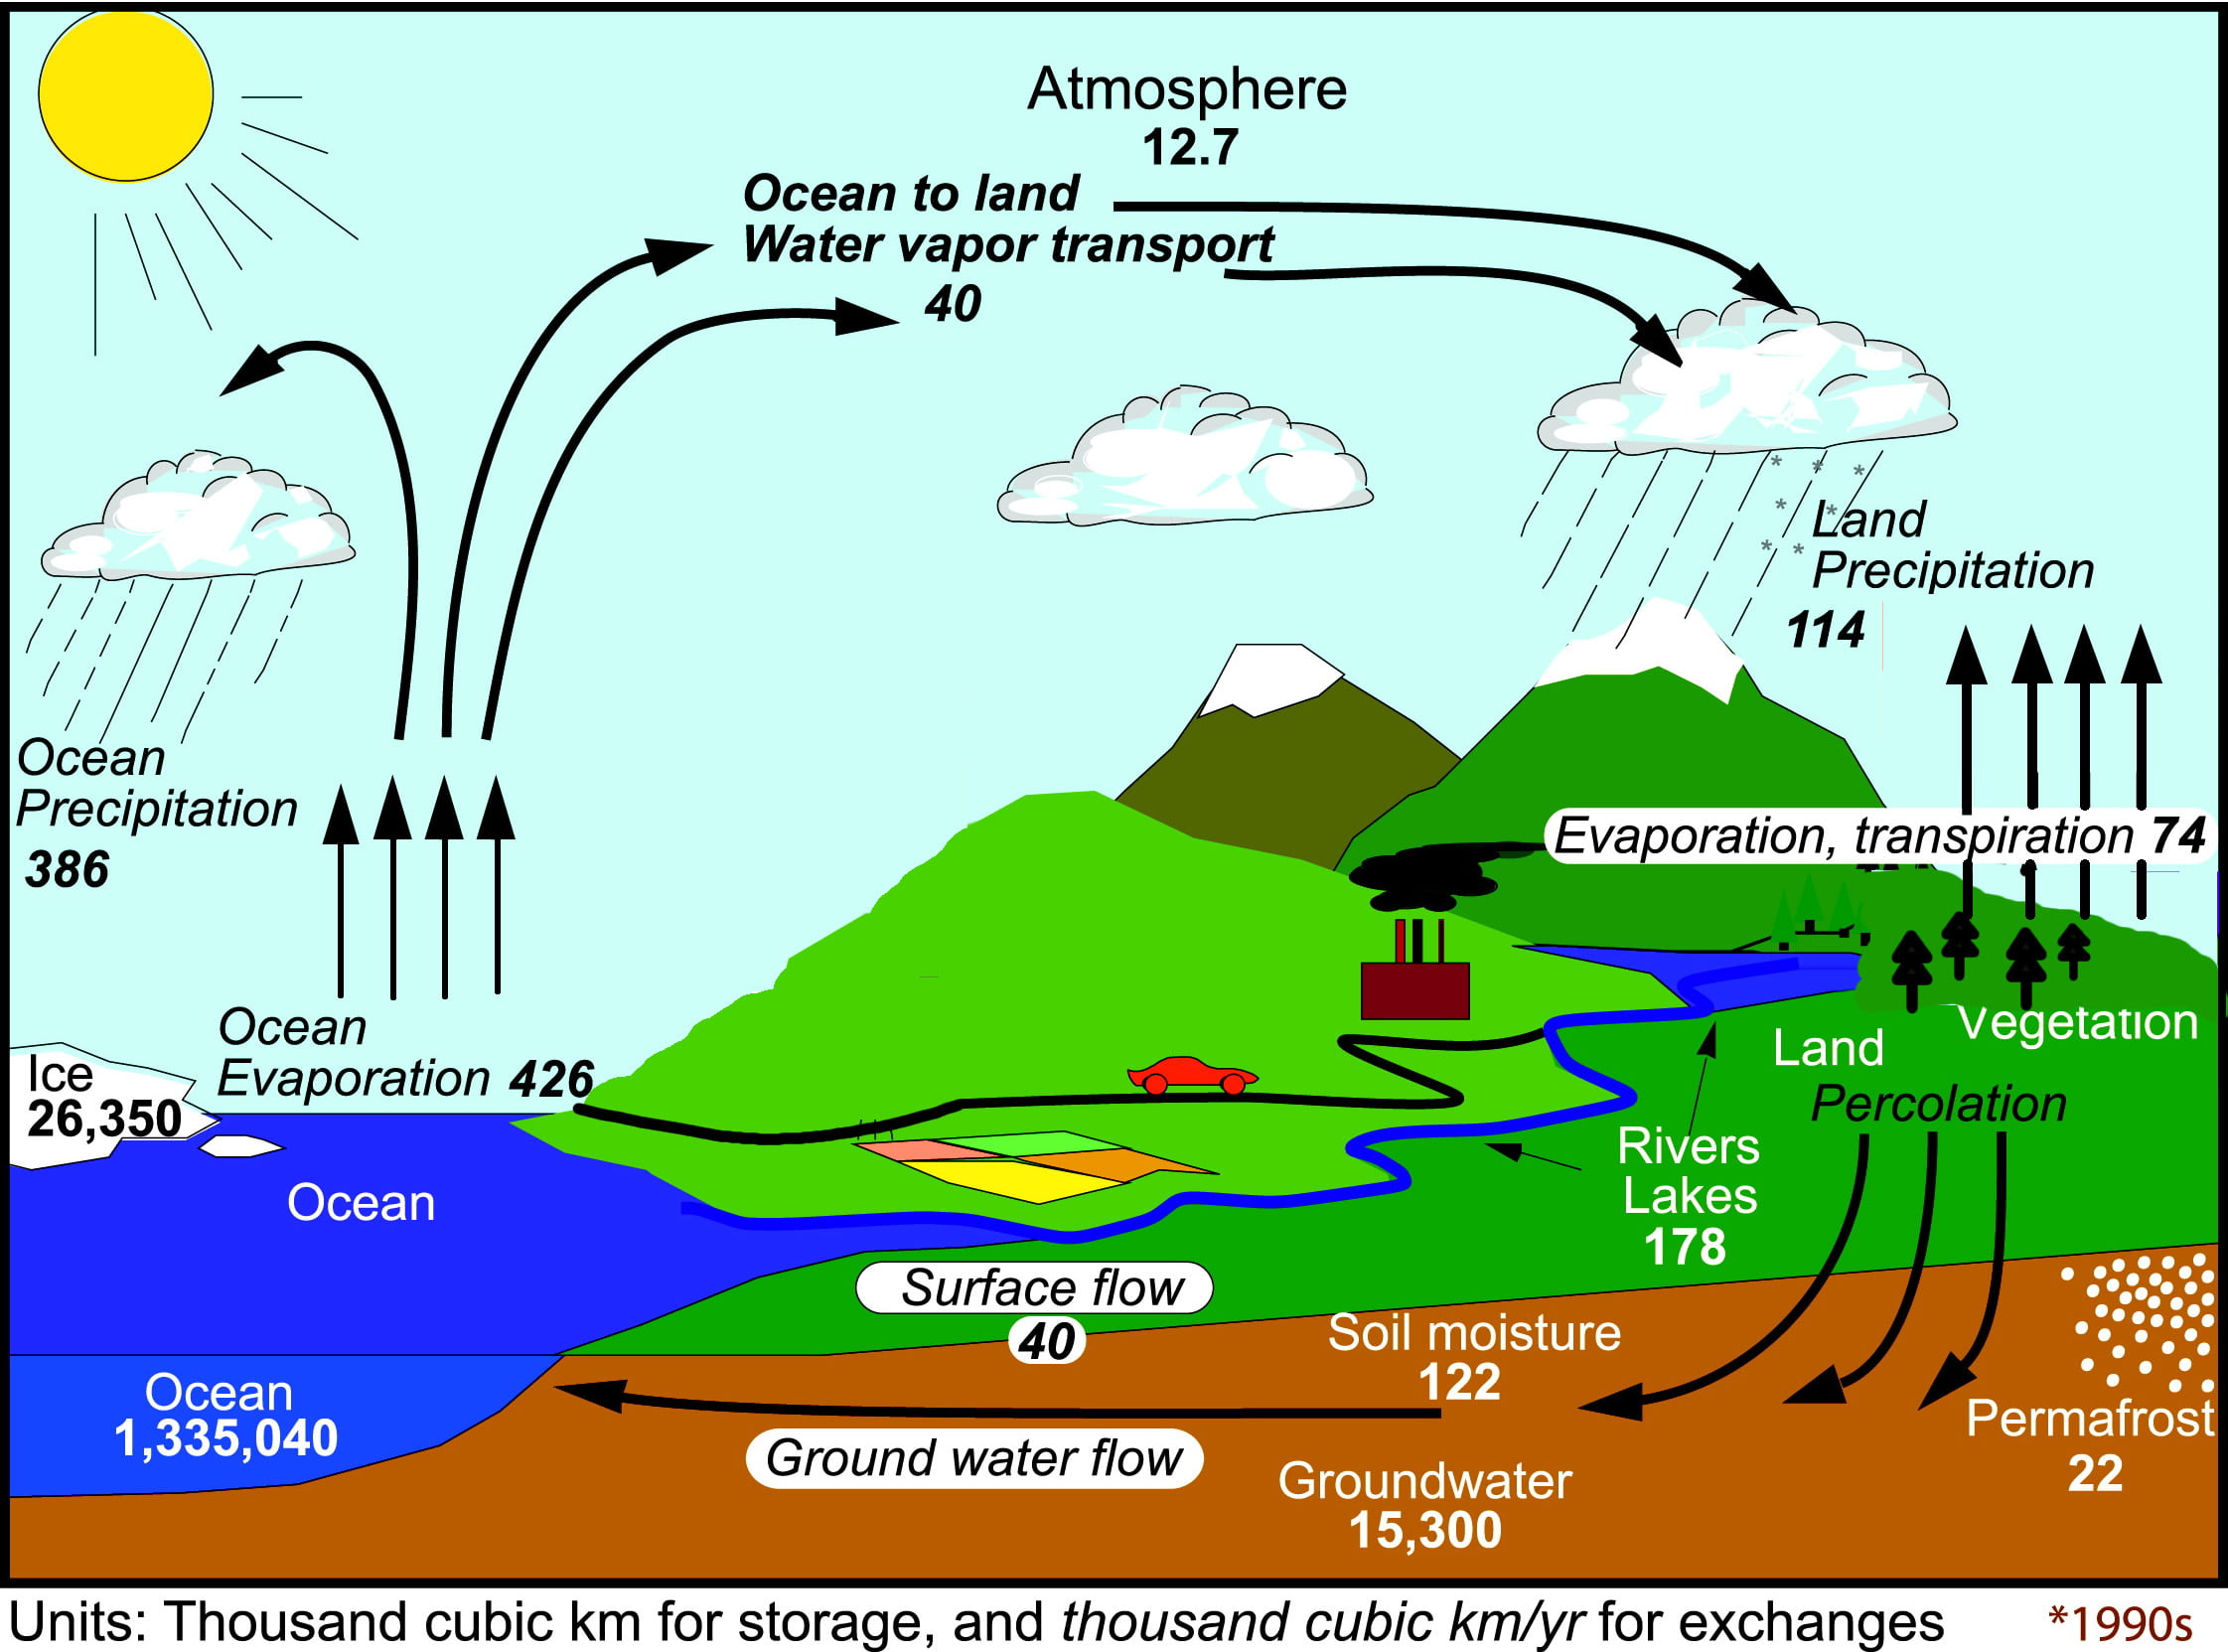 Estimates of the current global water budget and its annual flow using observations from 2002-2008 (1000 km3 for storage and 1000 km3 yr−1 for exchanges).
Based on K.E. Trenberth, J. Fasullo, and J Mackaro, 2011: Atmospheric Moisture Transports from Ocean to Land and Global Energy Flows in Reanalyses. J. Climate, 24, 4907–4924. doi: http://dx.doi.org/10.1175/2011JCLI4171.1
Changes to Groundwater in Uganda
The mass budgets of Himalayan Glaciers
Carbon, water, weather and climate a PowerPoint presentation focussing on recent changes to the carbon and water cycles, and how the two cycles interact.
Background information on the water cycle.
Is There Evidence for Changes in the Earth’s Water Cycle?
How Important Is Water Vapour to Climate Change?
How Will the Earth’s Water Cycle Change?
How will climate change affect the frequency and severity of floods and droughts?
How will the availability of water resources be affected by climate change?
How is climate change affecting monsoons?
In general, precipitation is limited by the availability of water, energy, or both. The world’s oceans contain an effectively unlimited supply of water but locally, especially over land, a shortage of water can limit precipitation. As the climate warms, and there is more energy available to drive evaporation, the amount and intensity of precipitation is expected to increase. Evapotranspiration also increases over most land areas in a warmer climate, thereby accelerating the water cycle. However, changes in vegetation and soil moisture availability can also affect evapotranspiration rates.
The differences between the carbon and water cycles:
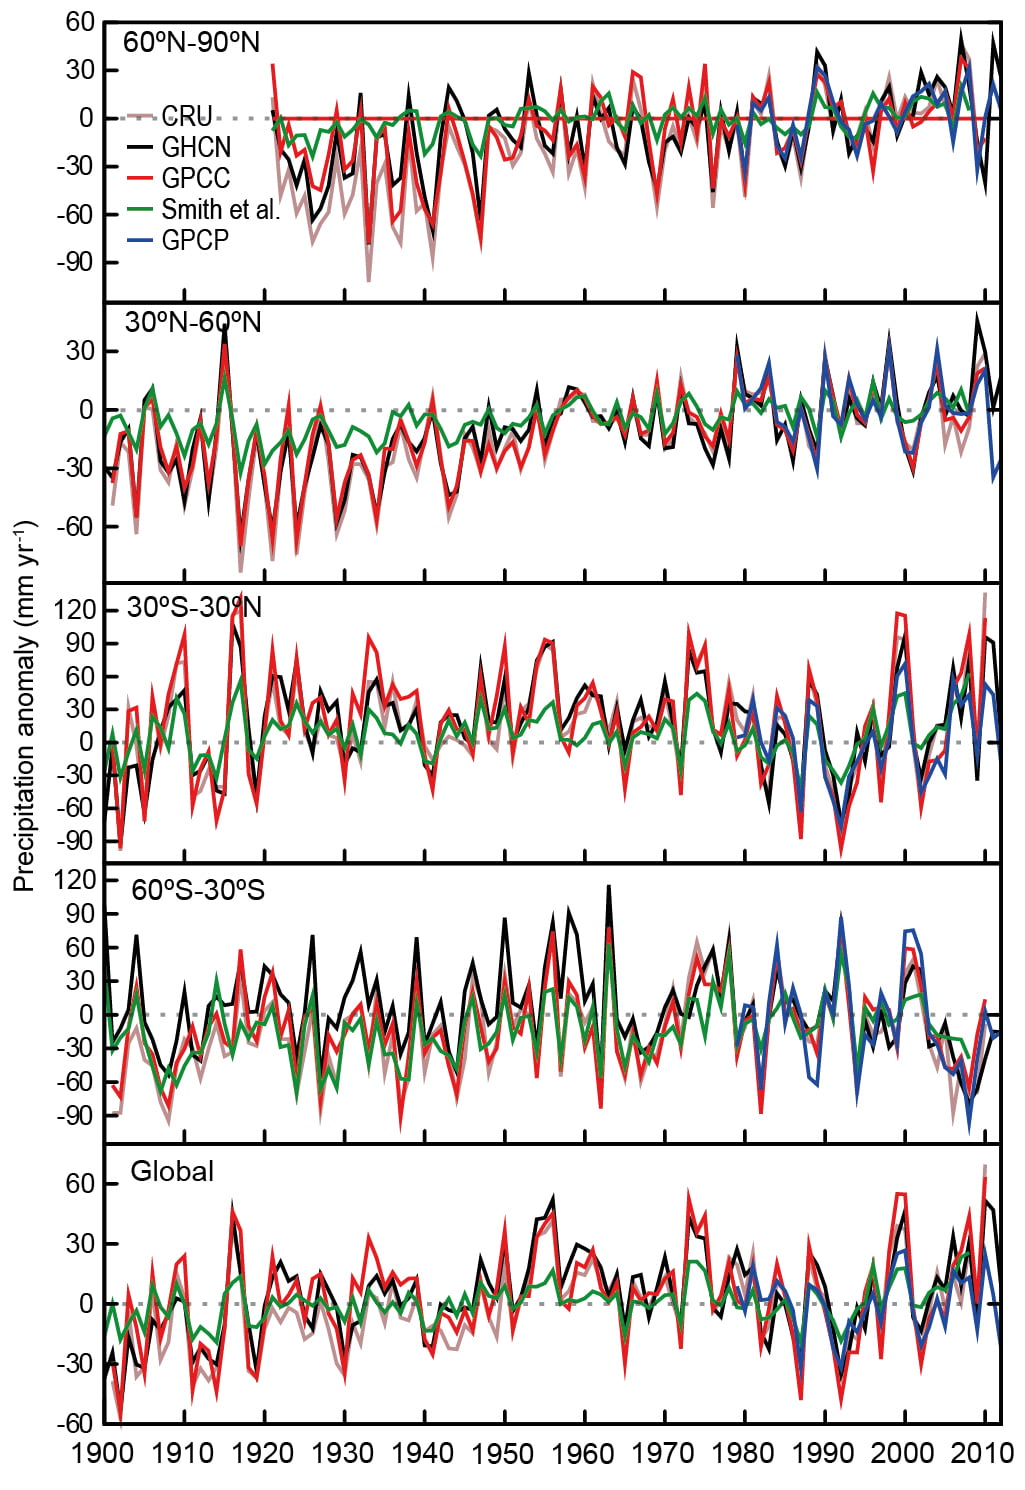
Annual precipitation anomalies averaged over land areas for four latitudinal bands and the globe relative to 1981-2000. Globally, there has been no significant long term trend in precipitation. In the Tropics, (30°S-30°N) precipitation has increased over the last decade, reversing the drying trend from the mid 70s to the mid 90s. The Northern Hemisphere mid-latitudes show a significant increase in precipitation over the last century.
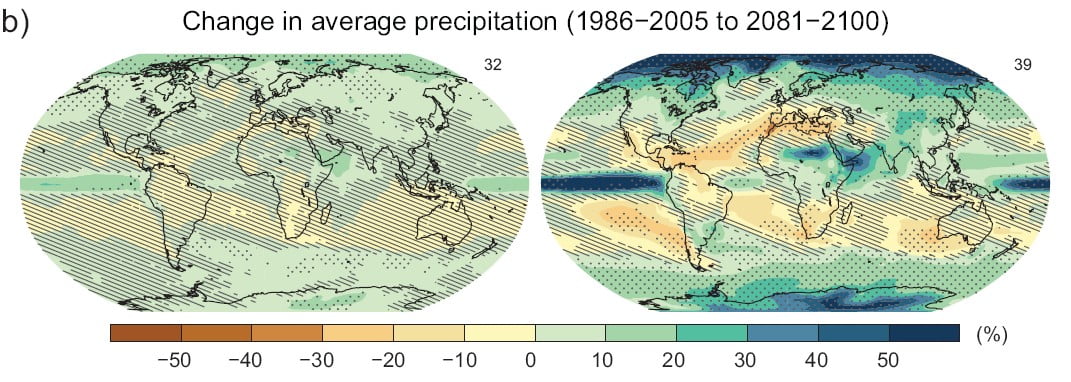
Maps of modelled annual mean precipitation changes between 1986-2005 and 2081-2100 for a low (RCP2.6) and high (RCP8.5) emissions scenarios. Hatching indicates regions where there is low confidence in the projected change. Stippling indicates regions where there is more confidence in the projected precipitation change.
Global and annual averages of total atmospheric water vapour over ocean surfaces, shown relative to the average for the period 1988-2007.
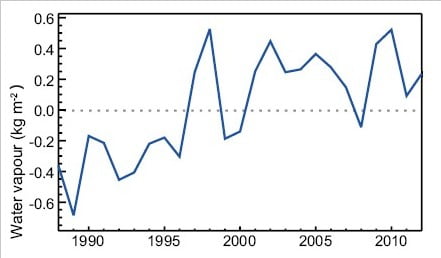
Evidence of climate change is also seen in other variables. Since the last IPCC report, satellite evidence has shown an increase in the amount of water vapour in the troposphere, the lowest part of the atmosphere. The year-to-year variability and long term trend in atmospheric water vapour content are closely linked to changes in global sea surface temperature, partly because warmer temperatures cause increased evaporation and partly because warmer air can carry more water vapour. Tropospheric water vapour is an important climate change feedback mechanism (through its powerful greenhouse effect) and is essential to the formation of clouds and precipitation. No significant change to the amount or type of clouds globally has been detected yet, although locally changes have been observed and linked to changing wind patterns.
Changes in the water cycle also have an impact on the world’s oceans, with surface waters in the evaporation dominated sub-tropics becoming more saline and surface waters in the rainfall-dominated tropical and polar regions becoming fresher.
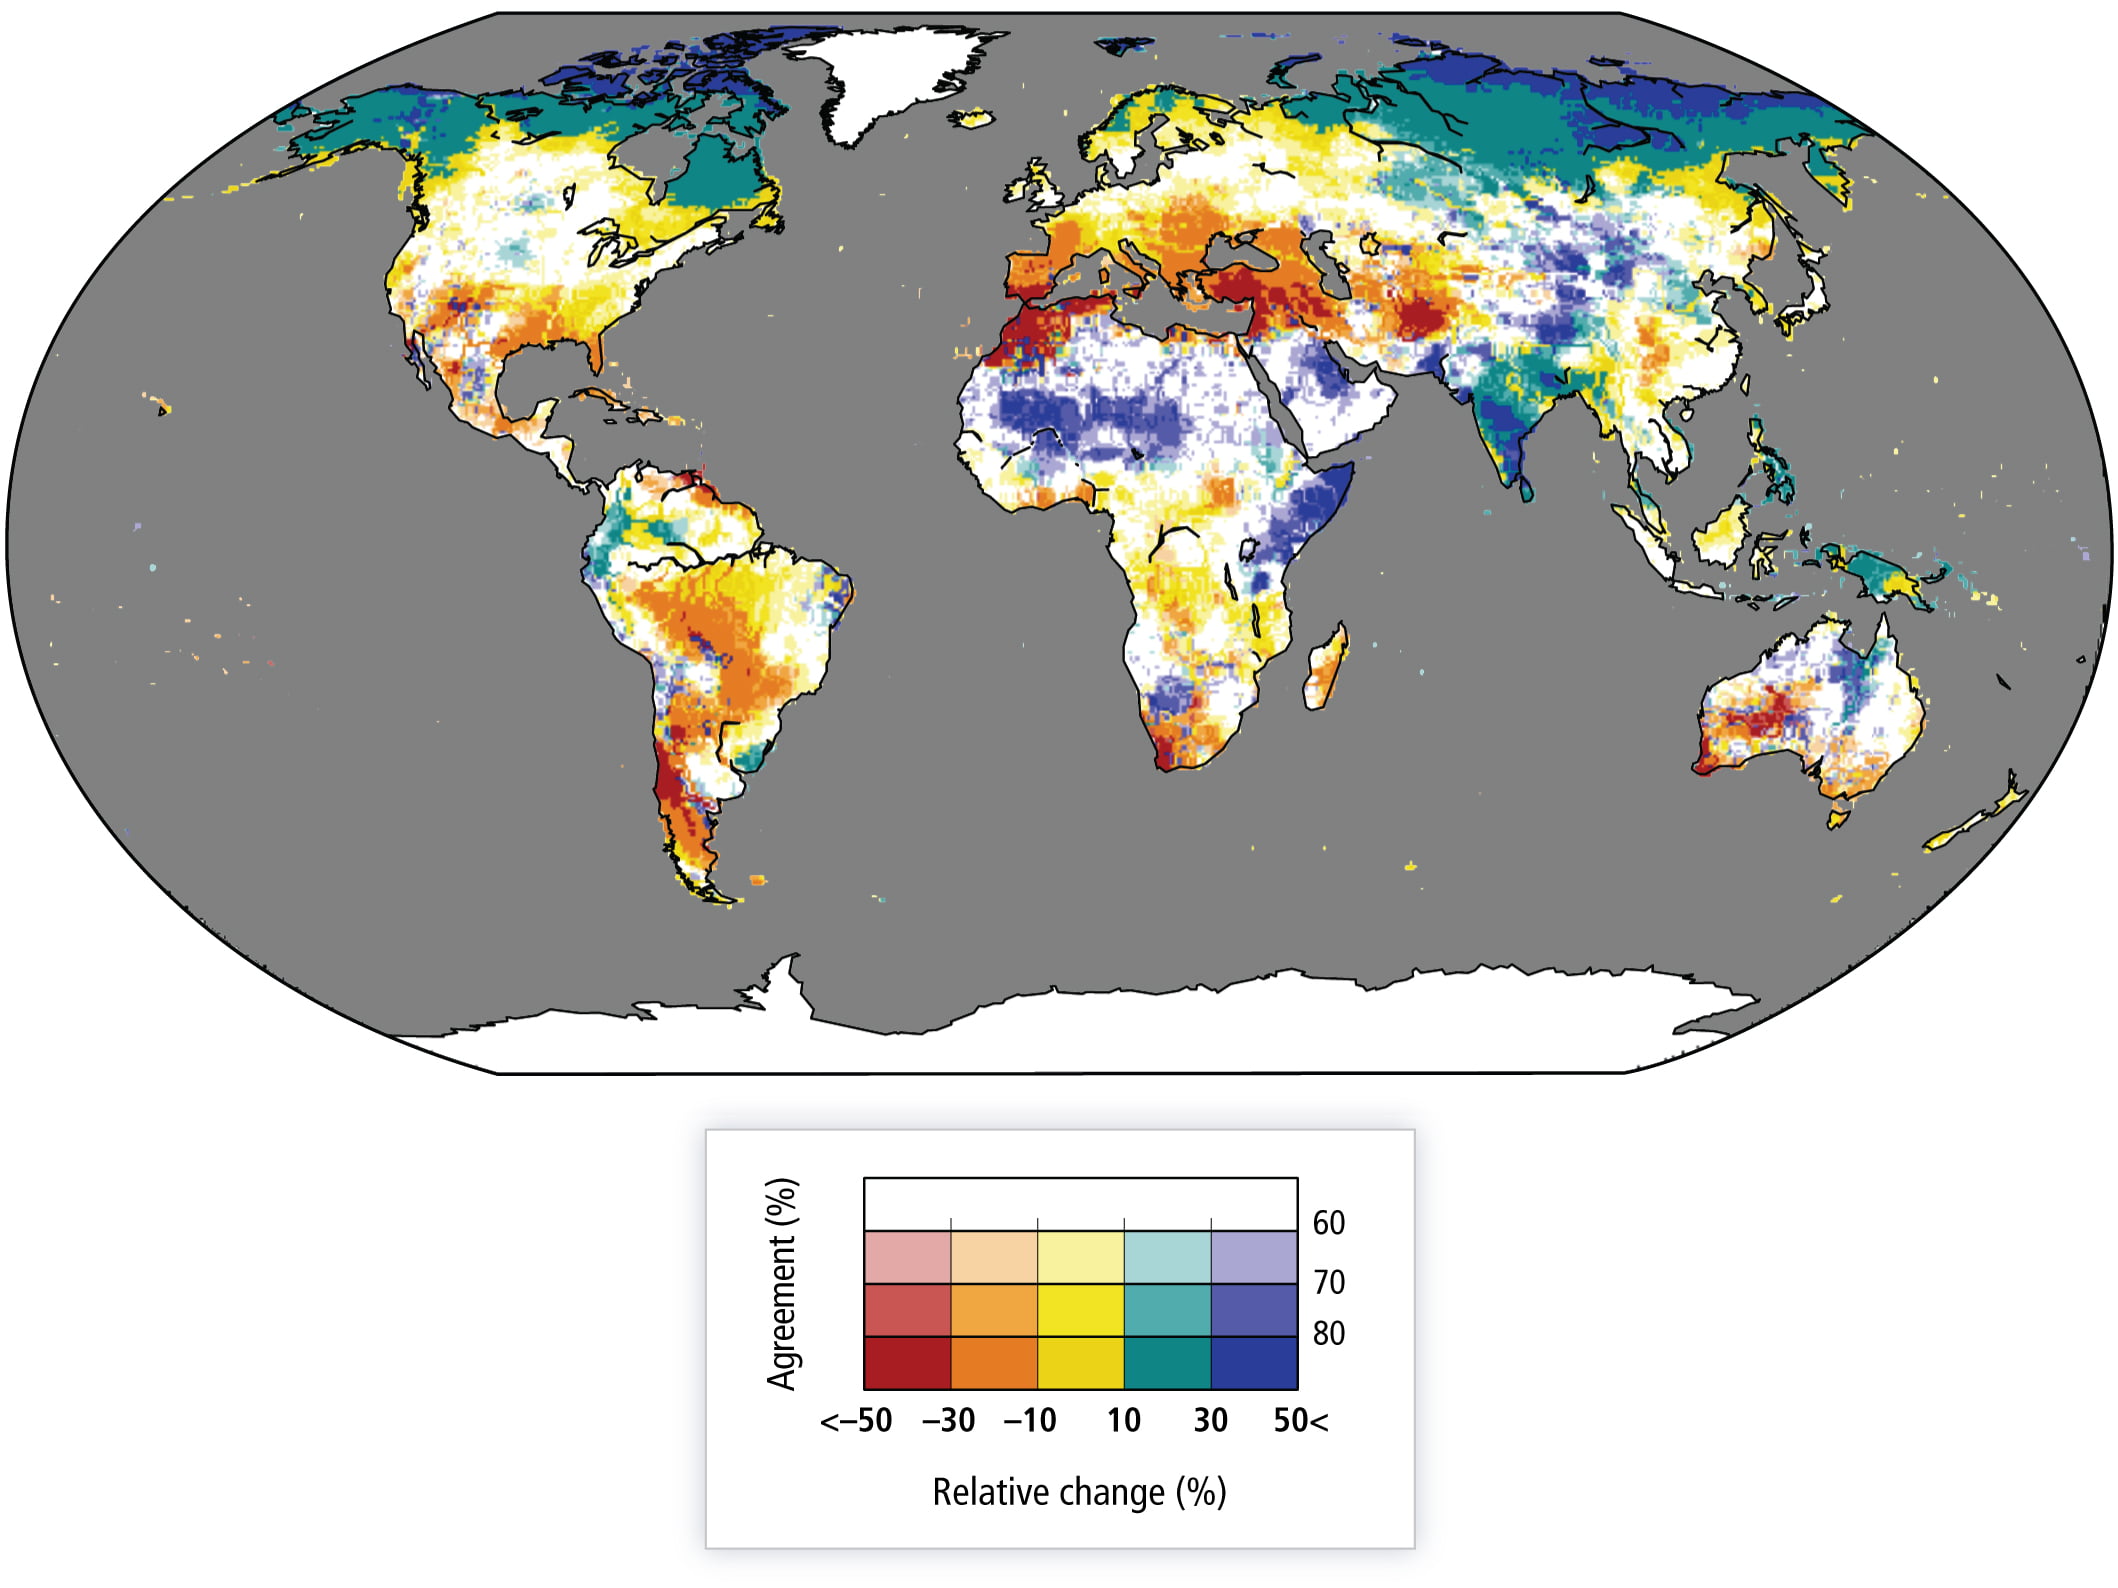
Percentage change of mean annual streamflow for a global mean temperature rise of 2°C above 1980–2010 (2.7°C above pre-industrial). Colour hues show the amount of change and saturation shows the agreement on the sign of change (i.e. the darker the colour, the more confidence in the result).
Extreme Precipitation and Flooding
Since 1951 there have been statistically significant increases in the number of heavy precipitation events in more regions than there have been decreases, but there are many regional and seasonal variations in the trend. The most consistent trend is seen in North America, where there has been an increase in the frequency and intensity of extreme precipitation. In the future, the number of tropical cyclones globally may fall but their maximum wind speed and precipitation is expected to increase, in a warmer and more energetic atmosphere. Freshwater-related risks (e.g. river flooding) of climate change increase significantly with increasing greenhouse gas concentrations.
Drought Increased evapotranspiration over land can lead to more intense and frequent periods of agricultural drought. There has been an increase in the frequency and intensity of drought in the Mediterranean and West Africa, but a decrease in central North America and north-west Australia.
ENSO
We cannot yet predict how the El Niño Southern Oscillation (ENSO), which has a significant impact on precipitation patterns around the world in both its El Niño and La Niño phases, may change in the 21st century.
The Cryosphere Frozen stores of water form an important component of the water cycle and are depended upon by societies and ecosystems. The Arctic and Antarctic sea-ice covers are projected to shrink in the 21st century. The Arctic may become almost entirely ice-free in late summer. Polar amplification occurs if the magnitude of the surface temperature change at high latitudes exceeds the globally averaged temperature change on time scales greater than the annual cycle. One of the ways this can happen is in response to rising CO2 levels in the atmosphere. As the air temperature warms, sea ice retreats and snow cover reduced, the surface albedo decreases, air temperatures increase and the ocean can absorb more heat – a positive feedback mechanism which result in a local amplification of the warming.
This polar amplification can have consequences for the melting of ice sheets, global sea level and on the carbon cycle through the melting of the permafrost.
Ice sheets also play an essential role in the Earth’s climate. They interact with the atmosphere, the ocean–sea ice system, the lithosphere and the surrounding vegetation, respond to greenhouse gas changes and affect global climate on a variety of time scales. Ice sheets grow when annual snow accumulation exceeds melting. Growing ice sheets expand on previously darker vegetated areas, thus leading to an increase of surface albedo, further cooling and a local drying of the air as the ice sheets grow upwards into colder air. Massive freshwater release from retreating ice sheets, can feed back to the climate system by altering sea level, oceanic deep convection, ocean circulation, heat transport, sea ice and the global atmospheric circulation. Whereas the initial response of ice sheets to external forcings (such as greenhouse gas changes) can be quite fast, involving for instance ice shelf processes and outlet glaciers (10 to 1000 years), their long-term adjustment can take much longer.
Is There Evidence for Changes in the Earth’s Water Cycle?
WG1 FAQ3.2
The Earth’s water cycle involves evaporation and precipitation of moisture at the Earth’s surface. Changes in the atmosphere’s water vapour content provide strong evidence that the water cycle is already responding to a warming climate. Further evidence comes from changes in the distribution of ocean salinity, which, due to a lack of long-term observations of rain and evaporation over the global oceans, has become an important proxy rain gauge.
The water cycle is expected to intensify in a warmer climate, because warmer air can be moister: the atmosphere can hold about 7% more water vapour for each degree Celsius of warming. Observations since the 1970s show increases in surface and lower atmospheric water vapour (Figure 1a), at a rate consistent with observed warming. Moreover, evaporation and precipitation are projected to intensify in a warmer climate.
Recorded changes in ocean salinity in the last 50 years support that projection. Seawater contains both salt and fresh water, and its salinity is a function of the weight of dissolved salts it contains. Because the total amount of salt—which comes from the weathering of rocks—does not change over human time scales, seawater’s salinity can only be altered—over days or centuries—by the addition or removal of fresh water.
The atmosphere connects the ocean’s regions of net fresh water loss to those of fresh water gain by moving evaporated water vapour from one place to another. The distribution of salinity at the ocean surface largely reflects the spatial pattern of evaporation minus precipitation, runoff from land, and sea ice processes. There is some shifting of the patterns relative to each other, because of the ocean’s currents.
Subtropical waters are highly saline, because evaporation exceeds rainfall, whereas seawater at high latitudes and in the tropics—where more rain falls than evaporates—is less so (Figure 1b, d). The Atlantic, the saltiest ocean basin, loses more freshwater through evaporation than it gains from precipitation, while the Pacific is nearly neutral (i.e., precipitation gain nearly balances evaporation loss), and the Southern Ocean (region around Antarctica) is dominated by precipitation.
Changes in surface salinity and in the upper ocean have reinforced the mean salinity pattern. The evaporation-dominated subtropical regions have become saltier, while the precipitation-dominated subpolar and tropical regions have become fresher. When changes over the top 500m are considered, the evaporation-dominated Atlantic has become saltier, while the nearly neutral Pacific and precipitation-dominated Southern Ocean have become fresher (Figure 1c).
Observing changes in precipitation and evaporation directly and globally is difficult, because most of the exchange of fresh water between the atmosphere and the surface happens over the 70% of the Earth’s surface covered by ocean. Long-term precipitation records are available only from over the land, and there are no long-term measurements of evaporation.
Land-based observations show precipitation increases in some regions, and decreases in others, making it difficult to construct a globally integrated picture. Land-based observations have shown more extreme rainfall events, and more flooding associated with earlier snow melt at high northern latitudes, but there is strong regionality in the trends. Land-based observations are so far insufficient to provide evidence of changes in drought.
Ocean salinity, on the other hand, acts as a sensitive and effective rain gauge over the ocean. It naturally reflects and smooths out the difference between water gained by the ocean from precipitation, and water lost by the ocean through evaporation, both of which are very patchy and episodic. Ocean salinity is also affected by water runoff from the continents, and by the melting and freezing of sea ice or floating glacial ice. Fresh water added by melting ice on land will change global-averaged salinity, but changes to date are too small to observe.
Data from the past 50 years show widespread salinity changes in the upper ocean, which are indicative of systematic changes in precipitation and runoff minus evaporation, as illustrated below.
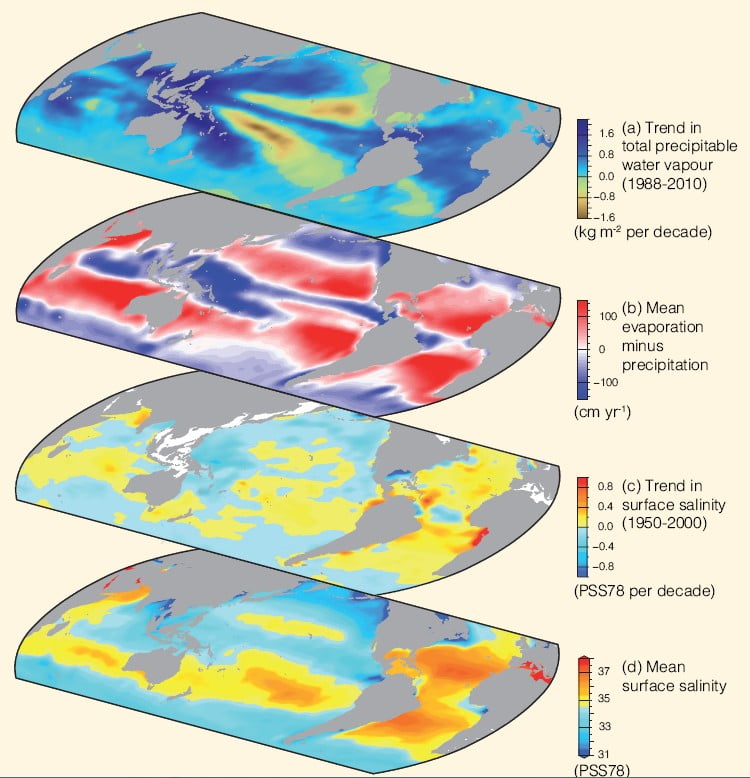 Figure 1: Changes in sea surface salinity are related to the atmospheric patterns of evaporation minus precipitation (E – P) and trends in total precipitable water: (a) Linear trend (1988–2010) in total precipitable water (water vapour integrated from the Earth’s surface up through the entire atmosphere) (kg m–2 per decade) from satellite observations (Special Sensor Microwave Imager) (blues: wetter; yellows: drier). (b) The 1979–2005 climatological mean net E –P (cm yr–1) from meteorological reanalysis (reds: net evaporation; blues: net precipitation). (c) Trend (1950–2000) in surface salinity (PSS78 per 50 years) (blues freshening; yellows-reds saltier). (d) The climatological-mean surface salinity (PSS78) (blues: <35; yellows–reds: >35).
How Important Is Water Vapour to Climate Change?
WG1 FAQ 8.1
As the largest contributor to the natural greenhouse effect, water vapour plays an essential role in the Earth’s climate. However, the amount of water vapour in the atmosphere is controlled mostly by air temperature, rather than by emissions. For that reason, scientists consider it a feedback agent, rather than a forcing to climate change. Anthropogenic emissions of water vapour through irrigation or power plant cooling have a negligible impact on the global climate.
Water vapour is the primary greenhouse gas in the Earth’s atmosphere. The contribution of water vapour to the natural greenhouse effect relative to that of carbon dioxide (CO2) depends on the accounting method, but can be considered to be approximately two to three times greater. Additional water vapour is injected into the atmosphere from anthropogenic activities, mostly through increased evaporation from irrigated crops, but also through power plant cooling, and marginally through the combustion of fossil fuel. One may therefore question why there is so much focus on CO2, and not on water vapour, as a forcing to climate change.
Water vapour behaves differently from CO2 in one fundamental way: it can condense and precipitate. When air with high humidity cools, some of the vapour condenses into water droplets or ice particles and precipitates. The typical residence time of water vapour in the atmosphere is ten days. The flux of water vapour into the atmosphere from anthropogenic sources is considerably less than from ‘natural’ evaporation. Therefore, it has a negligible impact on overall concentrations, and does not contribute significantly to the long-term greenhouse effect. This is the main reason why tropospheric water vapour (typically below 10km altitude) is not considered to be an anthropogenic gas contributing to radiative forcing.
Anthropogenic emissions do have a significant impact on water vapour in the stratosphere, which is the part of the atmosphere above about 10 km. Increased concentrations of methane (CH4) due to human activities lead to an additional source of water, through oxidation, which partly explains the observed changes in that atmospheric layer. That stratospheric water change has a radiative impact, is considered a forcing, and can be evaluated. Stratospheric concentrations of water have varied significantly in past decades. The full extent of these variations is not well understood and is probably less a forcing than a feedback process added to natural variability. The contribution of stratospheric water vapour to warming, both forcing and feedback, is much smaller than from CH4 or CO2.
The maximum amount of water vapour in the air is controlled by temperature. A typical column of air extending from the surface to the stratosphere (about 10km in height) in polar regions may contain only a few kilograms of water vapour per square metre, while a similar column of air in the tropics may contain up to 70 kg. With every extra degree of air temperature, the atmosphere can retain around 7% more water vapour (see upper-left insert in the figure). This increase in concentration amplifies the greenhouse effect, and therefore leads to more warming. This process, referred to as the water vapour feedback, is well understood and quantified. It occurs in all models used to estimate climate change, where its strength is consistent with observations. Although an increase in atmospheric water vapour has been observed, this change is recognized as a climate feedback (from increased atmospheric temperature) and should not be interpreted as a radiative forcing from anthropogenic emissions.
Currently, water vapour has the largest greenhouse effect in the Earth’s atmosphere. However, other greenhouse gases, primarily CO2, are necessary to sustain the presence of water vapour in the atmosphere. Indeed, if these other gases were removed from the atmosphere, its temperature would drop sufficiently to induce a decrease of water vapour, leading to a runaway drop of the greenhouse effect that would plunge the Earth into a frozen state. So greenhouse gases other than water vapour provide the temperature structure that sustains current levels of atmospheric water vapour. Therefore, although CO2 is the main anthropogenic control knob on climate, water vapour is a strong and fast feedback that amplifies any initial forcing by a typical factor between two and three. Water vapour is not a significant initial forcing, but is nevertheless a fundamental agent of climate change.
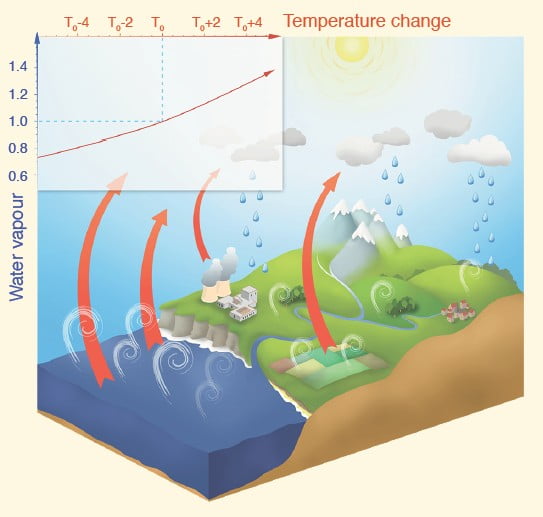 Illustration of the water cycle and its interaction with the greenhouse effect. The upper-left insert indicates the relative increase of potential water vapour content in the air with an increase of temperature (roughly 7% per degree). The white curls illustrate evaporation, which is compensated by precipitation to close the water budget. The red arrows illustrate the outgoing infrared radiation that is partly absorbed by water vapour and other gases, a process that is one component of the greenhouse effect. The stratospheric processes are not included in this figure.
How Will the Earth’s Water Cycle Change?
WG1 FAQ 12.2
The flow and storage of water in the Earth’s climate system are highly variable, but changes beyond those due to natural variability are expected by the end of the current century. In a warmer world, there will be net increases in rainfall, surface evaporation and plant transpiration. However, there will be substantial differences in the changes between locations. Some places will experience more precipitation and an accumulation of water on land. In others, the amount of water will decrease, due to regional drying and loss of snow and ice cover.
The water cycle consists of water stored on the Earth in all its phases, along with the movement of water through the Earth’s climate system. In the atmosphere, water occurs primarily as a gas—water vapour—but it also occurs as ice and liquid water in clouds. The ocean, of course, is primarily liquid water, but the ocean is also partly covered by ice in polar regions. Terrestrial water in liquid form appears as surface water—such as lakes and rivers—soil moisture and groundwater. Solid terrestrial water occurs in ice sheets, glaciers, snow and ice on the surface and in permafrost and seasonally frozen soil.
Statements about future climate sometimes say that the water cycle will accelerate, but this can be misleading, for strictly speaking, it implies that the cycling of water will occur more and more quickly with time and at all locations. Parts of the world will indeed experience intensification of the water cycle, with larger transports of water and more rapid movement of water into and out of storage reservoirs. However, other parts of the climate system will experience substantial depletion of water, and thus less movement of water. Some stores of water may even vanish.
As the Earth warms, some general features of change will occur simply in response to a warmer climate. Those changes are governed by the amount of energy that global warming adds to the climate system. Ice in all forms will melt more rapidly, and be less pervasive. For example, for some simulations assessed in this report, summer Arctic sea ice disappears before the middle of this century. The atmosphere will have more water vapour, and observations and model results indicate that it already does. By the end of the 21st century, the average amount of water vapour in the atmosphere could increase by 5 to 25%, depending on the amount of human emissions of greenhouse gases and radiatively active particles, such as smoke. Water will evaporate more quickly from the surface. Sea level will rise due to expansion of warming ocean waters and melting land ice flowing into the ocean.
These general changes are modified by the complexity of the climate system, so that they should not be expected to occur equally in all locations or at the same pace. For example, circulation of water in the atmosphere, on land and in the ocean can change as climate changes, concentrating water in some locations and depleting it in others. The changes also may vary throughout the year: some seasons tend to be wetter than others. Thus, model simulations assessed in this report show that winter precipitation in northern Asia may increase by more than 50%, whereas summer precipitation there is projected to hardly change. Humans also intervene directly in the water cycle, through water management and changes in land use. Changing population distributions and water practices would produce further changes in the water cycle.
Water cycle processes can occur over minutes, hours, days and longer, and over distances from metres to kilometres and greater. Variability on these scales is typically greater than for temperature, so climate changes in precipitation are harder to discern. Despite this complexity, projections of future climate show changes that are common across many models and climate forcing scenarios. These results collectively suggest well understood mechanisms of change, even if magnitudes vary with model and forcing. We focus here on changes over land, where changes in the water cycle have their largest impact on human and natural systems.
Projected climate changes from simulations assessed in this report (shown schematically in Figure 1) generally show an increase in precipitation in parts of the deep tropics and polar latitudes that could exceed 50% by the end of the 21st century under the most extreme emissions scenario. In contrast, large areas of the subtropics could have decreases of 30% or more. In the tropics, these changes appear to be governed by increases in atmospheric water vapour and changes in atmospheric circulation that further concentrate water vapour in the tropics and thus promote more tropical rainfall. In the subtropics, these circulation changes simultaneously promote less rainfall despite warming in these regions. Because the subtropics are home to most of the world’s deserts, these changes imply increasing aridity in already dry areas, and possible expansion of deserts.
Increases at higher latitudes are governed by warmer temperatures, which allow more water in the atmosphere and thus, more water that can precipitate. The warmer climate also allows storm systems in the extratropics to transport more water vapour into the higher latitudes, without requiring substantial changes in typical wind strength. As indicated above, high latitude changes are more pronounced during the colder seasons.
Whether land becomes drier or wetter depends partly on precipitation changes, but also on changes in surface evaporation and transpiration from plants (together called evapotranspiration). Because a warmer atmosphere can have more water vapour, it can induce greater evapotranspiration, given sufficient terrestrial water. However, increased carbon dioxide in the atmosphere reduces a plant’s tendency to transpire into the atmosphere, partly counteracting the effect of warming.
In the tropics, increased evapotranspiration tends to counteract the effects of increased precipitation on soil moisture, whereas in the subtropics, already low amounts of soil moisture allow for little change in evapotranspiration. At higher latitudes, the increased precipitation generally outweighs increased evapotranspiration in projected climates, yielding increased annual mean runoff, but mixed changes in soil moisture. As implied by circulation changes in Figure 1, boundaries of high or low moisture regions may also shift.
A further complicating factor is the character of rainfall. Model projections show rainfall becoming more intense, in part because more moisture will be present in the atmosphere. Thus, for simulations assessed in this report, over much of the land, 1-day precipitation events that currently occur on average every 20 years could occur every 10 years or even more frequently by the end of the 21st century. At the same time, projections also show that precipitation events overall will tend to occur less frequently. These changes produce two seemingly contradictory effects: more intense downpours, leading to more floods, yet longer dry periods between rain events, leading to more drought.
At high latitudes and at high elevation, further changes occur due to the loss of frozen water. Some of these are resolved by the present generation of global climate models (GCMs), and some changes can only be inferred because they involve features such as glaciers, which typically are not resolved or included in the models. The warmer climate means that snow tends to start accumulating later in the fall, and melt earlier in the spring. Simulations assessed in this report show March to April snow cover in the Northern Hemisphere is projected to decrease by approximately 10 to 30% on average by the end of this century, depending on the greenhouse gas scenario. The earlier spring melt alters the timing of peak springtime flow in rivers receiving snowmelt. As a result, later flow rates will decrease, potentially affecting water resource management. These features appear in GCM simulations.
Loss of permafrost will allow moisture to seep more deeply into the ground, but it will also allow the ground to warm, which could enhance evapotranspiration. However, most current GCMs do not include all the processes needed to simulate well permafrost changes. Studies analysing soils freezing or using GCM output to drive more detailed land models suggest substantial permafrost loss by the end of this centuryChanges to Groundwater in Uganda . In addition, even though current GCMs do not explicitly include glacier evolution, we can expect that glaciers will continue to recede, and the volume of water they provide to rivers in the summer may dwindle in some locations as they disappear. Loss of glaciers will also contribute to a reduction in springtime river flow. However, if annual mean precipitation increases—either as snow or rain—then these results do not necessarily mean that annual mean river flow will decrease.
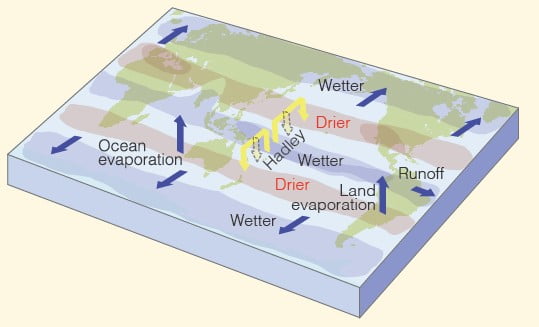 Figure 1: Schematic diagram of projected changes in major components of the water cycle. The blue arrows indicate major types of water movement changes through the Earth’s climate system: poleward water transport by extratropical winds, evaporation from the surface and runoff from the land to the oceans. The shaded regions denote areas more likely to become drier or wetter. Yellow arrows indicate an important atmospheric circulation change by the Hadley Circulation, whose upward motion promotes tropical rainfall, while suppressing subtropical rainfall. Model projections indicate that the Hadley Circulation will shift its downward branch poleward in both the Northern and Southern Hemispheres, with associated drying. Wetter conditions are projected at high latitudes, because a warmer atmosphere will allow greater precipitation, with greater movement of water into these regions.
How will climate change affect the frequency and severity of floods and droughts?
WG2 FAQ 3.1
Climate change is projected to alter the frequency and magnitude of both floods and droughts. The impact is expected to vary from region to region. The few available studies suggest that flood hazards will increase over more than half of the globe, in particular in central and eastern Siberia, parts of south-east Asia including India, tropical Africa, and northern South America, but decreases are projected in parts of northern and eastern Europe, Anatolia, central and east Asia, central North America, and southern South America. The frequency of floods in small river basins is very likely to increase, but that may not be true of larger watersheds because intense rain is usually confined to more limited areas. Spring snowmelt floods are likely to become smaller, both because less winter precipitation will fall as snow and because more snow will melt during thaws over the course of the entire winter. Worldwide, the damage from floods will increase because more people and more assets will be in harm’s way.
By the end of the 21st century meteorological droughts (less rainfall) and agricultural droughts (drier soil) are projected to become longer, or more frequent, or both, in some regions and some seasons, because of reduced rainfall or increased evaporation or both. But it is still uncertain what these rainfall and soil moisture deficits might mean for prolonged reductions of streamflow and lake and groundwater levels. Droughts are projected to intensify in southern Europe and the Mediterranean region, central Europe, central and southern North America, Central America, northeast Brazil and southern Africa. In dry regions, more intense droughts will stress water-supply systems. In wetter regions, more intense seasonal droughts can be managed by current water-supply systems and by adaptation; for example, demand can be reduced by using water more efficiently, or supply can be increased by increasing the storage capacity in reservoirs.
How will the availability of water resources be affected by climate change?
WG2 FAQ 3.2
Climate models project decreases of renewable water resources in some regions and increases in others, albeit with large uncertainty in many places. Broadly, water resources are projected to decrease in many mid-latitude and dry subtropical regions, and to increase at high latitudes and in many humid mid-latitude regions. Even where increases are projected, there can be short-term shortages due to more variable streamflow (because of greater variability of precipitation), and seasonal reductions of water supply due to reduced snow and ice storage. Availability of clean water can also be reduced by negative impacts of climate change on water quality; for instance the quality of lakes used for water supply could be impaired by the presence of algae producing toxins.
How is climate change affecting monsoons?
WG1 FAQ 14.1
Monsoons are the most important mode of seasonal climate variation in the tropics, and are responsible for a large fraction of the annual rainfall in many regions. Their strength and timing is related to atmospheric moisture content, land–sea temperature contrast, land cover and use, atmospheric aerosol loadings and other factors. Overall, monsoonal rainfall is projected to become more intense in future, and to affect larger areas, because atmospheric moisture content increases with temperature. However, the localized effects of climate change on regional monsoon strength and variability are complex and more uncertain.
Monsoon rains fall over all tropical continents: Asia, Australia, the Americas and Africa. The monsoon circulation is driven by the difference in temperature between land and sea, which varies seasonally with the distribution of solar heating. The duration and amount of rainfall depends on the moisture content of the air, and on the configuration and strength of the atmospheric circulation. The regional distribution of land and ocean also plays a role, as does topography. For example, the Tibetan Plateau—through variations in its snow cover and surface heating—modulates the strength of the complex Asian monsoon systems. Where moist on-shore winds rise over mountains, as they do in southwest India, monsoon rainfall is intensified. On the lee side of such mountains, it lessens.
Since the late 1970s, the East Asian summer monsoon has been weakening and not extending as far north as it used to in earlier times, as a result of changes in the atmospheric circulation. That in turn has led to increasing drought in northern China, but floods in the Yangtze River Valley farther south. In contrast, the Indo-Australian and Western Pacific monsoon systems show no coherent trends since the mid-20th century, but are strongly modulated by the El Niño-Southern Oscillation (ENSO). Similarly, changes observed in the South American monsoon system over the last few decades are strongly related to ENSO variability. Evidence of trends in the North American monsoon system is limited, but a tendency towards heavier rainfalls on the northern side of the main monsoon region has been observed. No systematic long-term trends have been observed in the behaviour of the Indian or the African monsoons.
The land surface warms more rapidly than the ocean surface, so that surface temperature contrast is increasing in most regions. The tropical atmospheric overturning circulation, however, slows down on average as the climate warms due to energy balance constraints in the tropical atmosphere. These changes in the atmospheric circulation lead to regional changes in monsoon intensity, area and timing. There are a number of other effects as to how climate change can influence monsoons. Surface heating varies with the intensity of solar radiation absorption, which is itself affected by any land use changes that alter the reflectivity (albedo) of the land surface. Also, changing atmospheric aerosol loadings, such as air pollution, affect how much solar radiation reaches the ground, which can change the monsoon circulation by altering summer solar heating of the land surface. Absorption of solar radiation by aerosols, on the other hand, warms the atmosphere, changing the atmospheric heating distribution.
The strongest effect of climate change on the monsoons is the increase in atmospheric moisture associated with warming of the atmosphere, resulting in an increase in total monsoon rainfall even if the strength of the monsoon circulation weakens or does not change.
Climate model projections through the 21st century show an increase in total monsoon rainfall, largely due to increasing atmospheric moisture content. The total surface area affected by the monsoons is projected to increase, along with the general poleward expansion of the tropical regions. Climate models project from 5% to an approximately 15% increase of global monsoon rainfall depending on scenarios. Though total tropical monsoon rainfall increases, some areas will receive less monsoon rainfall, due to weakening tropical wind circulations. Monsoon onset dates are likely to be early or not to change much and the monsoon retreat dates are likely to delay, resulting in lengthening of the monsoon season.
Future regional trends in monsoon intensity and timing remain uncertain in many parts of the world. Year-to-year variations in the monsoons in many tropical regions are affected by ENSO. How ENSO will change in future—and how its effects on monsoon will change—also remain uncertain. However, the projected overall increase in monsoon rainfall indicates a corresponding increase in the risk of extreme rain events in most regions.
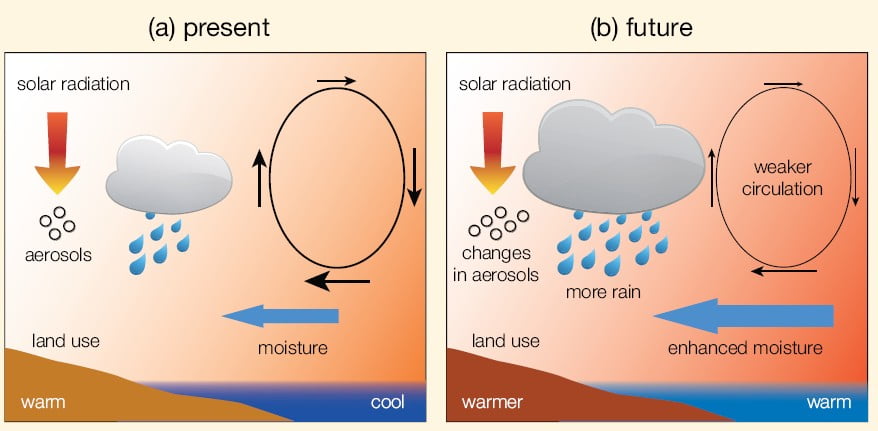 Schematic diagram illustrating the main ways that human activity influences monsoon rainfall. As the climate warms, increasing water vapour transport from the ocean into land increases because warmer air contains more water vapour. This also increases the potential for heavy rainfalls. Warming-related changes in large-scale circulation influence the strength and extent of the overall monsoon circulation. Land use change and atmospheric aerosol loading can also affect the amount of solar radiation that is absorbed in the atmosphere and land, potentially moderating the land–sea temperature difference.
Changes to Groundwater in Uganda
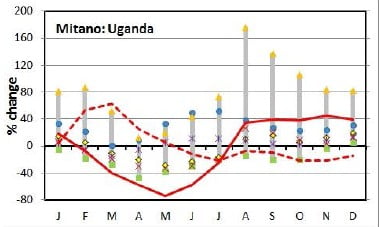
Simulated change in mean monthly runoff of the Mitano River in Uganda across seven climate models, for a 2°C increase in global mean temperature above the 1961-1990 average. One of the seven climate models is highlighted separately, showing changes for both a 2°C increase (dotted line) and a 4°C increase (solid line).
Simulated change in mean monthly runoff of the Mitano River in Uganda across seven climate models, for a 2°C increase in global mean temperature above the 1961-1990 average. One of the seven climate models is highlighted separately, showing changes for both a 2°C increase (dotted line) and a 4°C increase (solid line).
Precipitation is the main driver of changes to river runoff and the seasonal changes in precipitation are usually reflected in seasonal streamflow variability. However, changes in groundwater recharge also affect streamflow. As global temperatures rise, evapotranspiration increases, reducing the amount of groundwater. Human and natural systems in the Upper Nile region have historically been very vulnerable to changes in river flow. People are particularly reliant on the river for fishing and hydro-electric power production, so, although it can be hard for models to accurately recreate local rainfall patterns, it is important to try to project how they might change in the future.
The Mitano river is in the Upper Nile basin in Uganda, which has a humid, tropical climate. Usually, the effect of the ‘short’ (March-May) and ‘long’ (September- November) rains determine the river’s discharge. However, mean global temperature increases of 4°C or more with respect to the 1961-1990 average are projected to decrease groundwater outflow to the river so much that the annual mean discharge will fall, even though annual mean precipitation will be higher. The spring discharge peak disappears and the river flow regime changes from having two seasonal peaks to only one – the effect of the ‘short rains’ could be lost. This is because, for the Mitano, groundwater flow is far more important than lateral (quickflow within the upper soil profile) or surface flow. Increasing evapotranspiration limits the amount of water penetrating the soil profile and replenishing the shallow groundwater store during the first, short, wet season.
Changing groundwater levels also affect land surface energy fluxes, including through evaporation, and thus feedback on the climate system, particularly in semi-arid areas.
Additional source:
Kingston, D. G. and Taylor, R. G.: Sources of uncertainty in climate change impacts on river discharge and groundwater in a headwater catchment of the Upper Nile Basin, Uganda, Hydrol. Earth Syst. Sci., 14, 1297-1308, doi:10.5194/hess-14-1297-2010, 2010.
The mass budgets of Himalayan Glaciers
The mass budgets of Himalayan glaciers in Bhutan, China, India, Nepal and Pakistan have been negative, on average, for the past 5 decades. Changes in temperature and precipitation affect the glaciers, as do changes in the amount of black carbon (soot) in the atmosphere, which, when deposited on the glaciers’ surface, can decrease the albedo and lead to melting. Many communities are both reliant on glacial meltwater and vulnerable to flooding from moraine-dammed ice marginal lakes.


Questions to consider: What is meant by water security?
How does climate change lead to an increase in water insecurity?
Using a case study, explain one way a country has responded to the threat of water insecurity.
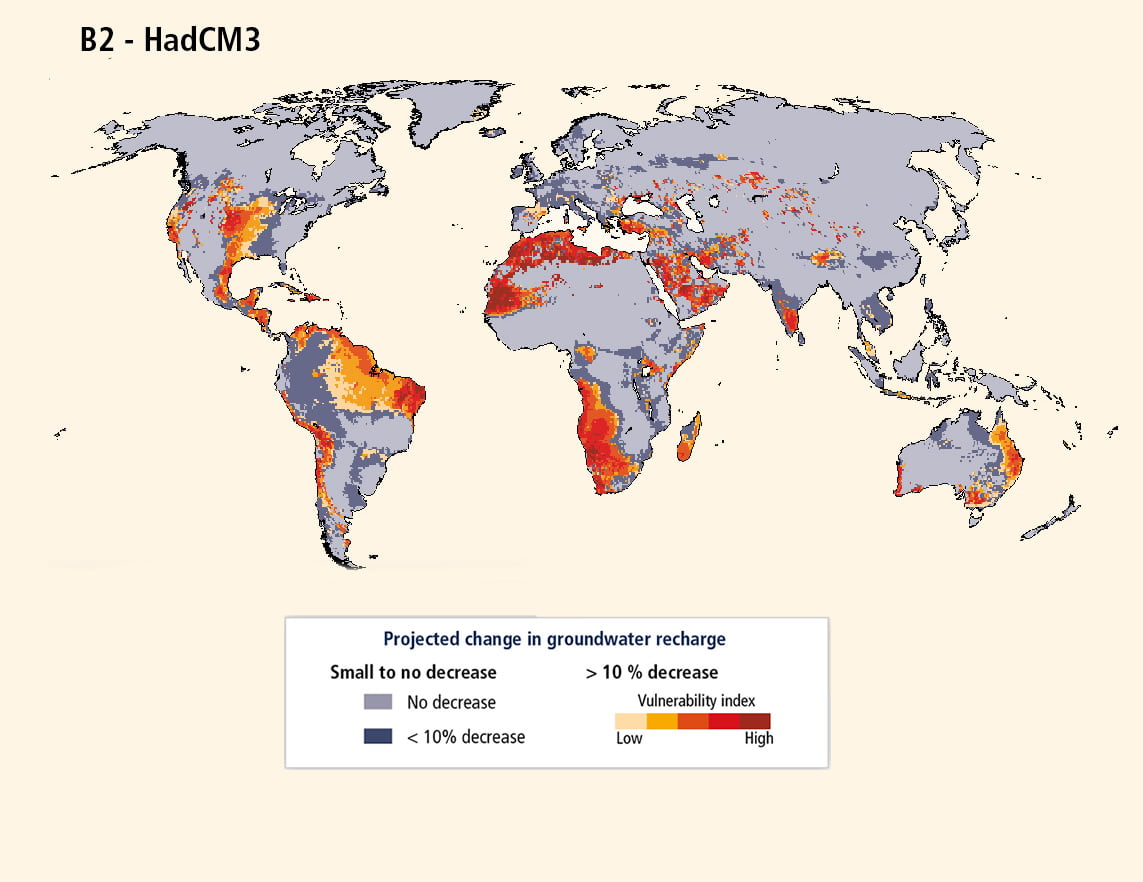
WG2 Chapter 3, Figure 7. The impact of climate change on renewable groundwater resources by the 2050s, for a low emissions scenario. The map also shows the human vulnerability index, which is only defined for areas where the groundwater recharge is projected to decrease by at least 10% relative to 1961-1990.
Water Saving Irrigation in China
Irrigation in the Upper East Region, Northern Ghana
Return to IPCC updates for geography
How will the availability of water resources be affected by climate change?
How should water management be modified in the face of climate change?
Freshwater-related risks of climate change increase significantly with increasing greenhouse gas emissions. Renewable surface water and groundwater resources will be reduced significantly in most dry subtropical regions. Surface and ground water availability has an impact on agriculture (for food and livestock food production), energy production (with a direct impact on hydro-electric power production and crop growth for bioenergy crops as well as on the water cooling for most power plants), domestic water supply and sanitation and freshwater ecosystems.
How will the availability of water resources be affected by climate change?
WG2 FAQ3.2
Climate models project decreases of renewable water resources in some regions and increases in others, albeit with large uncertainty in many places. Broadly, water resources are projected to decrease in many mid-latitude and dry subtropical regions, and to increase at high latitudes and in many humid mid-latitude regions. Even where increases are projected, there can be short-term shortages due to more variable streamflow (because of greater variability of precipitation), and seasonal reductions of water supply due to reduced snow and ice storage. Availability of clean water can also be reduced by negative impacts of climate change on water quality; for instance the quality of lakes used for water supply could be impaired by the presence of algae producing toxins.
In the future, groundwater may be a more reliable water supply than the surface water supply. However, this is only sustainable where, over the long term, withdrawals remain well below recharge, while care must also be taken to avoid excessive reduction of groundwater outflow to rivers. The percentage of the projected global population that will suffer from a decrease of renewable groundwater resources of more than 10% between 1980 and 2080 is projected to be between 24-38%. For each degree of global mean temperature rise, an additional 4% of the global land area is projected to suffer a groundwater resources decrease of more than 30% and an additional 1% to suffer a decrease of more than 70%.
How should water management be modified in the face of climate change?
WG2 FAQ 3.3
Managers of water utilities and water resources have considerable experience in adapting their policies and practices to the weather. But in the face of climate change, long-term planning (over several decades) is needed for a future that is highly uncertain. A flexible portfolio of solutions that produces benefits regardless of the impacts of climate change (“low-regret” solutions) and that can be implemented adaptively, step by step, is valuable because it allows policies to evolve progressively, thus building on – rather than losing the value of – previous investments. Adaptive measures that may prove particularly effective include rainwater harvesting, conservation tillage, maintaining vegetation cover, planting trees in steeply-sloping fields, mini-terracing for soil and moisture conservation, improved pasture management, water re-use, desalination, and more efficient soil and irrigation-water management. Restoring and protecting freshwater habitats, and managing natural floodplains, are additional adaptive measures that are not usually part of conventional management practice.
Water Saving Irrigation in China
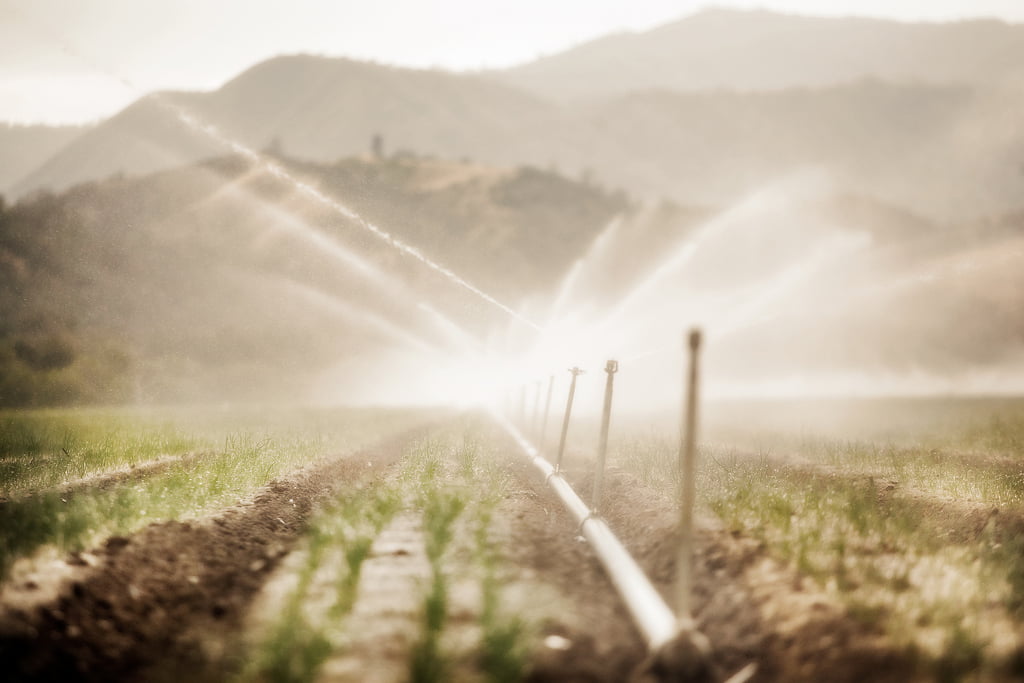 Water-saving irrigation (low pressure pipes, spray irrigation and micro or drip irrigation) has enhanced climate change adaptation capacity, improved ecosystem services, and promoted regional sustainable development in China.
Per capita, freshwater availability in China is among the lowest in the world and increasingly in short supply. China’s agriculture currently accounts for 65% of total annual water consumption. With climate change, population growth and a growth in non-agricultural water consumption, China’s agriculture could be faced with a severe shortage of water resources.
Water-saving irrigation, in particular micro-irrigation which drips water directly onto the roots of plants, is one effective measure to deal with water scarcity and food security issues. Through water-saving irrigation practices, the water saved from 2007-2009 was equivalent to 5.6%-11.8% of the national total water consumption.
In addition, about 21.83-47.48 Mt CO2 emissions were saved (compared to an annual total emission of 6786 Mt CO2 in 2007). Therefore, the positive benefits of water saving irrigation have included mitigating climate change and promoting sustainable development.
| 2007 | 2008 | 2009 | |
| Water saved (Btu2) | 19.37-40.86 | 19.86-41.55 | 22.58-57.25 |
| Energy saved (Mt) | 2.92-6.39 | 3.08-6.72 | 3.57-7.73 |
| CO2 emission reduction (Mt) | 6.66-14.58 | 7.02-15.31 | 8.15-17.59 |
In recent years, a rise in precipitation and temperature has led to the melting of glaciers and expansion of inland high mountain lakes, contributing to alpine grassland degradation in Northern Tibet. Among many grassland protection measures, alpine grassland water saving irrigation measures could be effective in redistributing and making full use of increased precipitation and lake water in the dry period. A three-year demonstration of alpine grassland water saving irrigation measures showed that alpine grassland primary productivity nearly doubled while the number of plant species increased from 91 to 129, helping to protect and restore the alpine grassland ecosystem and ecosystem services and to promote regional, socioeconomically sustainable development.
Additional Source:

Cost-effectiveness analysis of water-saving irrigation technologies based on climate change response: A case study of China, X. Zou, Y. Li, R Cremades, Q. Gao, Y. Wan and X. Qin, 2013, Agricultural Water Management, 129, 9-20.
The Upper East Region of northern Ghana has, since colonial times (1904-1957), been the poorest part of the country. The area suffers from difficult semi-arid climatic conditions, relatively high population density and patterns of underdevelopment, which are the result of discriminatory colonial and post-colonial policies. Climate change (a decrease in precipitation, increase in temperature and evapotranspiration and a shift in the rainy season) and land degradation have considerably altered the conditions for rain-fed agriculture in Northern Ghana. Furthermore, population pressure has led to continuous farming of the available agricultural lands causing land degradation. Crop failure and decreasing yields that result from these environmental changes have caused further impoverishment. In the past, youth often opted for migration to Ghana’s wealthier south, in order to supplement meagre agricultural livelihoods.
Since the mid-1990s there has been a farmer led initiative to develop shallow groundwater irrigation (SGI) for vegetable gardening of tomatoes, onions and peppers. This development has helped to ameliorate poverty and to reverse rural-urban migration.
However, while the irrigators were initially able to profit from the development of good road access to northern Ghana and an increasing demand for vegetables in Ghana’s south, many now frequently meet with market failure. The sale of fresh tomatoes is met with stiff competition from small-scale farmers from neighbouring Burkina Faso and Ghana’s market is flooded with cheap tomato paste from countries where the production of tomatoes is highly subsidised. Global and regional competition has started to render SGI, developed as a means to locally adapt to environmental change, increasingly risky. As markets become as unreliable as the rains, Ghanaian farmers now face the uphill task of dealing simultaneously with global climate change and globalisation.
Additional Source:
Laube, Wolfram; Awo, Martha; Schraven, Benjamin (2008) : Erratic rains and erratic markets: Environmental change, economic globalisation and the expansion of shallow groundwater irrigation in West Africa, ZEF Working Paper Series, No. 30, http://nbnresolving.de/urn:nbn:de:0202-20080911309
There is a video about managing water resources at https://www.youtube.com/watch?v=R9BB0XdRxEA

Questions to consider:
State three factors which would cause a change to the Amazonian Forest Ecosystem.
Explain the impact of the change to the Amazonian Forest Ecosystem
When looking at the effect of climate change on ecosystems, why does the level of carbon dioxide in the atmosphere need to be considered as well as temperature change.

Vegetation changes in the Amazon basin
Return to IPCC updates for geography
How do land-use and land-cover changes cause changes in climate?
What are the non-greenhouse gas effects of rising carbon dioxide on ecosystems?
The Carbon Dioxide fertilisation effect
A Possible Amazon Basin Tipping Point
In general, climate exerts a dominant control over the distribution of terrestrial vegetation and surface properties that in turn affects the local climate by changing the local atmospheric water, Carbon and energy budgets. It has been hypothesized that these vegetation–climate feedbacks can explain shifts of vegetation through time: Firstly, increased transpiration may result in more precipitation, which in turn increases plant productivity, which amplifies transpiration further. Secondly, increased productivity leads to more canopy cover, which is darker (lower albedo) than snow and bare soil. This results in higher temperatures on the above ground parts of individual plants, thus also amplifying plant productivity.
The combined effects of a warming climate, higher levels of CO2, land-use change and increased Nitrogen availability may be responsible for primary productivity increases in many parts of the world. Enhanced productivity can lead to shifts in albedo and transpiration, which feed back to the water cycle through heat fluxes and precipitation.
Rising atmospheric CO2 concentrations affect ecosystems directly including through biological and chemical processes such as the carbon dioxide fertilisation effect. Plants can respond to elevated CO2 by opening their stomata less to take in the same amount of CO2 or by structurally adapting their stomatal density and size, both potentially reducing transpiration which increases the water efficiency of the plants but reduces the flow of water vapour, and the energy that goes with it, to the atmosphere. Paleo records over the Late Quaternary (past million years) show that changes in the atmospheric CO2 content between 180 and 280 ppmv had ecosystem-scale effects worldwide.
The direct effect of CO2 on plant physiology, independent of its role as a greenhouse gas, means that assessing climate change impacts on ecosystems and hydrology solely in terms of global mean temperature rise is an oversimplification. A 2°C rise in global mean temperature, for example, may have a different net impact on ecosystems depending on the change in CO2 concentration accompanying the rise: If a small change in CO2 causes a 2°C rise, or, if other greenhouse gases are mainly responsible for the rise, the vegetation response will be different to a 2°C rise triggered by a large increase in CO2.
Vegetation cover can be affected by climate change, with forest cover potentially decreasing (e.g. in the tropics) or increasing (e.g. in high latitudes). In particular, the Amazon forest has been the subject of several studies, generally agreeing that future climate change would increase the risk of tropical forest being replaced by seasonal forest or even savannah. The increase in atmospheric CO2 reduces the risk, through an increase in the water efficiency of plants.
Direct human changes to the land cover can also have impacts on the carbon and water cycles, as well as on the Earth’s energy balance, through changes in surface albedo, transpiration and evaporation.
The coupling processes between terrestrial Carbon, Nitrogen and hydrological processes are extremely complex and far from well understood.
The effect of climate extremes on vegetation and the carbon and water cycles
Extreme events such as heatwaves, droughts and storms can cause vegetation death, fires and subsequent insect infestations which actually lead to a net output of carbon from ecosystems. For example, forests are characterized by the large biomass carbon stocks, which are vulnerable to wind damage, storms, ice storms, frost, drought, fire and pathogen or pest outbreaks. Trees take a long time to regrow, so the recovery times for forest biomass lost through extreme events are particularly long. Therefore, the effects of climate extremes on the carbon balance in forests are both immediate and lagged, and potentially long-lasting. Climate extremes may also trigger processes that decrease the turnover rate of some carbon pools and lead to additional long-term sequestration in these pools. A well-known example is charcoal created in fires, which generally persists longer in soils than leaf litter.
During the European 2003 heatwave, it was the lack of precipitation (and soil moisture) rather than the high temperatures which was the main factor limiting vegetation growth in the temperate and Mediterranean forest ecosystems.
Further Links:
There is a nice, short summary article at http://www.carbonbrief.org/blog/2011/03/new-scientific-papers-on-plants-and-carbon-dioxide/
http://www.nature.com/nature/journal/v500/n7462/fig_tab/nature12350_F2.html An overview of how carbon flows may be triggered, or greatly altered, by extreme events including extreme precipitation.
Figure 1 from http://www.mdpi.com/1424-8220/9/11/8624/htm shows a schematic view of the components of the climate system, their processes and interactions.
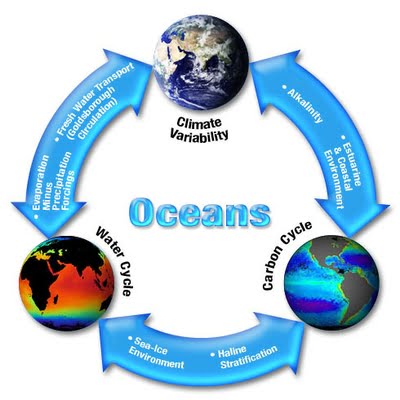
Ocean related feedback exists between climate variability, the water cycle and the carbon cycle. http://nasa-information.blogspot.co.uk/2010/11/ocean-earth-system.html
http://www.nasa.gov/images/content/703470main_InfoGraphic.jpg An infographic showing the limits to vegetation growth from soil nutrient availability.
A figure showing the ecosystem processes and feedbacks triggered by extreme climate events. http://www.nature.com/nature/journal/v500/n7462/fig_tab/nature12350_F1.html
How do land-use and land-cover changes cause changes in climate?
WG2 FAQ 4.1
Land use change affects the local as well as the global climate. Different forms of land cover and land use can cause warming or cooling and changes in rainfall, depending on where they occur in the world, what the preceding land cover was, and how the land is now managed. Vegetation cover, species composition and land management practices (such as harvesting, burning, fertilizing, grazing or cultivation) influence the emission or absorption of greenhouse gases. The brightness of the land cover affects the fraction of solar radiation that is reflected back into the sky, instead of being absorbed, thus warming the air immediately above the surface. Vegetation and land use patterns also influence water use and evapotranspiration, which alter local climate conditions. Effective land-use strategies can also help to mitigate climate change.
What are the non-greenhouse gas effects of rising carbon dioxide on ecosystems?
WG2 FAQ 4.2
Carbon dioxide (CO2) is an essential building block of the process of photosynthesis. Simply put, plants use sunlight and water to convert CO2 into energy. Higher CO2 concentrations enhance photosynthesis and growth (up to a point), and reduce the water used by the plant. This means that water remains longer in the soil or recharges rivers and aquifers. These effects are mostly beneficial; however, high CO2 also has negative effects, in addition to causing global warming. High CO2 levels cause the nitrogen content of forest vegetation to decline and can increase their chemical defences, reducing their quality as a source of food for plant-eating animals. Furthermore, rising CO2 causes ocean waters to become acidic, and can stimulate more intense algal blooms in lakes and reservoirs.
The Carbon Dioxide fertilisation effect
WG1 Box 6.3
Elevated atmospheric CO2 concentrations lead to higher leaf photosynthesis and reduced canopy transpiration, which in turn lead to increased plant water use efficiency and reduced fluxes of latent heat from the surface to the atmosphere. The increase in leaf photosynthesis with rising CO2, the so-called CO2 fertilisation effect, plays a dominant role in terrestrial biogeochemical models to explain the global land carbon sink, yet it is one of most unconstrained process in those models.
Field experiments provide a direct evidence of increased photosynthesis rates and water use efficiency (plant carbon gains per unit of water loss from transpiration) in plants growing under elevated CO2. These physiological changes translate into a broad range of higher plant carbon accumulation in more than two-thirds of the experiments and with increased net primary productivity (NPP) of about 20 to 25% at double CO2 from pre-industrial concentrations. Since the last IPCC report, new evidence is available from long-term Free-air CO2 Enrichment (FACE) experiments in temperate ecosystems showing the capacity of ecosystems exposed to elevated CO2 to sustain higher rates of carbon accumulation over multiple years. However, FACE experiments also show the diminishing or lack of CO2 fertilisation effect in some ecosystems and for some plant species. This lack of response occurs despite increased water use efficiency, also confirmed with tree ring evidence
Nutrient limitation is hypothesized as primary cause for reduced or lack of CO2 fertilisation effect observed on NPP in some experiments. Nitrogen and phosphorus are very likely to play the most important role in this limitation of the CO2 fertilisation effect on NPP, with nitrogen limitation prevalent in temperate and boreal ecosystems, and phosphorus limitation in the tropics. Micronutrients interact in diverse ways with other nutrients in constraining NPP such as molybdenum and phosphorus in the tropics. Thus, with high confidence, the CO2 fertilisation effect will lead to enhanced NPP, but significant uncertainties remain on the magnitude of this effect, given the lack of experiments outside of temperate climates.
A Possible Amazon Basin Tipping Point
WG2 Box 4.3
Since the last assessment report of the IPCC (AR4), our understanding of the potential of a large-scale, climate-driven, self-reinforcing transition of Amazon forests to a dry stable state (known as the Amazon “forest dieback”) has improved. Modelling studies indicate that the likelihood of a climate-driven forest dieback by 2100 is lower than previously thought, although lower rainfall and more severe drought is expected in the eastern Amazon. There is now medium confidence that climate change alone (that is, through changes in the climate envelope, without invoking fire and land use) will not drive large-scale forest loss by 2100 although shifts to drier forest types are predicted in the eastern Amazon.
Meteorological fire danger is projected to increase. Field studies and regional observations have provided new evidence of critical ecological thresholds and positive feedbacks between climate change and land-use activities that could drive a fire mediated, self-reinforcing dieback during the next few decades. There is now medium confidence that severe drought episodes, land use, and fire interact synergistically to drive the transition of mature Amazon forests to low-biomass, low-statured fire-adapted woody vegetation. Most primary forests of the Amazon Basin have damp fine fuel layers and low susceptibility to fire, even during annual dry seasons. Forest susceptibility to fire increases through canopy thinning and greater sunlight penetration caused by tree mortality associated with selective logging, previous forest fire, severe drought, or drought-induced tree mortality. The impact of fire on tree mortality is also weather-dependent. Under very dry, hot conditions, fire-related tree mortality can increase. Under some circumstances, tree damage is sufficient to allow light-demanding, flammable grasses to establish in the forest understorey, increasing forest susceptibility to further burning. There is high confidence that logging, severe drought, and previous fire increase Amazon forest susceptibility to burning. Landscape level processes further increase the likelihood of forest fire. Fire ignition sources are more common in agricultural and grazing lands than in forested landscapes, and forest conversion to grazing and crop lands can inhibit regional rainfall through changes in albedo and evapotranspiration or through smoke that can inhibit rainfall under some circumstances. Apart from these landscape processes, climate change could increase the incidence of severe drought episodes.
If recent patterns of deforestation (through 2005), logging, severe drought, and forest fire continue into the future, more than half of the region’s forests will be cleared, logged, burned or exposed to drought by 2030, even without invoking positive feedbacks with regional climate, releasing 20±10 Pg of carbon to the atmosphere. The likelihood of a tipping point being reached may decline if extreme droughts (such as 1998, 2005, and 2010) become less frequent, if land management fires are suppressed, if forest fires are extinguished on a large scale, if deforestation declines, or if cleared lands are reforested. The 77% decline in deforestation in the Brazilian Amazon with 80% of the region’s forest still standing demonstrates that policy-led avoidance of a fire-mediated tipping point is plausible.
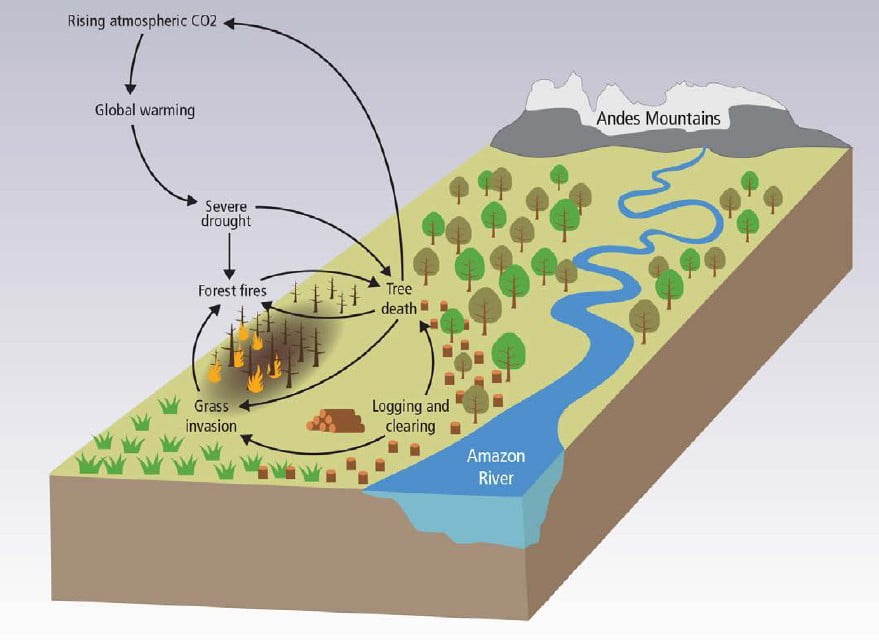 WG2 Chapter 4, Figure 8.
The forests of the Amazon Basin are being altered through severe droughts, land use (deforestation, logging), and increased frequencies of forest fire. Some of these processes are self-reinforcing through positive feedbacks, and create the potential for a large-scale tipping point. For example, forest fire kills trees, increasing the likelihood of subsequent burning. This effect is magnified when tree death allows forests to be invaded by grasses, which are more flammable. Deforestation provides ignition sources to flammable forests, contributing to this dieback. Climate change contributes to this tipping point by increasing drought severity, reducing rainfall and raising air temperatures, particularly in the eastern Amazon Basin.
Vegetation changes in the Amazon basin
WG2 Chapter 4, Figure 8. The forests of the Amazon Basin are already being altered through severe droughts, changes in land use (deforestation, logging), and increased frequencies of forest fire. Some of these processes are self-reinforcing through positive feedbacks, and create the potential for a large-scale tipping point. For example, forest fire kills trees, increasing the likelihood of subsequent burning. This effect is magnified when tree death allows forests to be invaded by flammable grasses. Deforestation provides ignition sources to flammable forests, contributing to this dieback. Climate change contributes to this tipping point by increasing drought severity, reducing rainfall and raising air temperatures, particularly in the eastern Amazon Basin.
There is a high risk that the large magnitudes and high rates of climate change this century will result in abrupt and irreversible regional-scale changes to terrestrial and freshwater ecosystems, especially in the Amazon and Arctic, leading to additional climate change.
There are plausible mechanisms, supported by experimental evidence, observations, and climate model simulations, for the existence of ecosystem tipping points in the rainforests of the Amazon basin. Climate change (temperature and precipitation changes) alone is not projected to lead to abrupt widespread loss of forest cover in the Amazon during this century. However, a projected increase in severe drought episodes, related to stronger El Niño events, together with land-use change and forest fires, would cause much of the Amazon forest to transform to less dense, drought- and fire-adapted ecosystems. This would risk reducing biodiversity in an important ecosystem, and would reduce the amount of carbon absorbed from the atmosphere through photosynthesis. It would also reduce the amount of evaporation, increasing the warming locally. Large reductions in deforestation, as well as wider application of effective wildfire management would lower the risk of abrupt change in the Amazon.
Amazonian forests were estimated to have lost 1.6 PgC and 2.2 PgC following the severe droughts of 2005 and 2010, respectively.
Deforestation, the water cycle and the carbon cycle in the Amazon – learning ideas related to this.
Additional source:
Climate extremes and the carbon cycle, M. Reichstein, M. Bahn, P. Ciais, D. Frank, M. Mahecha, S. Seneviratne,.J. Zscheischler, C. Beer, N. Buchmann, D. Frank, D. Papale, A. Rammig, P. Smith, K. Thonicke, M. van der Velde, S. Vicca, A. Walz & M. Wattenbach, 2013, 500, Nature, 287-295.


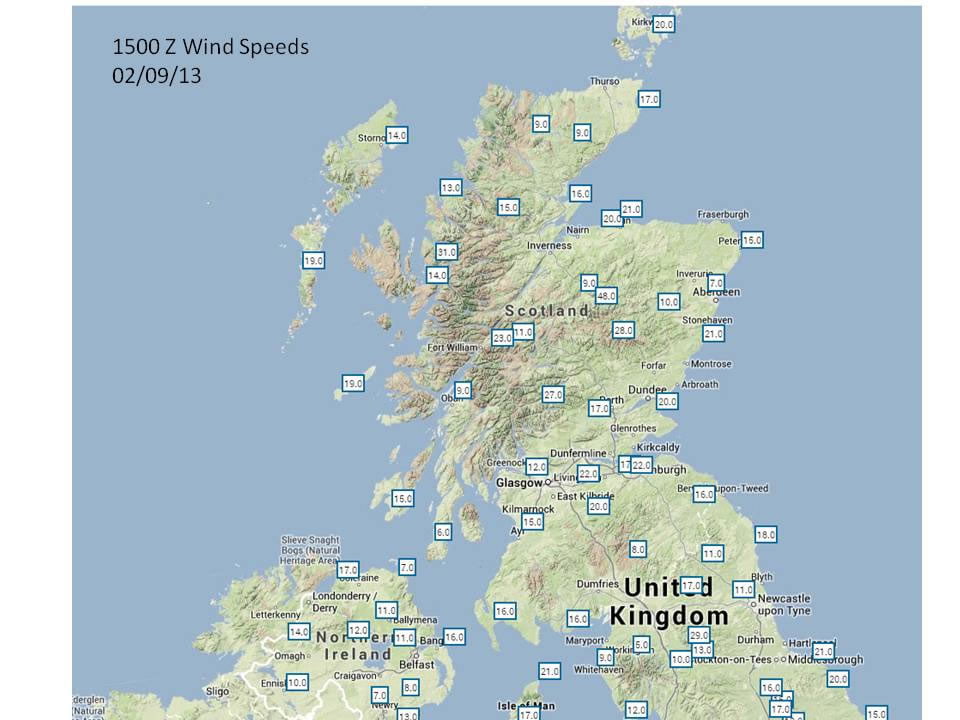
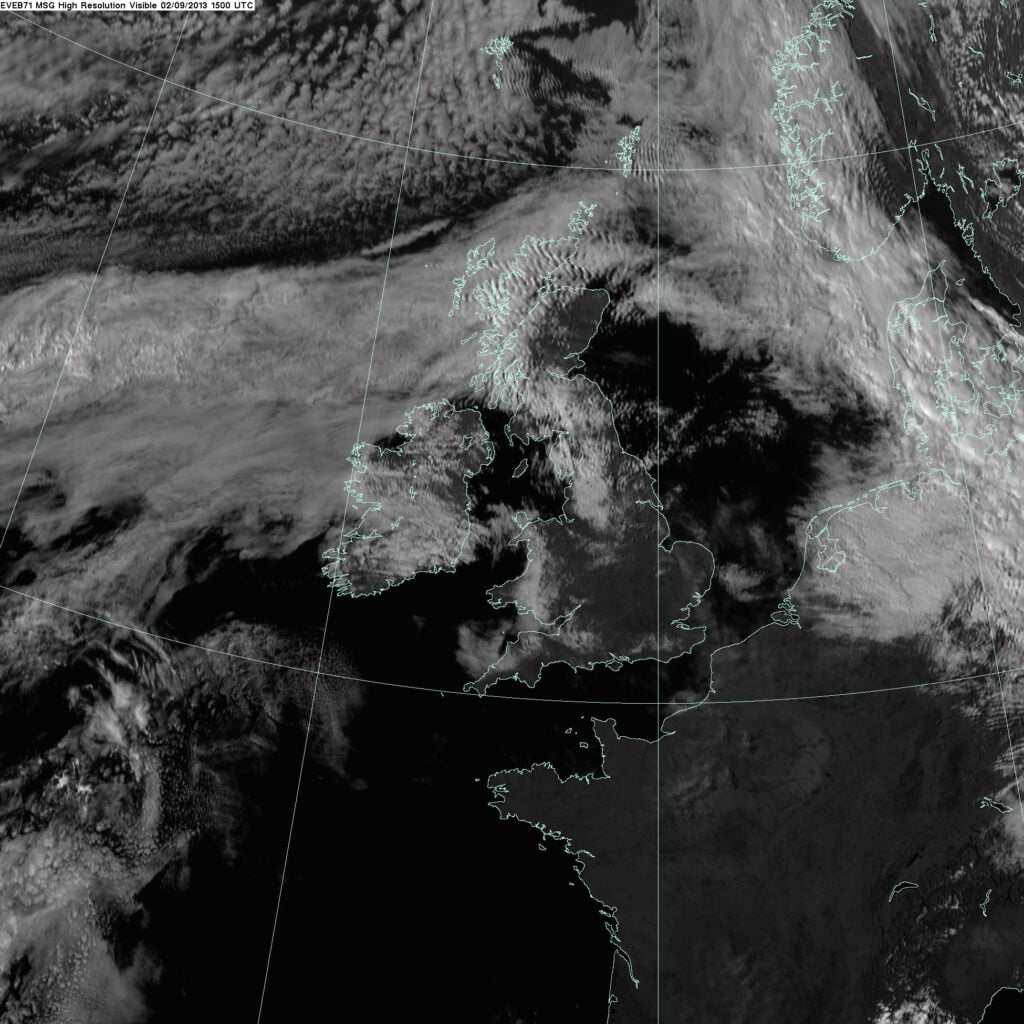
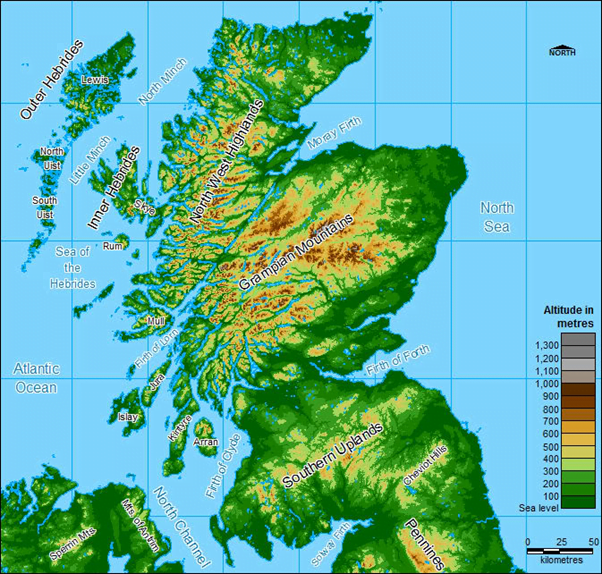
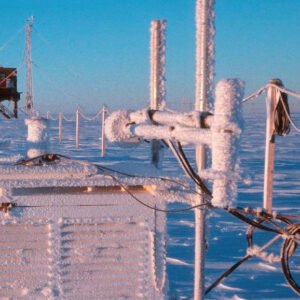
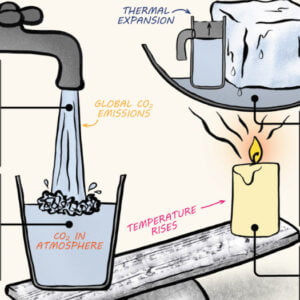
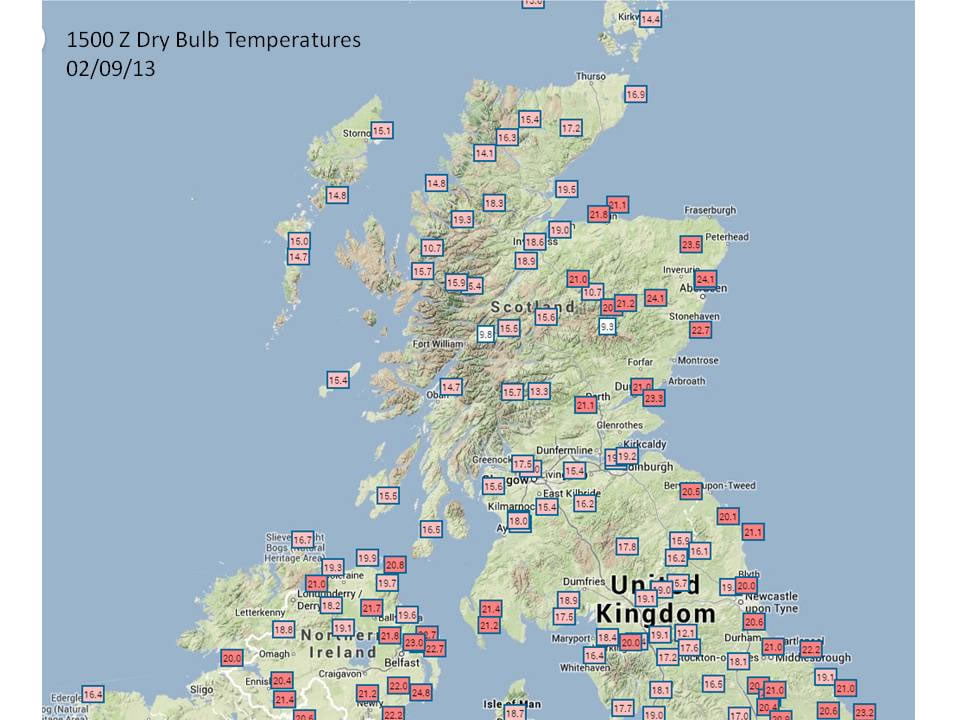
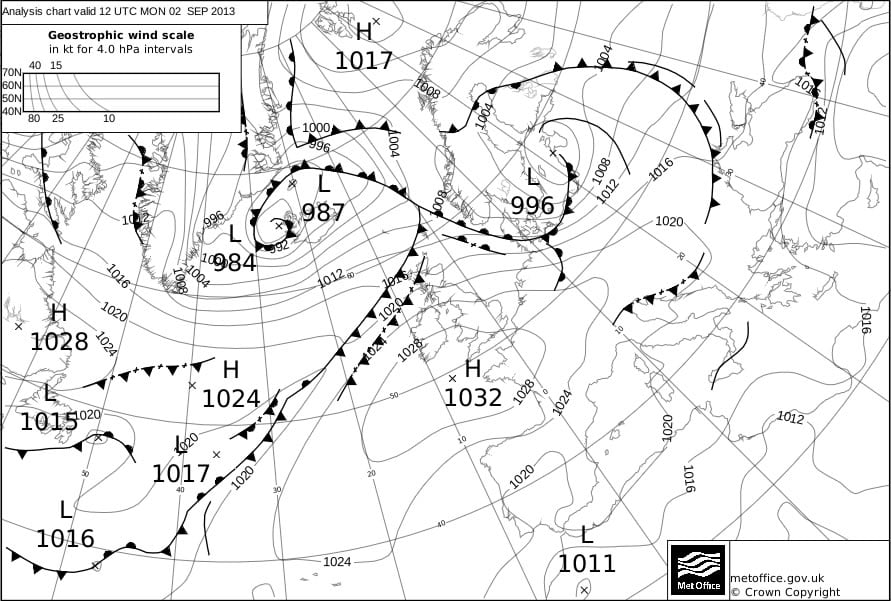
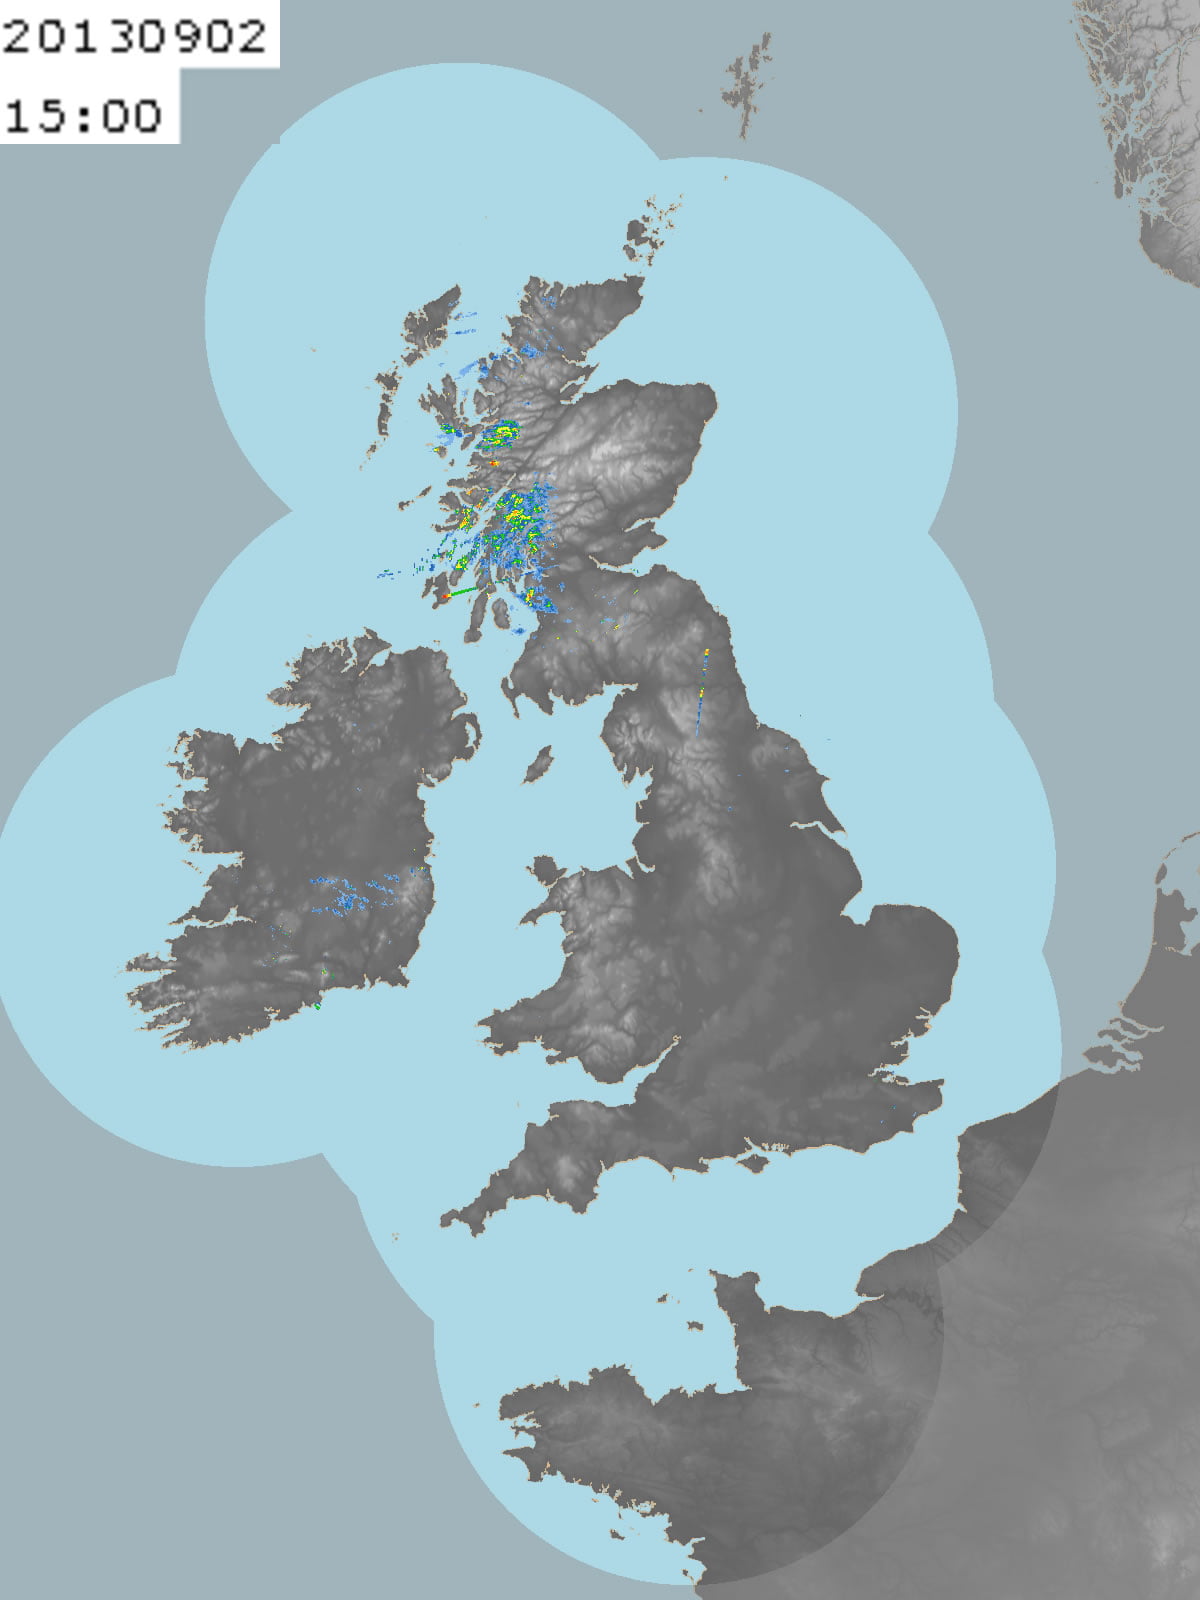