The 30th United Nations Climate Change Conference, or Conference of the Parties of the UNFCCC, COP30, will be taking place in Brazil this year.
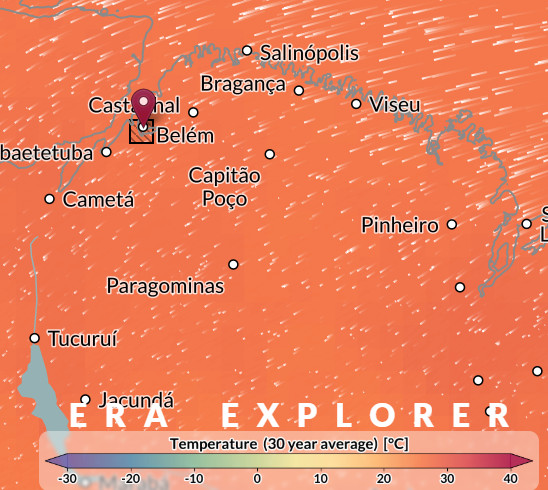
So, let’s take the opportunity to use ERA explorer data to look at the difference between climate and weather and why we usually use a 30-year averaging period to define the climate of a particular place.
Specifically, students will
- Look at the mean, mode and median of a 30-year data set and critically consider which is the most appropriate average
- Look at the difference between 10, 20 and 30-year means and critically consider which is the most appropriate definition of the climate.
Excel spreadsheet with the original ERA explorer data