Severe Storms

Including hail, downdraughts and cloudbursts

hailstructureIt was reported in The Times newspaper on 15 April 1986 that a hailstorm lashing Dhaka, the capital of Bangladesh, had killed nearly 50 people and injured more than 400. The storm had brought winds of about 60 mph and hailstones weighing up to 2 lb (nearly 1 kg). Houses had been flattened, communications disrupted and the windscreens of more than 700 cars shattered. In such conditions, an umbrella was no use whatsoever; even a riot shield may not have provided adequate protection! According to Dick File, in Weather Facts (Oxford University Press, 1991), this storm (which struck on 14 April 1986) killed 92 people and produced hailstones that weighed 1.02 kg.

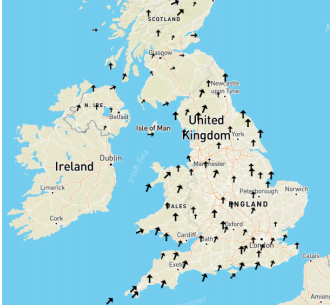
The heaviest hailstones to fall on the United Kingdom did so at Horsham, West Sussex, on 5 September 1958 and weighed 140 g. They were almost the size of a tennis ball. When they hit the ground, they were travelling at speeds in excess of 100 mph (50 m/s). If you find this surprising, do a little calculation, using the formula:
V2 = u2 + 2as where u is the initial speed, v the terminal speed, a the acceleration (in this case, due to gravity) and s the distance travelled. For a hailstone falling from a height of 500 m through still air, v = 100 m/s! The impact of a missile the size of a tennis ball travelling this fast is much more serious than that of a cricket ball hit for six.

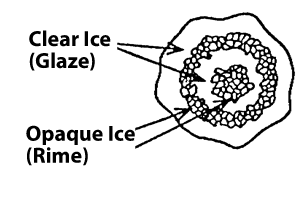
Should you ever get the chance, collect some large hailstones and cut them in half. You may find a layered structure, with alternate layers of clear and opaque ice (as in the picture on the right, which shows a section of a hailstone viewed by transmitted light). The layers are acquired in different parts of the storm clouds. As hailstones fall, they collect tiny water droplets, which flow around them and freeze. If no air is trapped, the ice is clear.

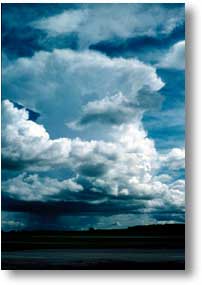
The storm which struck the Wokingham area of Berkshire on 9 July 1959 produced hailstones more than 2.5 cm in diameter. This storm was studied in detail by Professor Frank Ludlam of Imperial College and his team of co-workers, who produced a striking three-dimensional model of the airflow with-in the storm and explained how large multi-layered hailstones may form in such weather systems.

diagram of severe storm 3
This three-dimensional model is taken from a paper entitled Airflow in convective storms by K.A.Browning and F.H.Ludlam published in the April 1962 issue of the Quarterly Journal of the Royal Meteorological Society (Volume 88, pp.117-135).

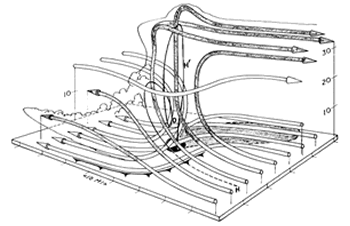
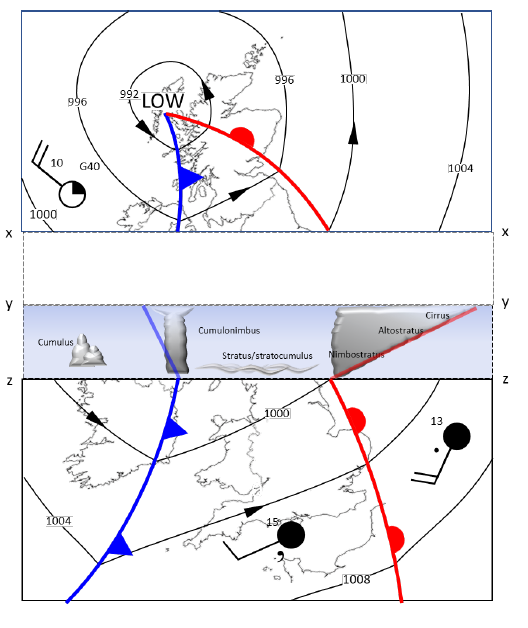
In the diagram on the right, streamlines of air in which condensation occurred are shaded. The surface areas affected by rain and hail are shown by, respectively, grey and black shading. Heights are shown in thousands of feet. Precipitation formed in air which entered the storm near position H. As shown, the precipitation was carried across relative to the storm to around 13-15,000 feet, whereupon it fell and re-entered the strong updraught near posit-ion O. Some precipitation particles reached altitu-des of 30,000 feet or more and grew into large hail-stones before falling again, forward of the strong updraught, near position H’. The storm moved from left to right, with rain on its left flank and a squally ‘gust front’ (shown as a cold front) on its right flank. Behind the storm, chilled air reached the ground.

severe storm diagram

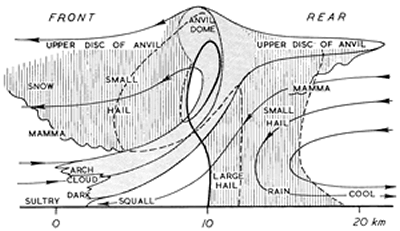
The diagram on the right shows a vertical section through a typical severe hailstorm (moving from right to left) and is also taken from Ludlam’s 1961 article in Weather. Compare this diagram with the three-dimensional model above

The paths of the air are drawn as if the storm was stationary. They are, therefore, relative streamlines. The dashed lines are trajectories of small hailstones. The thick full line shows the trajectory of a large hailstone.

To some extent, the features shown on this vertical section occur also in vigorous cumulo-nimbus systems which do not produce large hail. Students can look out for mamma, the udder-like cloud feature that hangs under the anvil and other parts of the cloud. How are mamma formed? Students can also observe gust fronts and measure the temperature drop that occurs when a storm passes. It is often several degrees Celsius. Perhaps, with the help of someone who has a car, they can map areas of rain and hail relative to moving storms.

severe storm diagram 2
This diagram has been taken from The microburst hazard to aircraft by J.McCarthy and R.J.Serafin, published in Weatherwise in 1984 (Volume 37, pp.120-127)

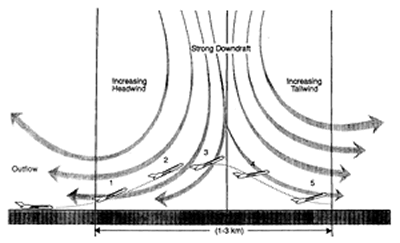
In severe storms, downdraughts may be as strong as 30-40 m/s and reach the ground as ‘down-bursts’. These are dangerous, as the diagram above shows. Downbursts spread out near the ground. An aeroplane that flies into such an outflow first encounters an increasing head-wind (at 1 and 2), which adds to the speed of the speed of the air flowing over the aircraft’s wings and thus increases lift. At 3, however, the strength of the downdraught begins to reduce the altitude of the aircraft; and at 4 and 5 the aircraft experiences both a tail-wind (which reduces air speed and lift) and a downward force from the downdraught. Over the years, there have been many air disasters caused this way, especially in North America.

Cloudbursts

On 15 August 1952, the village of Lynmouth in North Devon was devastated by a torrent of water which poured off Exmoor; 34 people died. On 29 May 1920, in and around the Lincolnshire town of Louth, 22 people died when water from a storm over the Wolds caused the River Lud, normally a small stream, to rise 5 m above its normal level. In Dorset and Somerset, there have been similar occurrences; and in all cases, severe storms caused the havoc. When such storms occur in the British Isles, the wind in the upper troposphere is typically from the south-west, with the wind in the lower troposphere from a north-easterly point (and pressure low to the south and south-west). If this flow is lifted orographically, the storm may become stationary and deposit several inches of rain in a short time. Thus, it is places below slopes that face northwards or north-eastwards that are most at risk.

Hail Prevention

To frighten away the evil spirits that caused hail, primitive tribes used to shoot arrows into storm clouds; and Christians have tried to exorcise these spirits by ringing church bells (a dangerous practice because of lightning strikes on bell towers). Not only arrows, but also cannon-balls, artillery shells and rockets have been fired into storm clouds, but all to no avail. Though there is some evidence that cloud seeding may help to reduce the size of hailstones, there is nothing we can yet do to prevent the formation of severe storms.

3D Print the Weather

The RMetS is delighted to have collaborated with CREATE Education to develop instructions to allow schools to 3D print sections of the Central England Temperature Record and use their models to learn about weather, climate, extreme weather and climate change.

These engaging, tactile resources allow students to get a hands-on experience of what climate is and how it can change, and how extreme weather relates to the climate.

The Central England Temperature (CET) data record is the longest instrument record of temperature in the world, with average monthly temperature each month from January 1659 to December 2018.

This project and the accompanying resources allow you to create 3D models that will represent 10 years of temperature data. The models have been designed to interlink, so students can create a series of models to represent larger timeframes. Once the 3D models have been created and 3D printed, there is a tactile resource that can be used in multiple ways in the classroom to visualise and study past weather and climate, and at how the climate of the UK has been changing over time.

The lesson resources specifically focus on

1. The difference between climate and weather

2. The current climate of the UK

3. The changing climate of the UK

4. Looking at past extreme weather events and researching their impacts on people in the UK.

3D model

Further resources to teach weather, climate, correlation, photosynthesis, regression, the carbon cycle, isotopes and more.

Further resources past climate change teaching resources for secondary geography.

Depressions – Identifying Features

Identify the weather features on the synoptic (weather) chart below:

Cold Front

Warm Front

Highest pressure

Depression

Anticyclone

Isobar

Occluded Front

Strong Wind

Light Wind

Lowest Pressure


Advanced

Northerly Wind

Northwesterly Wind

Southwesterly Wind


(hint the clouds in the images below are cirrus, cumulonimbus, cumulus and nimbostratus)

cirrus
cumulus
Cumulonimbus
synoptic chart extract

Pop-up Depression

Print, cut-out and fold along the lines to make a 3D model of a depression. 

pop up depression

Drawing Pressure and Temperature Contours (Intermediate)

Drawing Temperature and Pressure Contours

Lines of equal temperature – temperature contours, are called isotherms.

In this exercise, the task is to draw the 8.5°C, 6.5°C and 2.5°C isotherms. The 10.5°C and 4.5°C isotherms have already been drawn to help.

Start with the 8.5°C isotherm. This is the line which has everything warmer than 8.5°C on one side of it, and everything colder than 8.5°C on the other side. You could use a coloured pencil to colour in the dots for everywhere that is warmer than 8.5°C. Your isotherm is then the line which separates your coloured dots from the uncoloured ones.

Next, try the 2.5°C isotherm. For this, you could use a different colour to shade the dots for everywhere that is colder than 2.5°C.

Lastly, draw the 6.5°C isotherm. This will be very close to the 4.5°C isotherm in places, so be careful! To help with this, you could use a 3rd colour to shade the places where the temperature is 7 or 8°C, and a 4th colour to shade the places where the temperature is 5 or 6°C. Your line will divide the two.

Remember, contours can never touch or cross each other (it can’t be 8.5°C and 6.5°C at the same place!). The line should start and finish at an edge of the page.

Drawing of isotherms

Lines of equal pressure – pressure contours, are called isobars.

In this exercise, the task is to draw the 1016, 1012, 1008 and 1004mb isobars. However, to save space on the map, the pressure values have been recorded in shorthand – so 9 or 09 is short for 1009, 11 is short for 1011 etc.

On this map, we have some extra clues – these weather observations indicate the wind speed by the tail on the symbol. The wind is blowing from the tail of the arrow to the centre (the bars on the tail of the arrow tell you the wind speed) so –o is a wind blowing from the west to the east, or o—is a wind blowing from the east to the west. The wind tends to blow along the pressure contours, so your contours need to be roughly parallel to the tails on the closest weather symbols.

Start with the 1016mb contour. Where on the map are there places where the pressure is higher than that? If it helps, colour in those symbols where the value is greater than 16. Your pressure contour needs to divide those symbols from the others.

Now use a different colour to shade the symbols where the pressure value is 13, 14 or 15. Can you now draw the 1012mb isobar?

Again, use a different colour to shade the symbols where the pressure value is 9, 10 or 11. Can you now draw the 1008mbar contour?

Lastly, is there anywhere where the pressure is under 1004mb? If so, draw the 1004mb contour to separate off that observation from the others.

Drawing of isobars

These two maps both correspond to the same weather situation. Can you work out what is going on?

Clues:

– Where is the pressure lowest?

– How is the wind direction changing across the map?

– In general, where is the temperature lower and where is it higher?

– Where is the temperature changing most rapidly? Remember that a front is where cold and warm air meets. You can use the wind information on the second map to see where the cold air is pushing into the warm air (a cold front) or whether the warm air is pushing into cold air (a warm front).

Drawing Pressure and Temperature Contours (Harder)

Drawing Isobars

Isobars are lines of constant pressure. Drawing the isobars reveals features (eg highs, lows, ridges and troughs) which help us understand the weather.

When trying to draw isobars, remember the following

– You are trying to draw the isobars of pressure for the values below the
graph

– The symbols on the map give the observed pressure and wind speed and
direction. Remember that the wind is blowing from the tail of the arrow
to the centre. The bars on the tail of the arrow tell you the wind speed:

– The wind blows almost parallel to the isobars (they are usually blow
slightly more towards the centre of the low pressure area). If you stand
with your back to the wind in the northern hemisphere the pressure is
lower on your left than on your right.

– Isobars tend to be parallel to each other, don’t wiggle and never cross.

– The closer the isobars are to each other, the stronger the wind. You can
use the bars on the tail of the weather station symbol to give you the
Beaufort force of the wind. Look at the scale at the top of the map (this is
called the ‘geostrophic scale’). The distance from the left hand edge of
the scale to the force at the symbol gives you the spacing between 2mbar
isobars at that point.

Beaufort scale

Draw the 1004, 1008, 1012 and 1016 isobars (noting that they have been recorded in shorthand, such that 1004 becomes 04 etc.) remembering that the wind tends to blow parallel to the isobars. Can they see what sort of a weather system it is, and where the fronts might be?

Drawing of isobars

Draw the 2.5, 4.5, 6.5, 8.5 and 10.5 isotherms (lines of equal temperature), remembering that sometimes, if there isn’t any data in a particular place, you have to make an educated guess about what the contour might look like. Is it more obvious now what the structure of the weather system is?

Drawing of isotherms

Shade the areas of rain, heavy rain and drizzle in the map below. Is it more obvious now what the structure of the weather system is?Weather map

Eva – A Case Study of a Depression

A Case Study of a Weather System using WOW data

Go to the WOW website wow.metoffice.gov.uk

Use the pop up calendar to select 24th December 2015 and the drop down box to choose 0600 to 0659 in the morning.

Use the Layers menu on the right to select wind speed/ direction.

Use the Filters menu to select only official observations.Map of the UK showing wind direction

Where is the wind coming from?

Is the wind weak or strong?

Change the time to 0800-0859. How does the wind look now?

Change the time to 1200-1259. How does the wind look now?

Capture the image, stick it into a work book

NOW USE THE LAYERS MENU TO LOOK AT TEMPERATURE.

At 0600-0659, what are the temperatures across the U.K.? (You may need to click on some dots to work out exactly what the temperature is)

Capture the image, stick it into a work book at draw a line roughly dividing colder and warmer temperatures. What is a line dividing cold and warm temperatures called?

Now look at the temperature between 0800-0859. What is the pattern of temperatures?

Now look at the temperature between 1200-1259. What is the pattern of temperatures?

Capture the image, stick it into a work book at draw a line dividing colder and warmer temperatures.

Now compare this image and the line you have drawn on it with the wind image you captured earlier. What do you notice?

CHALLENGE YOURSELF:

Find the Met Office Weather Station in Glasgow/ Bishopton, and click on it. Click on ‘View Full Observation’ and use the Graph view and the calendars to select from
23/12/15 to 25/12/15. How does the air temperature change?

NOW USE THE LAYERS MENU TO SELECT RAINFALL RATE AT 0600-0659

You’ll also need to add ‘WOW observations’ from the Filter menu because the official observations don’t include rainfall. Where is it raining?

Go back in time, hour by hour, what happens to where the rain is?

NOW USE THE LAYERS MENU TO SELECT ‘PRESSURE’.

Investigate how that changes through the day.

CHALLENGE YOURSELF:

Find the Met Office Weather Station in Glasgow/ Bishopton again, and click on it. Click on ‘View Full Observation’ and use the Graph view and the calendars to select from 23/12/15 to 25/12/15. How does the mean sea level pressure change?

CHALLENGE YOURSELF:

Capture the pressure image from 1200-1259 on 24th December 2015.
Can you sketch pressure contours for 992, 996, 1000, 1004, 1008 and 1012hPa?

Summarise what you think is going on with the weather on the 24th December 2015.

Red Sky – Teachers

Red Sky at Night, Shepherd’s Delight

“Red sky at night, shepherd’s delight. Red sky in the morning, shepherd’s warning” (or sailors rather than shepherds, depending on where in the country you are).

Is there any truth in this saying and, if so, why?


COMMON MISCONCEPTION: SOMETIMES THERE IS CONFUSION ABOUT THIS SAYING. IT IS TRUE THAT WHEN THE AIR IS ‘DIRTY’ – EITHER WITH POLLUTANTS FROM INDUSTRY, VEHICLES ETC OR WITH VOLCANIC ASH, SUNSETS AND SUNRISES TEND TO BE MORE SPECTACULAR. THESE CONDITIONS ARE ENHANCED BY HIGH PRESSURE, WHICH WE ASSOCIATE WITH CLEAR SKIES AND THEREFORE WARM, SUNNY WEATHER IN THE SUMMER, COLD, CRISP WEATHER IN THE WINTER (AND GLOOMY OVERCAST WEATHER IN THE LATE WINTER AND SPRING). HOWEVER, THIS IS NOT THE EXPLANATION OF THIS SAYING, BECAUSE HIGH PRESSURE TENDS TO LAST FOR SEVERAL DAYS.


You can find the Students’ Worksheet here.

Low pressure weather systems (depressions) bring us rain, strong winds and sometimes snow on high ground. Sometimes, they also bring thunder, lightning and even tornadoes to the UK. Neither shepherds nor sailors like this sort of weather.

1) Red sky at night

Imagine you are standing on the ground with the Sun setting (remember the Sun rises in the east and sets in the west).

Diagram red sky

Our weather tends to come from the west. Let’s consider a weather system which has already passed us first, moving from west to east – the diagram shows the clouds associated with the weather system and the direction they are moving.

The wiggly red lines represent the Sun’s light – if the light can reach you, then you can see the Sun. At sunset and sunrise the Sun appears red.

a) Looking at the diagram, are you going to be able to see the sunset? ___Yes______________

b) Why? _Light can get from the Sun to you_____________

Light is reflected by the water droplets in a cloud. This means that some of the light heading towards the cloud is reflected back in the direction it came from. If this light can reach you, then you’ll see the cloud lit up by the setting Sun.

c) Looking at the diagram, are you going see the cloud lit up by the setting Sun? ___Yes____________

d) Why? ____The sunlight will reflect back from the cloud to you______

e) Shade the side of the cloud which will appear red.

Now consider a weather system which hasn’t reached us yet:

Diagram of weather system that has not reached us yet

f) Looking at the diagram, are you going to be able to see the sunset? ____No______________

g) Why? __The cloud is in the way – sunlight can’t reach you________

h) Looking at the diagram, are you going see the cloud lit up by the setting Sun? ___No_____

i) Why? ___The side of the cloud lid up by the Sun is on the further side, which you cant see.____

j) Shade the side of the cloud which will appear red.

Weather systems are usually a few days apart – if a weather system has just passed us, we probably won’t get another one the same day. If a weather system is in sight, it will probably bring bad weather to us shortly.

In your own words, explain how these diagrams explain “red sky at night, shepherd’s delight”.

__If a storm has just passed, you’ll be able to see the sunset and the cloud illuminated by the sun, giving a red sky. If a storm has just passed, it’s unlikely that there will be another one tomorrow, so the weather is likely to be good. On the other hand, if you can’t see the setting sun or the illuminated side of the cloud, the sky won’t look red at sunset – this is the case when the cloud from an approaching storm is between you and the Sun, and bad weather is on the way.___

Red Sky Worksheet

“Red sky at night, shepherd’s delight. Red sky in the morning, shepherd’s warning” (or sailors rather than shepherds, depending on where in the country you are).

Is there any truth in this saying and, if so, why?

Low pressure weather systems (depressions) bring us rain, strong winds and sometimes snow on high ground. Sometimes, they also bring thunder, lightning and even tornadoes to the UK. Neither shepherds nor sailors like this sort of weather.

1) Red sky at night

Imagine you are standing on the ground with the Sun setting (remember the Sun rises in the east and sets in the west).

Red sky and weather systems

Our weather tends to come from the west. Let’s consider a weather system which has already passed us first, moving from west to east – the diagram shows the clouds associated with the weather system and the direction they are moving.

The wiggly red lines represent the Sun’s light – if the light can reach you, then you can see the Sun. At sunset and sunrise the Sun appears red.

a) Looking at the diagram, are you going to be able to see the sunset? ______________________

b) Why? ____________________________________________________

Light is reflected by the water droplets in a cloud. This means that some of the light heading towards the cloud is reflected back in the direction it came from. If this light can reach you, then you’ll see the cloud lit up by the setting Sun.

c) Looking at the diagram, are you going see the cloud lit up by the setting Sun? _______________

d) Why? ____________________________________________________

e) Shade the side of the cloud which will appear red.

Now consider a weather system which hasn’t reached us yet:

Weather system that has not reached us yet

f) Looking at the diagram, are you going to be able to see the sunset?


g) Why?


h) Looking at the diagram, are you going see the cloud lit up by the setting Sun?


i) Why?


j) Shade the side of the cloud which will appear red.

Weather systems are usually a few days apart – if a weather system has just passed us, we probably won’t get another one the same day. If a weather system is in sight, it will probably bring bad weather to us shortly.

k) In your own words, explain how these diagrams explain “red sky at night, shepherd’s delight”.


2) Red sky in the morning

Going through the same thinking as above, complete the following diagrams to show

a) A Sunrise with a weather system which has already gone passed us.

– First draw the Sun rising in the East

– Next draw the cloud and the arrow showing which way it is moving

– Next draw lines showing light coming from the Sun and reflecting from the cloud.Diagram for drawing on

b) A Sunrise with a weather system which is about to reach us.

– First draw the Sun rising in the East

– Next draw the cloud

– Next draw lines showing light coming from the Sun and reflecting from the cloud.Second diagram for drawing on

In your own words, explain how these diagrams explain “red sky in the morning, shepherd’s warning”.


Tropical Cyclone Challenge

MetLink - Royal Meteorological Society
We use cookies on this site to enhance your user experienceBy clicking any link on this page you are giving your consent for us to set cookies. More info

By clicking any link on this page you are giving your consent for us to set cookies. More info