
Image copyright biodiversitystripes.info and LPI 2024 (www.livingplanetindex.org)
The Kelp Forest Initiative – Teachers Guide
CURRICULUM LINKS
- Using a variety of concepts and models to develop scientific explanations and understanding
- Explaining everyday and technological applications of science; evaluating associated personal, social, economic and environmental implications;
- Making decisions based on the evaluation of evidence and arguments
positive and negative human interactions with ecosystems.
STAGE RUNNING NOTES
Starter: Engage with the task for the lesson
Slide 2: The learning objectives for this lesson.
Slide 3: Introduce the scenario and the Earthshot Prize by clicking on the link to watch a short video (see weblinks below).
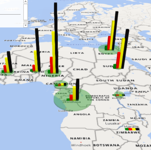
Slide 4: Ask students to discuss in pairs what the diagram shows and ask for feedback. You might like to ask students if they think this is a good way of showing climate data and why. You can visit https://showyourstripes.info/ where there are other options for showing the same data e.g. as a bar chart.
Main Students interpret scientific diagrams
Slide 6: Give each student a copy of Student sheet 1 – the application form for the Earthshot idea. Tell them that they will be filling it in throughout the lesson and ask them to quickly read it so they know what information they will need. Tell them that they are going to fill in the first two sections using scientific diagrams.
Students use results from an experiment to collect evidence for the idea
Student pairs/groups will study beakers of algal balls in hydrogencarbonate indicator, use a colour chart and work out what the results show.
The beakers need to be set up by the technician beforehand (see technician notes below) as it takes a minimum of 40 minutes to see a change.
They will set up 4 vials of hydrogencarbonate indicator – one containing no algal balls, one with 5 balls, one with 10 balls and one with 15 balls and leave exposed to a bright light so the algae can photosynthesise and use the dissolved carbon dioxide.
If you are unable to run the experiment, show the film of it: https://www.youtube.com/watch?v=fI3x68CkKW0
Ask students to use the results to fill in section 3 of Student sheet 1.
Students use information to explain how kelp forests can increase biodiversity
Slides 10-11: Show the students the chart and ask them to discuss in pairs what it shows. Listen to feedback from pairs.
Slide 12: Reveal that the chart shows that the number of different species on Earth – its biodiversity is decreasing because many species have gone extinct. Ask the students to use the information on Student sheet 4 to decide how planting more kelp can help increase biodiversity in the oceans and fill in section 4 of Student sheet 1.
Action: Students provide feedback on the Earthshot idea
Check student understanding by asking individuals for one sentence answers on:
• How planting more kelp can help reduce global warming.
• How planting more kelp can increase biodiversity.
They should be encouraged to not repeat a point made by another student.
Ask students’ opinions on whether they think their Earthshot idea has a chance of winning the prize and why.
WEBLINKS
YouTube video that shows a diver exploring a UK kelp forest:
Climate stripes https://showyourstripes.info/
Biodiversity stripes https://biodiversitystripes.info/global
Reliable sources about kelp:
NOAA (National Oceanic and Atmospheric Administration): https://www.climate.gov/news-features/understanding-climate/understanding-blue-carbon
BBC: https://www.youtube.com/watch?v=3gmTAG-rose
The National Geographic: https://www.nationalgeographic.com/environment/article/seaweed-fastest-least-expensive-tool-climate-change
NCBE-SAPS photosynthesis kit https://www.ncbe.reading.ac.uk/photosynthesis-kit/
TECHNICIAN GUIDE:
The algal ball experiment
To prepare the algal balls see: www.saps.org.uk/teaching-resources/resources/235/algal-balls-photosynthesis-using-algae-wrapped-in-jelly-balls/
Bubble air through the hydrogencarbonate indicator with atmospheric carbon dioxide. The solution is ready to use when it’s a deep red colour.
For each group set up 4 small bottles of prepared hydrogencarbonate indicator – one containing no algal balls, one with no balls (control), 5 balls, one with 10 balls and one with 15 balls and leave exposed to a bright light at least one hour before the lesson so there is a distinct colour change in each bottle.

Related Resources...
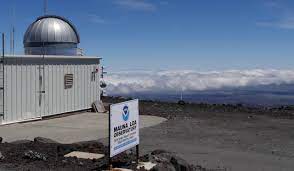
Carbon Dioxide – Seasonal Cycles
Exploring the link between photosynthesis and seasonal cycles in atmospheric carbon dioxide concentration

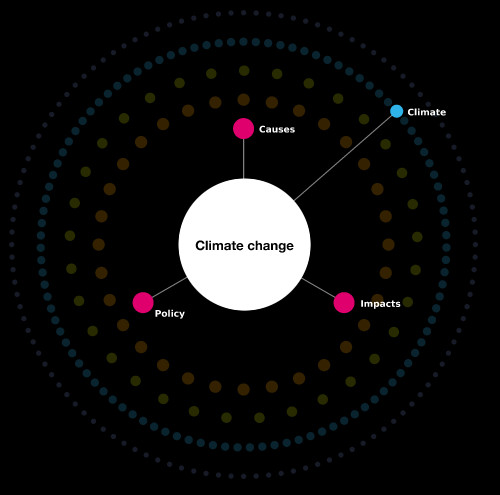
Climate Change and Biodiversity
Exploring the links between biodiversity and climate change.


