


An exam style question suitable for GCSE science.
The units for the data are in fact ppmv which we have simplified to ‘parts per million’ for this question.
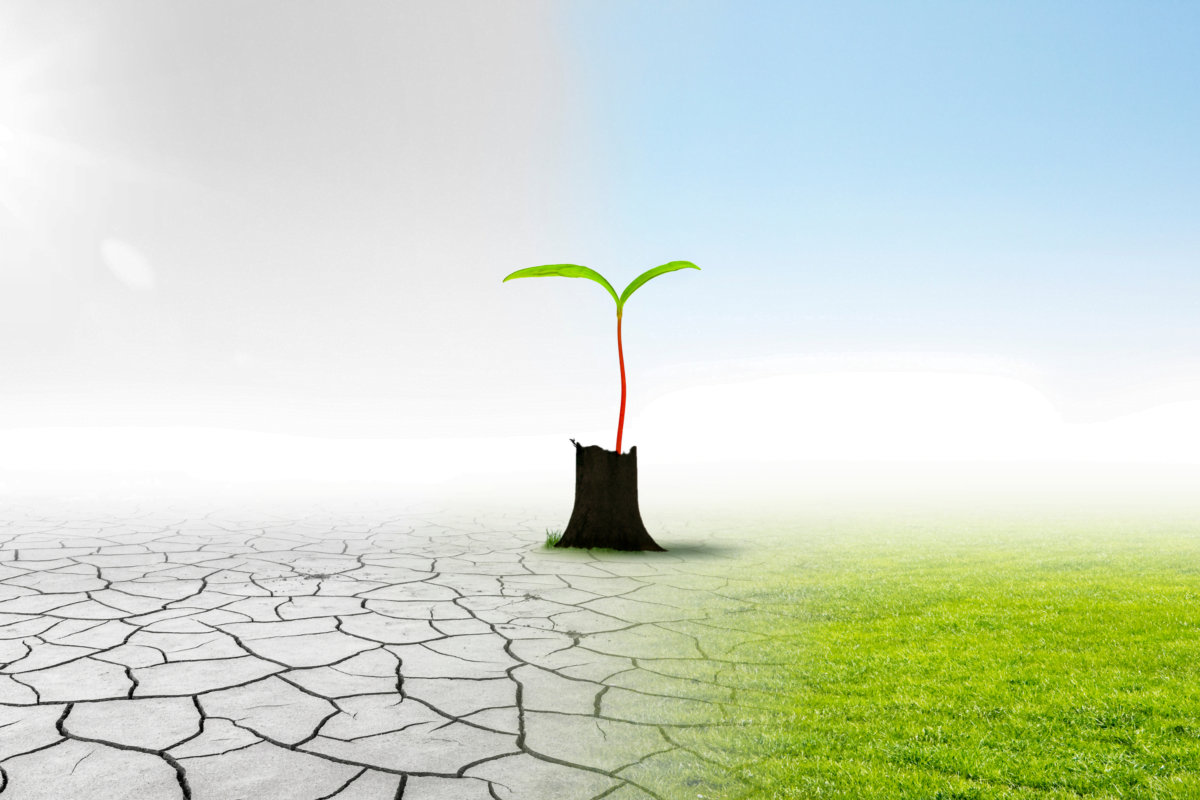
This is a nice visualisation of what 420ppmv looks like.
The questions explore the fact that there is a seasonal cycle in carbon dioxide in the atmosphere because plants take up carbon dioxide during photosynthesis in the spring and summer, which is then released back into the atmosphere when plants die and leaves rot in the autumn and winter.
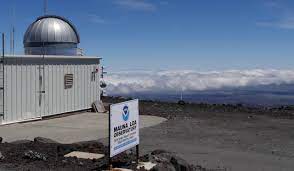
Carbon dioxide is a well mixed gas, meaning that the data recorded at Mauna Loa is representative of the Northern Hemisphere, and that at the South Pole is representative of the Southern Hemisphere.
The seasons are out of phase with each other – when it is summer in the Southern Hemisphere, it is winter in the Northern Hemisphere.
As there is far less vegetation in the Southern Hemisphere than in the Northern Hemisphere, the seasonal cycle is much smaller.
Students may notice that there could also be a human element to the cycle – we burn more fossil fuels in the winter than in the summer (and there are also fewer people in the Southern Hemisphere).
The correct answer for the mean is 416.1 parts per million.
As well as the seasonal cycle, the graph provided shows the increase in atmospheric carbon dioxide since 1958. This increase is because of the emissions of carbon dioxide by human activities including land use change including deforestation, burning fossil fuels and cement production.
https://scrippsco2.ucsd.edu/data/atmospheric_co2/spo.html
https://gml.noaa.gov/webdata/ccgg/trends/co2/co2_mm_mlo.txt
https://climate.nasa.gov/vital-signs/carbon-dioxide/
NOAA/ Susan Cobb
A classroom resource where students submit an (imaginary) application outlining a plan to reduce global warming and increase biodiversity by replanting kelp forests.
Climate Change and Biodiversity
Exploring the links between biodiversity and climate change.
Resource produced in collaboration with MEI
This resource comprises several stand-alone activities which may be used separately.
Brief overview of session ‘logic’
Mathematical opportunities offered
Download the resources
Resource produced in collaboration with MEI
Brief overview of session ‘logic’
Mathematical opportunities offered
Download the resources
Resource produced in collaboration with MEI
Brief overview of session ‘logic’
Mathematical opportunities offered
Download the resources
Resource produced in collaboration with MEI
Brief overview of session ‘logic’
Mathematical opportunities offered
Download the resources

In this experiment the students will look at the effect of Particulate matter or other substances that have landed on ice and test how this can speed up the melting of ice by affecting its albedo. Particulate Matter and aerosols are made up of a variety of pollutants, some of them enhancing and some counteracting the greenhouse effect when they are in the atmosphere. But once they land on snow or ice, they will promote the melting of these surfaces.
9.2.3. Properties and effects of atmospheric pollutants
Particulate Matter is a pollutant that absorbs at many different wavelengths, some act as greenhouse gases and others actually reflect more light than they absorb, leading to a reduction in the temperature of the atmosphere. When they (or Black Carbon in particular) deposit on snow and glaciers, they change the albedo (the reflectivity) of the snow surface. This controls the heat balance at the surface of snow and ice surfaces as the darker colour of the ice will lead to it melting faster.
Particulate Matter is solid particles that are so small that they float in the atmosphere and can be measured as a concentration in the atmosphere. They are formed from incomplete combustion of wood and fossil fuels. PM smaller than 2.5 microns (2.5 x 10⁻⁹ m), PM2.5 , is much smaller than the width of a human hair and can enter into our lungs and be carried into the blood system and cause damage to the brain and the cardiovascular system.
Uncertainties to do with the quantities of the different particles in the atmosphere (and the fact that particles enhance cloud formation) are part of the biggest current uncertainty in climate models.
This experiment can be carried out in pairs or larger groups and takes about 20 minutes.
Follow the notes in the student worksheet, allowing more time to discuss what particulate matter is, what is albedo and how sunlight is absorbed differently by different coloured substances.
Application to the World’s Glaciers:
Glaciers around the world are more exposed to particulate matter now than they ever were before the industrial revolution and the increase in industry and cars over the last century. Covering snow and ice with a dark layer changes the albedo and they absorb more heat and melt quicker than the pure ice.
Particulates are tiny solid or liquid particles that are present in the atmosphere. They are sometimes termed aerosols when they float in the air. Examples are dust, spores and pollen, salt from sea spray, volcanic ash and smoke. Black carbon (elemental carbon (soot) or organic carbon) from incomplete combustion in the atmosphere can actually absorb incoming solar radiation and cool the Earth. However, when these particles land on ice, the absorption of radiation will enhance the ice´s melting.
Iain Stewart BBC black ice experiment
UN Environment programme, 2019: Glaciers are melting and air pollution is the cause
See bar chart of radiative forcing of various gases or particulates in Fig 14.4 Ramaswami et al., 2019
Increased CO2 levels in the atmosphere are buffered by the oceans, as they absorb roughly 30 % of this CO2. The negative consequences of this are that the oceans become more acidic. The CO2 reacts with water and carbonate to form carbonic acid, reducing the available carbonate that shellfish, crabs and corals combine with calcium to make hard shells and skeletons.
Chemicals | Apparatus |
Bicarbonate of soda (1/2 teaspoon) | 2 x 500 ml Beakers |
White vinegar (1 teaspoon) | Small plastic or paper cup (100 ml) |
Indicator: Bromothymol blue (Diluted with water: 8 ml bromothymol blue (0.04% aqueous) to 1 litre of water) | Masking tape |
2 x Petri dishes or lid for large beakers | |
Safety glasses and lab coat | |
Teaspoon or 5 ml measuring cylinder | |
Two sheets of white paper |
Corals and shellfish can be affected by ocean acidification, making it harder to create their shells, which will affect other fish up through the food web.
Corals and fish can be affected by slight changes in the temperature of the water and the next experiment also shows the effect of temperature increase on CO2 absorption, creating a positive feedback, a knock-on effect.
If the oceans are absorbing large quantities of carbon, and if we know the oceans are warming due to global warming, what is the effect of warmer oceans on CO2 absorption? Let´s check with this experiment that shows how much CO2 will dissolve in the water and how much will be in its gaseous form above the water.cr
|
Chemicals |
Apparatus |
|
Water |
2 x 500 ml measuring cylinders |
|
Effervescent fizz tablets (e.g. Alka Seltzer) |
2 x Petri dishes that fit over the cylinders |
|
Ice (optional) |
Bowl or container of at least 5 litres |
|
Stand and clamp to hold cylinders |
|
|
Water heater |
|
|
Funnel (optional) |
Experiment number | WARM water (volume of air/ml) | Experiment number | COLD water (volume of air/ml) |
1 |
| 1 |
|
2 |
| 2 |
|
3 |
| 3 |
|
4 |
| 4 |
|
AVERAGE volume |
| AVERAGE volume |
|
Question: Does more CO2 escape from warm or cold water?
If more has escaped from the liquid, the water cannot absorb as much CO2.
Extension Question: With global warming and warmer oceans, will the oceans be able to absorb more or less CO2 than before?
What is the perfect pH of the oceans? Is it different depending on which ocean and whether it is in the deep ocean or the shallower coastal areas?
Increased CO2 levels in the atmosphere are buffered by the oceans, as they absorb roughly 30 % of this CO2. The negative consequences of this are that the oceans become more acidic. The CO2 reacts with water and carbonate to form carbonic acid, reducing the available carbonate that shellfish, crabs and corals combine with calcium to make hard shells and skeletons.
4.2.4 The pH scale
9.1.2 The Earth´s early atmosphere
9.2.3. Global climate change
Na2CO3 + 2 CH3COOH → 2 CH3COONa + CO2 + H2O (Bicarbonate of soda reacts with vinegar to form carbon dioxide)
In this experiment the students will initiate a reaction that produces CO2 in an enclosed water-air environment. The CO2 formed will be absorbed into the water, making it more acidic and changing the colour of the indicator. The experiment can be carried out in pairs and takes about 15 minutes. An additional experiment to test the solubility of CO2 in warm and cold water can be carried out afterwards, explaining how global warming can affect marine CO2 absorption.
See the student worksheets for the detailed preparation: Ocean acidification and CO2 Absorption
The beaker is like an enclosed ocean-atmosphere and the CO2 from the reaction will equilibrate between the water and the air. Our oceans absorb more CO2 when the concentration in the atmosphere increases. But how much CO2 can they keep absorbing? Will they reach a saturation point?
Corals and shellfish are affected by ocean acidification, making it harder to create their shells, which will affect other fish up through the food web. Global warming caused by the increased CO2 effects the corals and fish as only slight changes in the temperature of the water can have effects throughout the ocean´s food chain. So there is a knock-on effect or a positive-feedback from the ocean heating and the ocean acidification.
If you want to illustrate more about the feedbacks and this double impact, the next experiment demonstrates the effect of a temperature increase on CO2 absorption, thus limiting the water´s capacity to absorb as much CO2.
This experiment allows students to determine how much CO2 dissolves in warm or cold water.
See the student worksheet for the detailed preparation.
Application to the World’s Oceans:
More CO2 has escaped from the warm water, showing that it cannot absorb as much CO2. Warmer oceans will not be as effective buffers at removing CO2 from the atmosphere. However, this phenomenon does prevent these warmer oceans from being as acidic.
Have a look at these two glaciers, one has fresh snow over the glacier and the other is a dry glacier in summer with accumulated deposits of dust and Black Carbon from air pollution. Which one do you think is more vulnerable to melting? Does a bright white surface reflect more or less light than a darkened surface?

Fresh clean snow on the Silvretta glacier, Switzerland (Zoë Fleming)

Dirty ice on the Fox Glacier, New Zealand (Sylvia Knight)
Particulate Matter is solid particles that are so small that they float in the atmosphere. They are formed from incomplete combustion of wood and fossil fuels. When they are smaller than 2.5 microns (2.5 x 10⁻⁹ m, an eight the width of a human hair), this PM2.5 can enter into our lungs and be carried into the blood system and cause damage to the brain and the cardiovascular system.
When Particulate Matter (or Black Carbon, which is more or less soot or pure Carbon) settles on glaciers and snow it darkens the colour of the snow and hence changes the how much of the Sun’s light the snow reflects. In this experiment we will check to see whether dirty or clean ice melts faster.
Chemicals | Apparatus |
3 ice cubes per group | 3 bowls for placing ice cubes |
Soot or Activated Carbon or burn a splint and gather the blackened combusted material | Spotlight |
Soil or sand (as light coloured as possible) | Measuring scale |
| Spoon or forceps to move the ice cube between the bowl and the measuring scale |
Application for the world’s glaciers:
Glaciers around the world are more exposed to particulate matter now than they ever were before the industrial revolution. Covering them with a dark material changes the albedo. The darker the surface, the more of the Sun’s light is absorbed by the glacier, warming it and melting it.
Particulates are tiny solid or liquid particles that are present in the atmosphere. They are sometimes termed aerosols as they float in the air. Black carbon (soot) is a particulate released from incomplete combustion. It absorbs the Sun’s light, which actually helps to cool the Earth. However, when it lands on ice, the absorption of radiation speeds up the ice´s melting as the light is absorbed by the dark colour and heats up the ice.
Social and political perspectives:
Knowing that air pollution that reaches glaciers is increasing their melting faster than what would happen from air temperature changes alone, what do you think we can do in terms of laws or behaviour change?
How can we reduce soot and Black Carbon reaching glaciers? Emission control of cars? Banning domestic wood-burning? Have you heard of smokeless coal that can be used in stoves in smoke-free zones? And pellet stoves, are there fewer emissions from these?
Note: You could carry out your own experiment if you are lucky enough to get snow. Prepare two neat snow blocks or two snow-balls of similar size and cover one with gravel or sand and leave the other clean. Watch which one melts first.
© 2024 Royal Meteorological Society
RMetS is a registered charity No. 208222