Mountain Environments

The mountain environment and weather data

Key Stage 2 Geography
How does the weather compare in each of these places?


Overview

This series of lessons aims to use a cross-curricular approach to geography and mathematics, to extend children’s knowledge of mountain environments, and their skills in collecting, presenting and interpreting data.

In activity one the children use a range of secondary resources, including the internet, to collect the latest weather data for three mountain environments, using worksheet 1 to record findings.

Activity two focuses more closely on climates. Climate slides can be used to introduce the main activity which is an investigation using the internet to find climate averages for the past 30 years. Children collect and present data as bar graphs and interpret their findings in terms of similarities and differences between places using differentiated worksheets.


Objectives

Children should learn:

about weather patterns in different parts of the world
to use secondary sources
to use ICT to access information

Lesson plans

Activity one

Collecting weather data using the internet
Children work in groups to collect weather data for three mountain localities related to their studies earlier in this unit.
They will need to use the internet to collect the data which, if possible, should be from that day’s latest weather reports.

Worksheet 1 can be used to record their findings.

Plenary
Groups can share their findings and discuss similarities and differences in weather between localities.

Note: When the latest weather data for a specific location is not available, children can use atlases to find the nearest towns and cities for which the latest weather data is available.

Lesson resources

PDF document containing photos of mountain localities being studied.

PDF document containing worksheet comparing latest weather data.

You will need:
Atlases
Internet access for groups
latest UK weather forecast.

Activity two

Comparing mountain climates
Using slide 1 as a starting point, ask the children to imagine they are going to visit the places in the photographs and that they need to think about the clothes they need to pack for each of the locations. Children can work in pairs to describe types of weather they might experience at low and high altitudes and make notes.

Allow time for children to share their ideas and discuss any questions arising from the exercise.

Using slides 3 to 10 introduce the class to climates and encourage children to think about factors that affect climate in different parts of the world.

Split the class into ability groups and introduce investigation task. Ensure each group investigates a different locality. Use worksheets 2, 3 and 4 to record data and plot graphs.

Plenary
Allow each group to present their findings and discuss with the children the similarities and differences between the weather in each of the mountain environments.

Compare bar graphs of rainfall for the different mountain environments and ask the question ‘is the driest time to go on holiday the same in all these places?’

Mountain climates slideshow- PDF document containing a set of slides for use with activity 2.

You will need:
Internet access for groups.

PDF document containing worksheet on Kathmandu (Low ability)

PDF document containing worksheet on Capel Curig (Middle ability)

PDF document containing worksheet on Cusco (High ability)

PDF document containing worksheet for any location within the UK

Link to the World Weather Information Service for Cusco.

Link to the World Weather Information Service for Kathmandu.

Link to the Met Office mountain weather forecast for Snowdonia (Capel Curig).

Web page reproduced with the kind permission of the Met Office

Measuring Temperature; Keeping Warm

Keeping warm

Upper Primary Science, Geography and Maths
Using a thermometer

Overview

In activity one, children will be introduced to thermometers and their uses, and have the opportunity to practise taking temperature readings using thermometers with different scales. They will link the measurement of temperature to how hot or cold things are.

In activity two, children will take careful readings of outside temperature during the day and try to explain findings in terms of weather conditions. Only a short time is needed at hourly intervals to take the temperature readings throughout the day.

Objectives

Children should learn:

to use a thermometer to make careful measurements of temperature, using standard measures.
that temperature is a measure of how hot or cold things are and that something hot will cool down and something cold will warm up until it is the same temperature as its surroundings.
to explain temperature and temperature changes using scientific knowledge and understanding

Lesson plans

Activity one

Introduction to using thermometers
Using slides 1 and 2 the children discuss uses of thermometers and are taught how to handle thermometers safely. They are then given a selection of thermometers to handle and examine.

Teach the children how to read the thermometer scale using the thermometer ITP.

Activity
Have containers of water at different temperatures ready, positioned so that all the children will be able to take temperature readings during the activity. Tell the children they will be practicing taking temperature readings for each container of water and the empty container which will be at room temperature. Remind the children that care will be needed when measuring the temperature of very hot water. Children record their measurements using the measuring temperatures worksheet and note the time. They will take a second reading an hour later.

While waiting to take the second reading, use the rest of the slides to practice reading temperatures, discuss temperature as a measure of how hot or cold things are and predict what will happen to the temperature of the water in the containers (the water will cool down or warm up to reach room temperature).

This will be a good time to introduce activity two, using slides 9 and 10 in preparation for starting the activity at 9a.m. when planned.

Plenary
Ask the children to measure the temperatures again and complete the worksheet.

Lower ability groups will need support to take temperature readings and complete the worksheet.

Lesson resources

Using a thermometer slideshow

You will need:
Containers of water at different temperatures including below room temperature and an empty container at room temperature.

Measuring temperatures worksheet

Activity two

Measuring the outside temperature
Place a thermometer in a safe place outside in the shade, away from direct sunlight.

Children take temperature readings at every hour and record them, using graph with or without scale.

Plenary
When children have completed all readings and constructed their bar graphs, discuss the results and ask children questions about their findings.

Ask the following:

What was the temperature at 9am?
What was the temperature at playtime?
How did the temperature change during the day?
What was the warmest time of the day?
Can you explain why the temperature changes during the day?

You will need:

Slides 9 and 10 from using a thermometer slideshow (above)

Outside temperatures worksheet

Outside temperatures worksheet(without scale).

Web page reproduced with the kind permission of the Met Office

Handling Data and Measurements

Handling data and measurements

Key Stage 2 Mathematics
Handling data and measurements

Overview

Children measure the outside temperature at the same time on each day for a week. They use ICT to record the temperature each day, in a suitable data handling program. At the end of the week they use the program to display the results on a bar chart. They answer questions such as:

On which days was it warmer than 15 degrees?
What is the difference between the temperature on the hottest day and the temperature on the coldest day?

Objectives

Children should learn:

to read, to the nearest division and half-division, scales that are numbered or partially numbered. Use the information to measure and draw to a suitable degree of accuracy.
to answer a question by collecting, organising and interpreting data.
to use ICT to create a bar chart.

Lesson plans

Activity

Mental starter
Use slide 1 to ask questions about the temperature data.

Main teaching
Use the thermometer ITP, to teach the children how to measure temperature to the nearest degree.

Using slides 5–9 go through temperature, rainfall and wind speed measurements.

Tell the children they will be keeping a weather diary for one week and measuring the outside temperature at the same time every day.

If you have a weather station at school show them how to measure the wind speed and rainfall. Otherwise, show the children how to find the information using the latest weather data on the internet.

Demonstrate how to record the temperature each day in your chosen data handling program.

Lesson resources

Keeping a weather diary (Temperatures) slideshow.

Link to the Met Office latest weather forecast for the UK.

Main activity
Children measure the outside temperature in groups at the same time every day for one week and complete their individual weather diaries.

On the last day, when all the information has been collected, using ICT, children record the temperatures for the week in the chosen data handling program and use the information to display as a bar chart, which can then be printed.

Your own weather diary worksheet.

You will need:
Access to computers or laptops

Plenary
Using slides 10–14 ask the children to answer questions with the help of their bar charts. Can they think of any other questions to ask? What does the chart tell us about the weather during the week?

You will need:
Slides 10–14 of keeping a weather diary (Temperatures) slideshow (above)

Web page reproduced with the kind permission of the Met Office.

Poems and Songs

Poems and songs about the weather for children and schools

There are lots of songs and poems about the weather. Why not practise singing the ones here on this page? Or you could make up your very own song using your favourite weather words!!

TIPS: Tapping your fingers on a table sounds like raindrops, stamping your feet sounds like thunder, blowing sounds like the howling wind and you could even make shivery noises for the cold!!

Poems


Rain & Sun
Christina Rosetti


Wind
Christina Rosetti


Rain
Robert Louis Stephenson


Raindrops
Anon

Wind Poem 2
Wind Poem 2
Christina Rosetti

We also like the following poems by more recent poets – see if you can find them in a poetry book!

Anything from The Book of Clouds Juris Kronbergs
The More it Snows A.A. Milne
Snowflakes Helen Moore
Snow Alice Wilkins
Winter Ocean John Updike
Winter Morning Ogden Nash
It s never Fair Weather Ogden Nash
Fog Carl Sandburg
Winds light to disastrous Spike Milligan
Storm Roger McGough
Rain George MacBeth
Glass Falling Louis MacNeice
Clouds Aileen Fisher
The Fight of the Year Roger McGough

Floods

Flooding may result from a large amount of rain or from rapid thawing of snow and in coastal regions may also be caused by a storm surge or a combination of high tide and high river level. The consequences of flooding are often disastrous but there can also be beneficial effects of flooding.

Download Floods Fact File

Storm surges

Storm SurgeStorm surges are mainly caused by the effect of the wind on the sea, not changes in atmospheric pressure. The effect of wind on the sea surface is known as wind stress. The wind stress on the surface of the sea causes the water level on a coast to rise if the net transport of water is towards land and to fall if it is away from land.

Many coasts are at risk from storm surges and these include the Atlantic side of the United States, the Bay of Bengal area around India, Thailand and Indonesia, the coastal areas of the Netherlands and eastern England coastline. At the head of the Bay of Bengal large storm surges (up to 4m in height) are initiated by hurricane force winds coupled with low pressure tropical cyclone systems. Fortunately for the UK surges large enough to bring about catastrophic flooding of these North Sea coasts are experienced only a few times each century, and improved sea defences should stop all but the most extreme surges. On the Indian sub-continent, especially near the mouths of the River Ganges, death tolls from storm surges caused by tropical cyclones have been huge. In 1970, for example, more than 200,000 died when such a surge struck the area. Here, as in other places where storm surges occur, the sam

Examples of storm surges in the UK and their effects


A Ferry
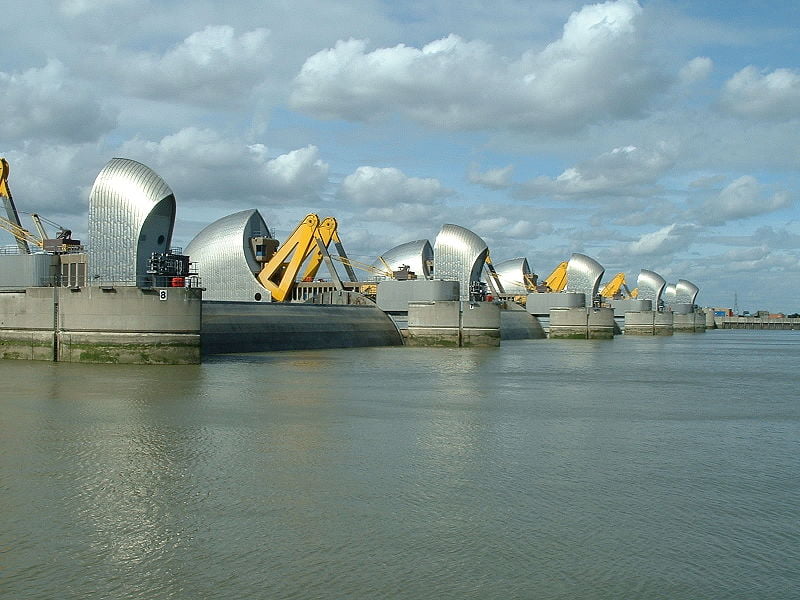
Flooding of the Thames on 6th -7th January 1928 highlighted the need to find ways of forecasting storm surges. However, the real push to investigate storm-surges was on 31st January and 1st February 1953, when, a surge exceeding 2.7 metres at Southend in Essex and 3.5 metres in parts of Holland killed 307 people died in eastern England and 1,800 in the Netherlands. The storm that caused the 1953 surge was among the worst to hit the UK in the 20th century. Before the storm’s low pressure and storm-force northerly winds raised water levels in the southern North Sea, hurricane-force winds blew down more trees in Scotland than were normally felled in a year; and a car ferry, the Princess Victoria, on passage from Stranraer in Scotland to Larne in Northern Ireland, sank with the loss of 133 lives. Only 41 of the passengers and crew survived. Nowadays, surges are forecast with considerable accuracy and storm-surge barriers are in place in the most vulnerable places in the Low Countries and eastern England, one of them on the Thames a (south of Greenwich).

The effects of pressure on sea level

The Thames BarrageWhen pressure falls by one millibar, sea level rises by one centimetre. Thus, a deep depression can cause sea level to rise 60 or 70cm above the level predicted purely on the basis of tidal theory. The pressure-induced rise in sea level caused by a tropical cyclone can be much greater, maybe a metre or more.

Flash flooding

FloodingOne of the most energetic and destructive of all weather systems are tropical cyclones. The hurricane-force winds can reach 50m/s and torrential rain falls from their towering cumulonimbus clouds.flooding The winds can cause disastrous surges on coasts and the downpours of rain can cause serious flooding. Power and water supplies are disrupted, buildings are damaged, crops are destroyed, people and livestock are drowned, bridges collapse, roads and railways are undermined or blocked by debris, and beaches are scoured. Tropical cyclones nearly always leave behind a trail of destruction and misery.

Flash floods are exceedingly dangerous. When water cannot percolate into the ground, it runs off the surface as it would from impermeable concrete. This is particularly so when the ground is very wet or when baked hard after a hot dry spell. Potholers can be especially at risk, such as on 24 June 1967, when five drowned in Yorkshire. The water which fell in a heavy thunderstorm after a spell of dry weather ran off rapidly into underground streams and caverns at Mossdale. The rise in water levels below ground was too rapid for the potholers to scramble to safety.

Floods resulting from persistently wet weather and thawing of snow case studies

Raining In terms of water flow, the Mississippi is the sixth largest river in the world. Its annual average flow rate is 14,000 cubic metres per second and it discharges into the Gulf of Mexico 580 cubic kilometres of fresh water per year. The greatest flows occur in the period March to May and the least in the period August to October. A large proportion of the United States is drained by this river.

To protect against flooding, which would otherwise occur frequently, the Mississippi River is constrained by levees (embankments) all the way from the State of Missouri to the sea. This barrier, much of it concrete, has isolated the river from a lot of the surrounding countryside, but without it and other means of dealing with excess water in the river, low-lying cities such as New Orleans could not exist.

Tragically, some of the levees around New Orleans were breached on 29 August 2005 when they failed to withstand the battering imposed by the waves and a storm surge generated by Hurricane Katrina. Flood depths reached six metres in places and more than 1,000 people died.

Despite levees, spillways, reservoirs, pumping stations and other constructions, flooding does still occur. The flood-control system proved incapable of containing the flood of 1973, for example, and again proved inadequate in the summer of 1993, when abnormally high rainfall over central parts of the United States caused extensive flooding of the upper and middle Mississippi and lower Missouri rivers. The city of St Louis was particularly badly affected. Discharges of water from the Mississippi into the Gulf of Mexico in the late summer of 1993 were abnormally high. A study using satellite imagery showed that water from the Mississippi spread out far and wide off the States of Louisiana, Texas and Alabama. Indeed, some of the Mississippi water passed through the Florida Strait into the Atlantic.

There was rain, more rain and even more rain in northern California soon after Christmas 1996. From 29 December 1996 to 4 January 1997, depression after depression from the central Pacific brought rain to northern California. As the air was unusually warm, a consequence of the precipitation was that large amounts of snow melted. During the week of the storms, 61 cm of rain was recorded. Significant flooding occurred in northern California and southern Oregon and 43 counties were declared disaster areas. Flooding occurred rapidly because soils became saturated and amounts of snowmelt were large. Flood-control reservoirs could not cope, as their storage capacity was no more than moderate because of near-normal rainfall and run-off prior to the onset of the severe weather. Levee failure occurred on several rivers.

After the United Kingdom’s snowy winter of 1947 came the thaw. In many parts of the British Isles in February and early March 1947, deep drifts of snow, some five metres or more deep, caused villages and hamlets to be cut off for days on end. Then, on 10 March, warm air and rain edged into south-west England and advanced across the British Isles. By 13 March, floods were widespread. Vast areas of Fenland, the Severn Valley and other parts of Britain were submerged. At Selby, Yorkshire, three-quarters of all the houses were under water. A severe south-westerly gale on 16 March drove water ahead and caused dykes in the Fens of eastern England to burst. Warm air and rain are much more effective at thawing large quantities of snow than sunshine. The albedo of old snow (proportion of light reflected) is about 55%. The albedo of fresh snow is about 80%.

On 9 and 10 April 1998, just before Easter, prolonged heavy rain fell over a wide area of Wales and central England. In the Midlands of England, there was serious flooding, with Northampton and Leamington Spa badly affected. In these Easter Floods, as they have come to be known, 4,500 homes were inundated, five people died and the estimated cost of the damage exceeded £350 million. The culprit was a slow-moving depression centred over Brittany. North of it, lying east-west across the Midlands, there were two parallel fronts which were almost stationary, producing prolonged heavy rain that fell on a catchment that was already saturated.

snowflakeIn coastal regions, flooding may be caused not only by a storm surge but also by a combination of high tide and high river level. An example of the latter occurred in South Wales in 1979. On 26 and 27 December of that year, falls of rain exceeded 100mm in many places, especially over the hills. Extensive flooding occurred on the 28th. Cardiff was badly hit when the River Taff in spate met a high tide from the Bristol Channel. Hundreds of homes and offices near the city centre were inundated. Flooding with sea water is bad enough, not least because the salt in the water is left behind when the water evaporates, but the flooding in Cardiff on this occasion was particularly unpleasant, as the water welled up into streets and houses through the sewers.

Health Risks after Flooding

A RatIn many parts of the world, there are serious health risks after disastrous flooding. Mosquitoes, flies and other insects may become more abundant than usual, as the filth, debris and stagnant water left by the floods provide suitable breeding conditions. Consequences may include out-breaks of typhoid, dysentery and encephalitis. Rats and mice displaced from their natural habitats may find conditions to their liking in houses, sheds, barns and other buildings.

a snakeIn some parts of the world, snakes also become a problem after flooding, as they, too, are displaced from their natural homes by the water. Quite often, they appear inside houses. However, snakes can be beneficial, as they help to reduce populations of rodents.

Beneficial Effects of Flooding

The NileSome of the most fertile land in the world lies beside rivers, the Nile valley being the classic example. For thousands of years, the people of Egypt have relied upon the waters of the Nile to overflow their banks every year, carrying with them fertile silt that makes agriculture possible. The flow of this river is nowadays controlled by means of the Aswan High Dam, an operation that can have its advantages and disadvantages. Salinity levels in the Nile Delta have increased, for example, because the outflow of fresh water from the river is much less now than before the High Dam existed. On the other hand, availability of water from the lake behind the dam, Lake Nasser, has allowed water levels downstream to be maintained in drought years, thus benefiting agriculture when in olden times crop failure and famine might have occurred.

A River ValleyThe Ganges Delta is another place where flooding brings benefits for agriculture. Here, every June to October, the waters of  the Ganges, Brahmaputra and other rivers overflow and inundate the countryside. There is, however, no equivalent of the Aswan High Dam to control the waters of the Ganges Delta. Sometimes, crops are destroyed, hamlets ruined and humans and animals drowned.

In some arid regions (e.g. Namibia and central Australia), floods occur very occasionally. When they do, glorious displays of flowers follow. In these areas, seeds can lie dormant for many years and germinate (grow) very rapidly when the rains come.

A TreeThe heavy rains brought by tropical cyclones can help revive crops and replenish water supplies. Sometimes, fruit trees have flowered and borne fruit a second time after the passage of a cyclone. Sometimes, floods have flushed away mosquito breeding areas. There is a danger, however, that residual pools of water will, in turn, become mosquito breeding areas.

Drought

Download Drought Fact File

What is a drought?

Droughts are not very easy to define. A drought is not just a lack of water for a period of time. In fact there are a whole range of types of drought including; agricultural (farming), meteorological (weather), hydrological (surface water) and socio-economic (ones which affect humans).

Agricultural Drought

A Combine HarvesterThis is a drought which affects how farmers can use their land. An agricultural drought usually means there is not enough water for the crops to grow as there is a lack of soil moisture. It can also affect livestock such as cows and sheep.

Hydrological Drought

Water DropletsHydrological droughts are ones which there is a lack of water at the surface of the earth, resulting in less water in streams, lakes and reservoirs and can impact on the use of water for houses and industry

Meteorological Drought

DropsThis is usually simply defined as a period of time where there has been less rain recorded. Rainfall amounts can vary by duration (i.e. time the rain fell for) and the intensity of rainfall (how hard it was raining). Meteorological drought is usually recorded in the time there has been little or no rain for e.g. months or years.

Socio-economic Drought

Pound SignA Socioeconomic drought is when physical water shortages affects the lives of people; such as their health and quality of life. It can also affect the supply of food and materials and so affect the economy.

Deserts

What is a desert?

A desert is an area of land where rainfall is not sufficient to support vegetation. There are usually large temperature difference between day and night, known as the diurnal temperature range. Deserts can be hot or cold!

What is Desertification?

This is when an area on the boundary of a desert which loses its vegetation and the land becomes filled with sand dunes. Possible causes include climate change and variability, human pressure on the land and overgrazing by livestock (animals).

Where are the Main Deserts in the World?

Deserts are areas of very low rainfall and are often described as drought regions of the globe. But do you know where they are?

A World Map of Deserts

Climate Change Schools’ Project Resources

craft modelThe Climate Change Schools Resources were developed by the Climate Change Schools Project, based at the then Science Learning Centre in Durham and led by Krista McKinzey. A large number of teachers and schools in North East England were involved in their development.

They have subsequently been updated by the Royal Meteorological Society.


Climate Change Teaching Resources for Schools

Resources for KS2/ upper primary

Resources for KS3 (some can also be used at KS4/ GCSE)

Resources for A level/ more advanced students and teacher CPD


Climate Literate person;

  • Understands the essential principles of Earth’s climate system and knows how to assess scientifically credible information about climate,
  • Communicates about climate and climate change in a meaningful way,
  • Can make informed and responsible decisions with regard to actions that may affect climate.

Weather People (upper primary)

Weather radar dish

Image credit: Lindsay Bennett

Weather observers are the people whose job it is to collect data from rain gauges and thermometers. Weather information is also collected by satellites and radar.

slicing ice core

Image credit: Rob Mulvaney/ British Antarctic Survey

We know about what the weather was doing a long time ago by collecting data from the air trapped in ancient ice. 

Image credit: Ray Jefferson

Weather forecasters use observations from all over the Earth and some of the world’s biggest supercomputers to work out what the weather will do next. There are different forecasts for different people – supermarkets need to know whether people will be buying ice cream or warming soup; farmers need to know when to harvest crops; and the people organising big sports events need to know whether the weather will stop play. 

Weather presenters tell us about the weather on TV, social media and radio.

weather presenter
green screen weather presenter

Images credit: Kirsty McCabe

Emergency Services such as the police, fire brigade and emergency doctors, as well as mountain rescue, coastguard and the people who plough snow or grit our roads are all very important when there is bad weather. 

snow plough
storm chaser tornado

Storm chasers look at the weather forecast to see when a powerful storm is expected, then try and get into the right place to be able to take great photos of the weather.

Image Credit Lindsay Bennett

Sailing Weather

Sailing Hazard

Sailing is one of the most weather-dependent sports. Unfortunately, wind is not just a useful source of power for sailing craft but also a hazard. Strong winds can capsize boats, either directly or in combination with the waves they may produce.

The wind is never steady. It always fluctuates between gusts of higher wind speed and lulls that may be so light as to be near-calm. However, sudden increases of wind on a larger scale can sometimes occur. These are called squalls and are often associated not only with strong, gusty wind but also with heavy rain.

The importance of any hazard varies with the skill level of the crew, the type of boat and the kind of sailing being undertaken. For example, a novice crew in a small boat may underestimate wind strength before setting off. This is an easy mistake to make, especially if they are launching from a relatively sheltered location. Sailors who are more experienced are unlikely to be caught out like this but are still vulnerable in other ways. Hard sailing, especially in colder conditions, can tire a crew very quickly. Exhaustion or exposure can creep up on them before they know what is happening. For example, a dinghy crew might be having great fun practising sailing across the wind, only to find when they feel they have had enough that they do not have the reserves of energy for a long struggle upwind or a tricky run downwind.

These days, yachtsmen do not have to rely on old folklore or gamble on good weather. All sailors should pay attention to weather forecasts. These are available through radio, television, the internet and other means of broadcasting.

The particular forecast that is most appropriate depends on the kind of sailing being planned. The shipping forecast broadcast on the radio is perhaps the most useful to offshore sailors. The terms used in it are precisely defined, and the information that is included in it on pressure changes and movements of weather systems is very useful to anyone with a deeper than average understanding of meteorology.

When yachtsmen study meteorology as part of a training course, either at sea or ashore, they are often asked to create a weather map from a recorded shipping forecast as an exercise. The Royal Yachting Association can provide forms called ‘Metmaps’ that make recording and interpreting the shipping forecast a lot easier. Completing one of these is a good exercise for anyone who wants to go into meteorology seriously. The ‘Metmap’ is a two-sided A4 form. On one side, a shipping bulletin broadcast by the BBC can be taken down. On the other, a simple up-to-date weather map can be drawn from the information contained in the bulletin.

The shipping forecast gives a lot of information about visibility at sea. This is because poor visibility can sometimes be a greater hazard than strong winds. The forecast will not only give a guide to overall visibility in terms of ‘good’, ‘moderate’ or ‘poor’ but will often indicate if visibility is poor for a specific reason, such as ‘visibility poor in showers’. This particular occurrence can give a sailor a real fright, as views of nearby vessels or navigation marks can be lost suddenly when showers occur.

Two possible hazards are not often mentioned in weather forecasts for sailors but usually are in forecasts for land areas:

old illustration of ship lighteningOne of these is lightning, though the possibility of its occurrence may be indicated indirectly in a forecast or station report as ‘thundery showers’. In fact, lightning is not such a risk to sailors as it might at first appear. Boats are surrounded by a very good conductor of electricity – water – and unless the boat suffers a direct hit, which is unlikely, the current is dissipated much more quickly than on land.

The other neglected hazard is exposure to sunlight and sunburn. Sailors are at particular risk for two reasons. First of all, yachtsmen can get an increased dose of sunlight because of reflections from the water. Secondly, they may not notice this because the wind will make them feel cool and unaware they are ‘cooking’. Many a sailor has returned to work on a Monday morning with a ‘yachtsman’s tan’ (from the neck up!). This might seem a nice problem to have, but all sailors should note the example of the America’s Cup crews, who often display extremely colourful suncream to protect against harmful solar radiation.

Despite the apparently long list of hazards described, sailing is, in fact, a very safe sport. It is also a sport where knowledge of meteorology can increase a participant’s enjoyment and even give a competitive advantage!

Acapulco in 1968, sailors competing in the Olympic Games had an unusual surprise from the weather. While not actually hazardous, it was certainly not pleasant. One day, following a sudden squall, the covers of the boats were covered with maggots, which had, presumably, been drawn up into clouds by a whirlwind or waterspout, only to fall out in a downpour of rain.

The year 1979 is famous to yachtsmen for the worst possible reason. In August of that year, during the Fastnet Race (from Cowes on the Isle of Wight to the Fastnet Rock [51°24’N 9°35’W] off south-west Ireland and back again to Plymouth), the fleet of yachts ran into severe storms and rough seas. Fifteen lives were lost. Despite ‘survival conditions’, many crews kept records of the severe conditions, based on their barometers and wind instruments. To the meteorologists who have analysed the Fastnet Storm and its structure, these records have proved invaluable. For a recent analysis of the storm, see the article by D.E.Pedgley in the August 1997 issue of Weather (Volume 52, pp.230-242).

Shipping forecasts are currently broadcast four times a day on BBC Radio 4 Long Wave. They are also available via the websites of the Met Office and the BBC Weather Centre. In shipping forecasts, the Beaufort Scale is used for describing wind strength. This scale originated in the days of sail but is now defined precisely in terms of the wind at a height of ten metres averaged over a ten-minute period.

Mountain Weather

MountainsEvery year people go and enjoy the wonders of the mountain scenery but for some the experience isn’t so pleasant as they venture onto the mountain unaware of the weather they may met. Every year, even in the UK people die on mountains as a consequence of the weather.


Some underestimate the mountain weather; some are unaware of the mountain weather and some leave decisions on the weather too late when on the mountainside.

Download mountain hazard Factfile

Clouds on the Mountains

big mountainsMountain tops are often hidden by clouds, which can result in people getting lost. But why does this happen? Clouds are formed by the condensation of water vapour in rising air. Air is very moist (holds lots of water) when it is near the sea or when there is persistent rain. In the UK the cloud base (i.e. the bottom of the clouds) is often below 1000m, so low in fact that much of the time the clouds cover the mountain tops. Cloud cover on the mountains is particularly common in the west of the UK where the moist air blows in across the Atlantic. Clouds can be supercooled i.e. water remains as a liquid even when the temperature is below freezing (0°C)! these droplets of water freeze when they hit solid objects such as fences and even people. The soft ice can build up into a think layer, known as rime which can cause as much difficulty for walkers as lying snow.

clouds in the mountainsThe rain and snow which falls over mountains tends to come from nimbostratus clouds, and occasionally cumulonimbus clouds, tend to be heavier and longer lasting than over nearby low lying areas. This is because the air is forced to rise over the mountains, causing the air to cool as it rises condensing the water from a gas to liquid; forming more clouds. However strong winds at the mountain top can blown the heavier rain over the mountain top, so the heaviest rain will not necessarily be at the highest point. Waterproof clothing and footwear on mountains is essential as there can be heavy rain, driving winds and mountain streams can become deep quickly. Deep depressions coming in from across the West coast of the UK can bring heavy rain and strong winds to the UK. Snow combined with wind can be life-threatening on a mountain top.

Wind chill on the mountains

wind in the mountainsThe higher up the mountain we climb, the colder and windier it usually gets so that the wind chill factor increases. Warm clothing on the top of mountains is definitely needed. On the Munros (the Scottish mountains with tops above 3000m) it can be 10°C cooler at the top of the mountain in comparison to the valley bottom below. In fact air can cool by 6°C in every 1000m and sometimes as much as 10°C. But why does the air get cooler and windier? It is windy high up in the atmosphere as the effect of gravity is reduced and cooler because air temperatures decrease as you get closer to the poles. Therefore gale force winds are stronger and more common at the top of mountains than at sea level. Winds also get faster around mountains as they do around tall buildings in our towns and cities. Over the Himalayas winds of 150km/hr (approximately 42 metres per second) are not uncommon!

What is a whiteout?

mountain whoteoutSnow combined with poor visibility in cloud also causes problems because shadows disappear. Navigation becomes almost impossible and can lead to blundering into dangerous places ‘ even over the edges of cliffs. This is known as a ‘whiteout’. If there is already much lying snow and a risk of the cloud base descending onto the hills, many climbers often consider it wise to abandon the trip.