![]() Aldridge, V., Meldrum, G. and Ross, H., 2005
Aldridge, V., Meldrum, G. and Ross, H., 2005
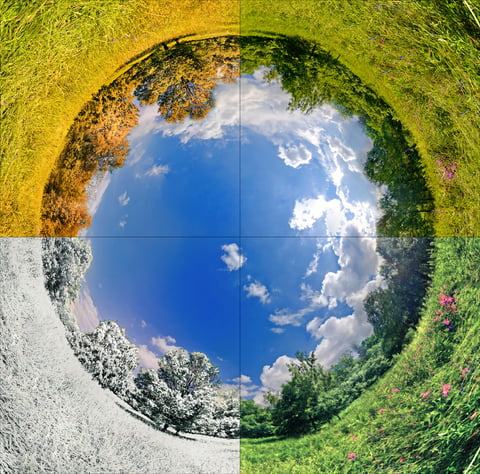
The Science of Weather: a primary school resource
City of Edinburgh Council

![]() Aldridge, V., Meldrum, G. and Ross, H., 2005
Aldridge, V., Meldrum, G. and Ross, H., 2005
The Science of Weather: a primary school resource
City of Edinburgh Council
![]() Aldridge, V., Meldrum, G. and Ross, H., 2005
Aldridge, V., Meldrum, G. and Ross, H., 2005
The Science of Weather: a primary school resource
City of Edinburgh Council
![]() Aldridge, V., Meldrum, G. and Ross, H., 2005
Aldridge, V., Meldrum, G. and Ross, H., 2005
The Science of Weather: a primary school resource
City of Edinburgh Council
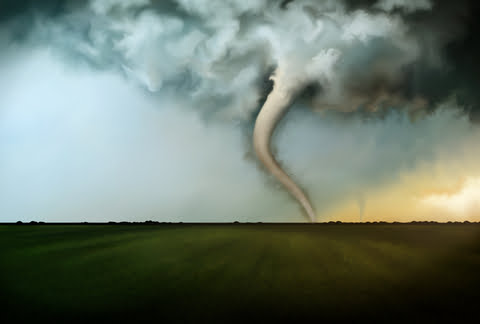
![]() We have several resources for teaching about tornadoes in primary schools:
We have several resources for teaching about tornadoes in primary schools:
Tornadoes lesson plan for year 3+.
Tornadoes in Your Classroom an article from Primary Geography.
Ideas and lesson plans to enhance the learning and teaching of weather studies in the primary school.
The material is grouped into weather subjects and each subject has two downloadable parts:
Background information and classroom activities The Story for Teachers (links below)
Accompanying images and worksheets – Resources (links below)
Aldridge, V., Meldrum, G. and Ross, H., 2005
The Science of Weather: a primary school resource
City of Edinburgh Council

![]() Aldridge, V., Meldrum, G. and Ross, H., 2005
Aldridge, V., Meldrum, G. and Ross, H., 2005
The Science of Weather: a primary school resource
City of Edinburgh Council
The material is grouped into weather subjects and each subject has two downloadable parts:
![]() The material is grouped into weather subjects and each subject has two downloadable parts:
The material is grouped into weather subjects and each subject has two downloadable parts:
Background information and classroom activities The Story for Teachers (links below)
Accompanying images and worksheets – Resources (links below)
Aldridge, V., Meldrum, G. and Ross, H., 2005
The Science of Weather: a primary school resource
City of Edinburgh Council
![]() The material is grouped into weather subjects and each subject has two downloadable parts:
The material is grouped into weather subjects and each subject has two downloadable parts:
Aldridge, V., Meldrum, G. and Ross, H., 2005
The Science of Weather: a primary school resource
City of Edinburgh Council
Key Stage 2 Geography
What will the weather be like on holiday and how will it affect us?
In this activity the children use a range of activity cards to learn about five holiday destinations with different types of climate, and to link tourism and human activity to the weather in each locality.
The activity can be differentiated through a choice of activity cards describing climate through a simple statement, a more detailed explanation, and graphs of average weather conditions.
Children should learn:
Introduction
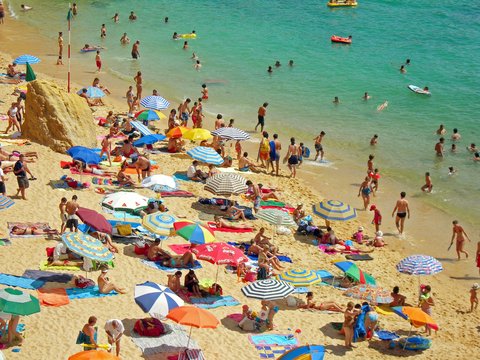
Tell the children to imagine they have won a holiday competition, and for their prize they can choose one of five destinations on offer. Show the children the photo activity cards.
In order to make their choices the children will need to find out about the weather and activities at each destination, through discussion and using the activity cards.
Main activity
Children work in groups with a set of photo cards, tourism cards and climate cards. They need to match each photo with the corresponding climate and tourist activity card and choose which holiday they would like.
The activity can be simplified for lower ability groups by using the simple climate activity cards.
High ability children can be challenged to match each climate description to a corresponding average weather graph.
Children tell the rest of their group their chosen destination and give reasons for their choice.
Plenary
Ask each group to match one photo to its corresponding activity cards. Ask individuals about their choice of destinations and to give reasons.
Activity cards
Activity answers
Web page reproduced with the kind permission of the Met Office.
This quiz can be used for all ages and is a fun way to learn weather words
Download our Weather Words Quiz
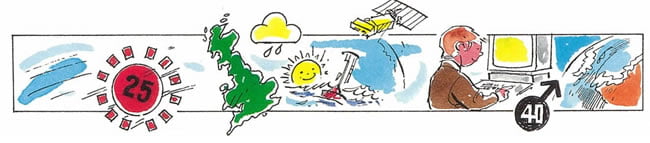
The weather is being checked all day and all night by lots of different people and machines.
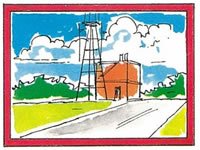
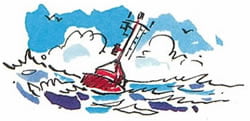
Weather stations
There are over 200 weather stations around the country that collect information night and day. They measure many things including how much rain has fallen, the temperature and humidity, air pressure and the wind speed and direction.
At the weather station a rain gauge measures how much rain has fallen.
Thermometers are used to measure both the highest and lowest temperatures.
Aircraft can send weather reports to the satellites.
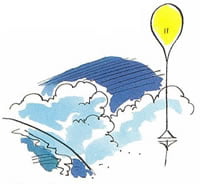
Special balloons called radiosondes send back information to the ground about the weather high above us.
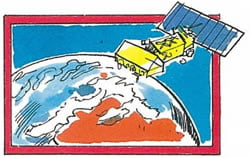
Satellites send back images of what they can see of the Earth’s weather from space.
There is a special computer at the Met Office in Exeter which stores all of the information received about the weather.
It takes the computer two hours to make its forecast. Weather forecasters then look at the charts and maps and decide what sort of weather we might expect.
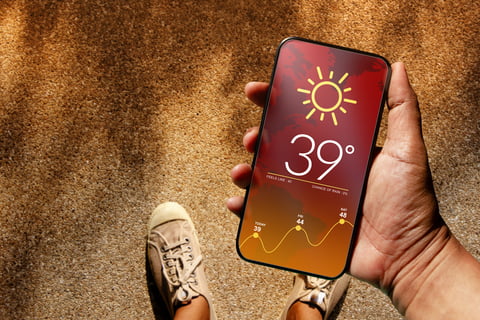
Did you know?
One of the highest temperatures ever recorded was in Death Valley in the USA when the temperature reached 58 °C. (The highest recorded temperature in the UK is 39 °C.)
The lowest temperature ever recorded was in Vostock, Antarctica, when -89 °C was recorded on 21 July 1983. (The lowest recorded temperature in the UK is -27 °C.)
The sunniest parts of the United Kingdom are along the south coast of England where many places achieve annual average figures of around 1,750 hours of sunshine. The dullest parts of England are the mountainous areas, with annual average totals of less than 1,000 hours.
Web page reproduced with the kind permission of the Met Office
© 2024 Royal Meteorological Society
RMetS is a registered charity No. 208222