Handling data and measurements
Key Stage 2 Mathematics
Handling data and measurements
Overview
Children measure the outside temperature at the same time on each day for a week. They use ICT to record the temperature each day, in a suitable data handling program. At the end of the week they use the program to display the results on a bar chart. They answer questions such as:
On which days was it warmer than 15 degrees?
What is the difference between the temperature on the hottest day and the temperature on the coldest day?
Objectives
Children should learn:
to read, to the nearest division and half-division, scales that are numbered or partially numbered. Use the information to measure and draw to a suitable degree of accuracy.
to answer a question by collecting, organising and interpreting data.
to use ICT to create a bar chart.
Lesson plans
Activity
Mental starter
Use slide 1 to ask questions about the temperature data.
Main teaching
Use the thermometer ITP, to teach the children how to measure temperature to the nearest degree.
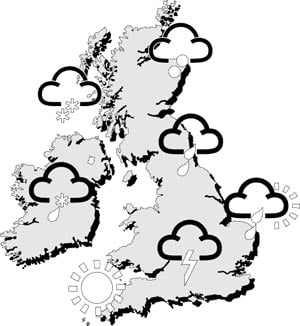
Using slides 5–9 go through temperature, rainfall and wind speed measurements.
Tell the children they will be keeping a weather diary for one week and measuring the outside temperature at the same time every day.
If you have a weather station at school show them how to measure the wind speed and rainfall. Otherwise, show the children how to find the information using the latest weather data on the internet.
Demonstrate how to record the temperature each day in your chosen data handling program.
Lesson resources
Keeping a weather diary (Temperatures) slideshow.
Link to the Met Office latest weather forecast for the UK.
Main activity
Children measure the outside temperature in groups at the same time every day for one week and complete their individual weather diaries.
On the last day, when all the information has been collected, using ICT, children record the temperatures for the week in the chosen data handling program and use the information to display as a bar chart, which can then be printed.
Your own weather diary worksheet.
You will need:
Access to computers or laptops
Plenary
Using slides 10–14 ask the children to answer questions with the help of their bar charts. Can they think of any other questions to ask? What does the chart tell us about the weather during the week?
You will need:
Slides 10–14 of keeping a weather diary (Temperatures) slideshow (above)
Web page reproduced with the kind permission of the Met Office.


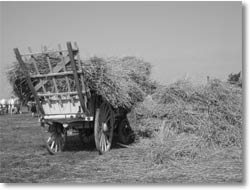 Scientists and others have found lots of very useful information in books from the past few hundred years. These books include personal diaries written by people at the time, telling us how the weather affected them in their daily lives.
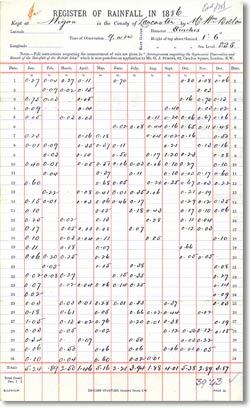 There are many, very old weather records that scientists use to see what the weather was like a long time ago. But not all – especially those about 300 years old – contain all the information they should.


 Storm surges are mainly caused by the effect of the wind on the sea, not changes in atmospheric pressure. The effect of wind on the sea surface is known as wind stress. The wind stress on the surface of the sea causes the water level on a coast to rise if the net transport of water is towards land and to fall if it is away from land.
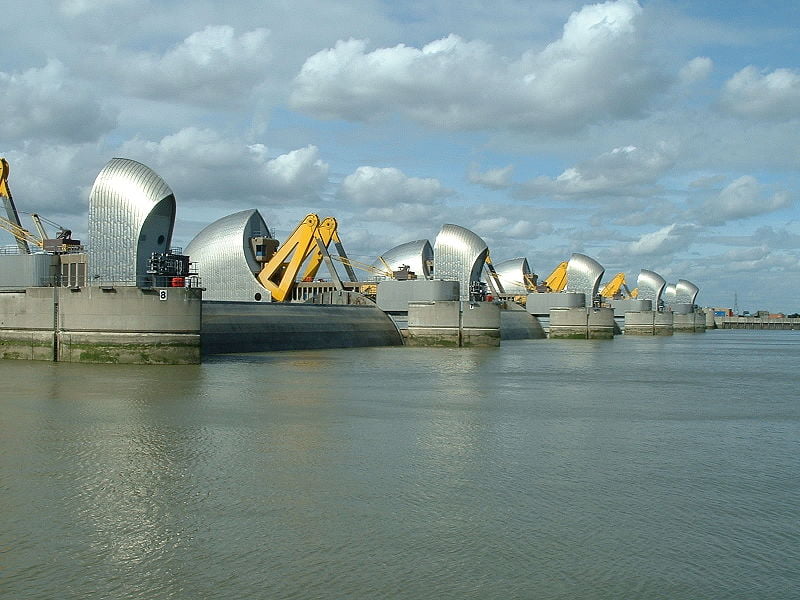
 Flooding of the Thames on 6th -7th January 1928 highlighted the need to find ways of forecasting storm surges. However, the real push to investigate storm-surges was on 31st January and 1st February 1953, when, a surge exceeding 2.7 metres at Southend in Essex and 3.5 metres in parts of Holland killed 307 people died in eastern England and 1,800 in the Netherlands. The storm that caused the 1953 surge was among the worst to hit the UK in the 20th century. Before the storm’s low pressure and storm-force northerly winds raised water levels in the southern North Sea, hurricane-force winds blew down more trees in Scotland than were normally felled in a year; and a car ferry, the Princess Victoria, on passage from Stranraer in Scotland to Larne in Northern Ireland, sank with the loss of 133 lives. Only 41 of the passengers and crew survived. Nowadays, surges are forecast with considerable accuracy and storm-surge barriers are in place in the most vulnerable places in the Low Countries and eastern England, one of them on the Thames a (south of Greenwich).
 When pressure falls by one millibar, sea level rises by one centimetre. Thus, a deep depression can cause sea level to rise 60 or 70cm above the level predicted purely on the basis of tidal theory. The pressure-induced rise in sea level caused by a tropical cyclone can be much greater, maybe a metre or more.
 One of the most energetic and destructive of all weather systems are tropical cyclones. The hurricane-force winds can reach 50m/s and torrential rain falls from their towering cumulonimbus clouds.flooding The winds can cause disastrous surges on coasts and the downpours of rain can cause serious flooding. Power and water supplies are disrupted, buildings are damaged, crops are destroyed, people and livestock are drowned, bridges collapse, roads and railways are undermined or blocked by debris, and beaches are scoured. Tropical cyclones nearly always leave behind a trail of destruction and misery.
 Flash floods are exceedingly dangerous. When water cannot percolate into the ground, it runs off the surface as it would from impermeable concrete. This is particularly so when the ground is very wet or when baked hard after a hot dry spell. Potholers can be especially at risk, such as on 24 June 1967, when five drowned in Yorkshire. The water which fell in a heavy thunderstorm after a spell of dry weather ran off rapidly into underground streams and caverns at Mossdale. The rise in water levels below ground was too rapid for the potholers to scramble to safety.
 In terms of water flow, the Mississippi is the sixth largest river in the world. Its annual average flow rate is 14,000 cubic metres per second and it discharges into the Gulf of Mexico 580 cubic kilometres of fresh water per year. The greatest flows occur in the period March to May and the least in the period August to October. A large proportion of the United States is drained by this river.
 There was rain, more rain and even more rain in northern California soon after Christmas 1996. From 29 December 1996 to 4 January 1997, depression after depression from the central Pacific brought rain to northern California. As the air was unusually warm, a consequence of the precipitation was that large amounts of snow melted. During the week of the storms, 61 cm of rain was recorded. Significant flooding occurred in northern California and southern Oregon and 43 counties were declared disaster areas. Flooding occurred rapidly because soils became saturated and amounts of snowmelt were large. Flood-control reservoirs could not cope, as their storage capacity was no more than moderate because of near-normal rainfall and run-off prior to the onset of the severe weather. Levee failure occurred on several rivers.
 In many parts of the world, there are serious health risks after disastrous flooding. Mosquitoes, flies and other insects may become more abundant than usual, as the filth, debris and stagnant water left by the floods provide suitable breeding conditions. Consequences may include out-breaks of typhoid, dysentery and encephalitis. Rats and mice displaced from their natural habitats may find conditions to their liking in houses, sheds, barns and other buildings.
 In some parts of the world, snakes also become a problem after flooding, as they, too, are displaced from their natural homes by the water. Quite often, they appear inside houses. However, snakes can be beneficial, as they help to reduce populations of rodents.
 Some of the most fertile land in the world lies beside rivers, the Nile valley being the classic example. For thousands of years, the people of Egypt have relied upon the waters of the Nile to overflow their banks every year, carrying with them fertile silt that makes agriculture possible. The flow of this river is nowadays controlled by means of the Aswan High Dam, an operation that can have its advantages and disadvantages. Salinity levels in the Nile Delta have increased, for example, because the outflow of fresh water from the river is much less now than before the High Dam existed. On the other hand, availability of water from the lake behind the dam, Lake Nasser, has allowed water levels downstream to be maintained in drought years, thus benefiting agriculture when in olden times crop failure and famine might have occurred.
 The Ganges Delta is another place where flooding brings benefits for agriculture. Here, every June to October, the waters of the Ganges, Brahmaputra and other rivers overflow and inundate the countryside. There is, however, no equivalent of the Aswan High Dam to control the waters of the Ganges Delta. Sometimes, crops are destroyed, hamlets ruined and humans and animals drowned.
 The heavy rains brought by tropical cyclones can help revive crops and replenish water supplies. Sometimes, fruit trees have flowered and borne fruit a second time after the passage of a cyclone. Sometimes, floods have flushed away mosquito breeding areas. There is a danger, however, that residual pools of water will, in turn, become mosquito breeding areas.
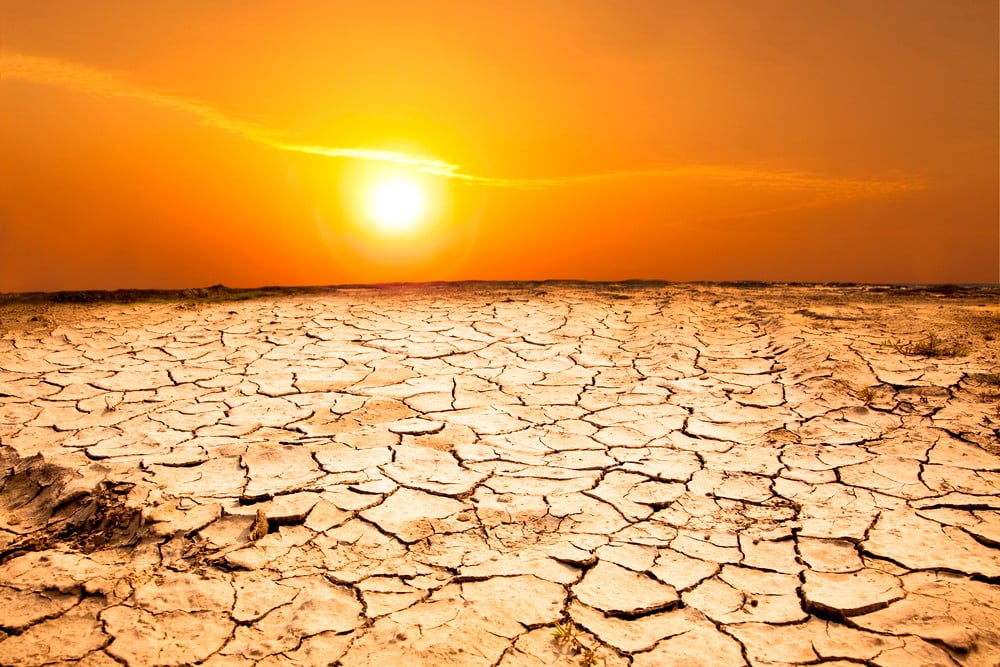
 This is a drought which affects how farmers can use their land. An agricultural drought usually means there is not enough water for the crops to grow as there is a lack of soil moisture. It can also affect livestock such as cows and sheep.
 Hydrological droughts are ones which there is a lack of water at the surface of the earth, resulting in less water in streams, lakes and reservoirs and can impact on the use of water for houses and industry
 This is usually simply defined as a period of time where there has been less rain recorded. Rainfall amounts can vary by duration (i.e. time the rain fell for) and the intensity of rainfall (how hard it was raining). Meteorological drought is usually recorded in the time there has been little or no rain for e.g. months or years.
 A Socioeconomic drought is when physical water shortages affects the lives of people; such as their health and quality of life. It can also affect the supply of food and materials and so affect the economy.

 The Climate Change Schools Resources were developed by the Climate Change Schools Project, based at the then Science Learning Centre in Durham and led by Krista McKinzey. A large number of teachers and schools in North East England were involved in their development.


 One of these is lightning, though the possibility of its occurrence may be indicated indirectly in a forecast or station report as ‘thundery showers’. In fact, lightning is not such a risk to sailors as it might at first appear. Boats are surrounded by a very good conductor of electricity – water – and unless the boat suffers a direct hit, which is unlikely, the current is dissipated much more quickly than on land.