World Climates

Weather around the world

Key Stage 2 Geography

What will the weather be like on holiday and how will it affect us?

Overview

In this activity the children use a range of activity cards to learn about five holiday destinations with different types of climate, and to link tourism and human activity to the weather in each locality.

The activity can be differentiated through a choice of activity cards describing climate through a simple statement, a more detailed explanation, and graphs of average weather conditions.

Objectives

Children should learn:

  • to ask and respond to geographical questions
  • to use geographical vocabulary
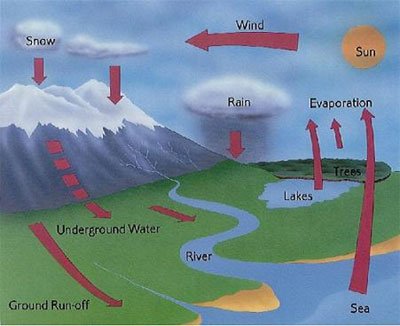
  • about weather conditions around the world.
  • Lesson plans

Introduction

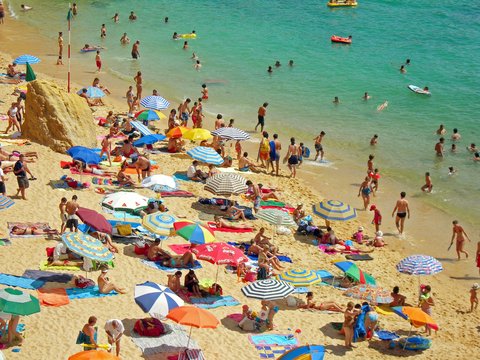
Tell the children to imagine they have won a holiday competition, and for their prize they can choose one of five destinations on offer. Show the children the photo activity cards.

In order to make their choices the children will need to find out about the weather and activities at each destination, through discussion and using the activity cards.

Main activity

Children work in groups with a set of photo cards, tourism cards and climate cards. They need to match each photo with the corresponding climate and tourist activity card and choose which holiday they would like.

The activity can be simplified for lower ability groups by using the simple climate activity cards.

High ability children can be challenged to match each climate description to a corresponding average weather graph.

Children tell the rest of their group their chosen destination and give reasons for their choice.

Plenary

Ask each group to match one photo to its corresponding activity cards. Ask individuals about their choice of destinations and to give reasons.

Lesson resources

Activity cards
Activity answers

Web page reproduced with the kind permission of the Met Office.

Weather Words Quiz

Why not try a Weather Words Quiz

a colourful balloonThis quiz can be used for all ages and is a fun way to learn weather words

Download our Weather Words Quiz 

Weather Check

Checking the Weather

Symbols of the weather
Fig 1: Symbols of the weather.
Satellite floating over the earth
Fig 2: Satellite floating over the earth.


The weather is being checked all day and all night by lots of different people and machines.


Weather stations

Radiosonde
Fig 3: Radiosonde.

There are over 200 weather stations around the country that collect information night and day. They measure many things including how much rain has fallen, the temperature and humidity, air pressure and the wind speed and direction.

At the weather station a rain gauge measures how much rain has fallen.

Thermometers are used to measure both the highest and lowest temperatures.


Aircraft can send weather reports to the satellites.

A weather station
Fig 4: Weather station.

Special balloons called radiosondes send back information to the ground about the weather high above us.

Satellites send back images of what they can see of the Earth’s weather from space.


There is a special computer at the Met Office in Exeter which stores all of the information received about the weather.

A weather buoy
Fig 5: A weather buoy.

It takes the computer two hours to make its forecast. Weather forecasters then look at the charts and maps and decide what sort of weather we might expect.


Did you know?

One of the highest temperatures ever recorded was in Death Valley in the USA when the temperature reached 58 °C. (The highest recorded temperature in the UK is 39 °C.)

The lowest temperature ever recorded was in Vostock, Antarctica, when -89 °C was recorded on 21 July 1983. (The lowest recorded temperature in the UK is -27 °C.)

The sunniest parts of the United Kingdom are along the south coast of England where many places achieve annual average figures of around 1,750 hours of sunshine. The dullest parts of England are the mountainous areas, with annual average totals of less than 1,000 hours.

Web page reproduced with the kind permission of the Met Office

Weather and Tourism

Weather and tourism

Key Stage 2 Geography & Literacy
This activity can be used to revise ways of examining texts to find out information, asking questions to guide research.

What effect does the weather have on tourism?

Overview

This lesson aims to use childrens’ previous learning about mountain climates in to identify how the weather affects the activities and tourism in different mountain localities.

Children will work in small groups and use a range of holiday brochures to find information to complete worksheets.

Objectives

Children should learn:

that varying weather conditions can have a significant impact on life in an area
to use secondary sources

Lesson plans

Activity

The lesson is introduced using slide one. The children talk in pairs about holiday destinations.

Where would they like to go on holiday in the winter?
Where in the summer?
Is the weather important?
What type of weather would they need?
Where in the world would they like to go?
Brainstorm a list of holiday activities, for summer or winter, in a mountain environment using slide 3.

Using slide 4 model how to find information, using holiday brochures and previous knowledge to complete the table for one locality.

Children will be working in small groups and using a range of holiday brochures and books to research types of tourism in a mountain locality they have studied in this unit. Differentiated worksheets can be used to record findings individually. Some children may need support to find information in brochures.

Groups can present their findings to the class.

Plenary
Display slide 5 and use photos to discuss the positive and negative impacts of tourism on mountain areas.

Lesson resources

Holiday activities slideshow.

You will need:
Holiday brochures for locations in this unit.
Library resources
Tourism worksheet (High ability).
Tourism worksheet (Low ability).

Web page reproduced with the kind permission of the Met Offic

Water Cycle Lesson

The water cycle

Key Stage 2 Science/ Geography

Overview

In this series of activities children will be using what they have learnt earlier about evaporation, condensation and reversible changes of state, to build up the water cycle from first principles.

The slides and the water cycle experiment will provide opportunities for children to extend their knowledge and to ask questions.

The practical activities will allow children to demonstrate their learning in a fun and creative way.

Objectives

Children should learn:

that water evaporates from oceans, seas and lakes, condenses as clouds and eventually falls as rain.

that water collects in streams and rivers and eventually finds its way to the sea

that evaporation and condensation are processes that can be reversed to interpret the water cycle in terms of the processes involved

Lesson plans

Activity one

Water cycle in a bowl experiment

Activity two

Children work in small groups to describe the water cycle in a variety of ways:

  • Designing a poster of the water cycle
  • Making a cartoon strip of the water cycle for a drop of water
  • Writing and performing a water cycle rap
  • Completing the water cycle word search
  • Each group shares their work with the rest of the class during plenary.

You will need:

  • Paper for posters
  • Paper for cartoon strips
  • Reference books

The water cycle wordsearch

The water cycle wordsearch answers

Web page reproduced with the kind permission of the Met Office

Some Background information.

For teachers the water cycle in depth.

The Water Cycle

The water cycle

The water cycle is the process by which water travels from the Earth’s surface to the atmosphere and then back to the ground again. It is a constant process with the same water going through the cycle over and over again.

The diagram below shows the different parts of the water cycle.The water cycle

The Earth’s water

Nearly all (about 97%) of the Earth’s water is contained in the oceans. A tiny amount is locked away as ice sheets and glaciers. This leaves a very small amount which travels around in our water cycle, although it may not always seem this way on wet days.

Stages of the water cycle

Stage 1

The first stage of the water cycle is when moisture from the sea and plants is lifted into the atmosphere. As the sun beats down it warms the oceans, rivers and lakes. This causes the water to rise into the air as water vapour. This process is known as evaporation. A tiny amount of moisture is also released from trees and plants. This is known as transpiration.

Stage 2

As the water vapour rises in the atmosphere, it cools and condenses, forming clouds. This process is known as condensation. It is the same process that makes you see your breath on a cold winter morning. The clouds will then produce rain or snow (known as precipitation) which returns to the Earth’s surface as water. The cycle then starts all over again.

Stage 3

Only about three quarters of the rain which falls back to Earth lands in the oceans. This is much less than leaves in the first place. The remaining water makes only a slow return to the oceans. Most is locked up in glaciers and icebergs and can take several thousands of years to complete its cycle. In tropical areas the process can take just a few hours.

The remaining water runs slowly overground, seeps into the ground or is taken up by plants as the cycle begins again.

Importance of water

The water cycle is vital for making sure rain falls around the world. People depend on it for drinking water for themselves and their animals and also for growing their food. Droughts caused by a lack of rain affect many parts of the world causing famine and many deaths.

Activities

Why not try making your own mini water cycle. Check out our Water Cycle in a Bag experiment and our water cycle in a bowl demonstration.

Measuring a puddle

What you will need:

  • A puddle
  • A piece of chalk

Choose a day then there has been rain overnight and the rest of the day is expected to be dry, warm and sunny.

Choose a puddle and first thing in the morning use a piece of chalk to draw around the puddle. A few hours later go back and draw around your puddle again. Repeat this several times during the day.

You should find that the puddle slowly shrinks during the day as the water evaporates.

For teachers – water cycle in depth and a water cycle lesson 

Web page reproduced with the kind permission of the Met Office

Snowflakes

Snowflake facts

How does snow form?

Snow crystals form in clouds when the temperature is below freezing. They are made by water droplets freezing onto ice particles. As an ice crystal falls through the cloud it bumps into others and becomes a snowflake. This processing of bumping into others, along with some melting and re-freezing helps to form their complex design. The air that the snowflake falls through has to be below freezing otherwise the snowflake will melt and turn to rain.

What do snowflakes look like?

Snowflakes are always six sided and it is thought that no two are ever the same. The shape and form of a snowflake depends on the temperature and amount of moisture within the cloud. Snowflakes can be divided into six main shapes, plate (flat), stars, column, needle, dendrite (lacy) and capped column. When it is very cold the snow is very fine and powdery and the snowflakes are quite simple in design, normally rod or needle shaped. When the temperature is closer to freezing point (0 degrees Celsius), the snowflakes are much larger and more complex in design, such as a star.

The Snowflake Man

An American photographer called Wilson A Bentley spent much of his life looking at snowflakes and taking pictures of them. He developed a huge collection of several thousand photographs of snowflakes and was nicknamed ‘The Snowflake Man’. In 1925 he was quoted as saying: “Under the microscope, I found that snowflakes were miracles of beauty; and it seemed a shame that this beauty should not be seen and appreciated by others. Every crystal was a masterpiece of design and no one design was ever repeated. When a snowflake melted, that design was forever lost.”

Snow facts

It is recorded in the Guinness Book of World Records, that the world’s largest snowflake was 38 cm wide and 20 cm thick. This occurred at Fort Keogh, Montana, USA on 28 January 1887.

The tallest snowman ever made measured 34.63 metres and was made by residents of Bethel, Maine, USA. It took 14 days to build, finally being completed on 17 February 1999. Nicknamed Angus, he had vehicle tyres for his mouth and trees for arms.

Why not make your own pretty snowflakes.

Follow the instructions below. You might need a adult to help you with the cutting out.

Fold your paper in half

1) Take a large square piece of white paper and fold it in half to make a triangle.

Fold your paper in half again

2) Fold your triangle in half again, corner to corner, to make a smaller triangle.

3) + 4) Your triangle now needs to be folded in to three. Fold the two sides across each other, making sure both sides are equal. It should look like diagram 4

Diagram 3
Diagram 4

5) Cut straight across the bottom of the paper to make a triangle with a straight base like the one below.Cut straight across the bottom of the paper to make a triangle with a straight base

6) Now you can make random cuts to make your own snowflake pattern.

Web page reproduced with the kind permission of the Met Office

Rainbows

Rainbow facts

RainbowRainbows are beautiful arcs of colour in the sky.

They occur when it is raining and sunny at the same time.

To see one you have to stand with your back to the sun.

The sun gives off light. The light we can see is called ‘white light’. But this white light isn’t actually white at all, it is made up many different colour wavelengths.

The main colours are red, orange, yellow, green, blue, indigo and violet. These seven colours are called the colours of the spectrum. The longest wavelength is red and the shortest is violet.

Memory aid for rainbow coloursMany people use the phrase ‘Richard Of York Gave Battle In Vain’ to help them remember the colours of the rainbow.

Separating the colours

Prism separating colours

To separate these seven different colours from the white light, you can use a prism (a triangular-shaped piece of glass).

The prism separates the white light into the different colour wavelengths by bending each light ray at a different angle and so separating the colours. The separation of white light into different colours is called ‘dispersion’. When the prism bends each light ray, this is called ‘refraction’.

So the reason we get rainbows in the sky is because the raindrops act like lots of tiny little prisms. As the sun shines white light through the sky, the raindrops separate it into the seven main colours, forming a rainbow.

Activities

Why not try creating your own phrase to remember the colours of the rainbow?

Why not draw your own rainbow and then colour it in? Try to use the right colours in the right order.

Web page reproduced with the kind permission of the Met Office

Mountain Environments

The mountain environment and weather data

Key Stage 2 Geography
How does the weather compare in each of these places?


Overview

This series of lessons aims to use a cross-curricular approach to geography and mathematics, to extend children’s knowledge of mountain environments, and their skills in collecting, presenting and interpreting data.

In activity one the children use a range of secondary resources, including the internet, to collect the latest weather data for three mountain environments, using worksheet 1 to record findings.

Activity two focuses more closely on climates. Climate slides can be used to introduce the main activity which is an investigation using the internet to find climate averages for the past 30 years. Children collect and present data as bar graphs and interpret their findings in terms of similarities and differences between places using differentiated worksheets.


Objectives

Children should learn:

about weather patterns in different parts of the world
to use secondary sources
to use ICT to access information

Lesson plans

Activity one

Collecting weather data using the internet
Children work in groups to collect weather data for three mountain localities related to their studies earlier in this unit.
They will need to use the internet to collect the data which, if possible, should be from that day’s latest weather reports.

Worksheet 1 can be used to record their findings.

Plenary
Groups can share their findings and discuss similarities and differences in weather between localities.

Note: When the latest weather data for a specific location is not available, children can use atlases to find the nearest towns and cities for which the latest weather data is available.

Lesson resources

PDF document containing photos of mountain localities being studied.

PDF document containing worksheet comparing latest weather data.

You will need:
Atlases
Internet access for groups
latest UK weather forecast.

Activity two

Comparing mountain climates
Using slide 1 as a starting point, ask the children to imagine they are going to visit the places in the photographs and that they need to think about the clothes they need to pack for each of the locations. Children can work in pairs to describe types of weather they might experience at low and high altitudes and make notes.

Allow time for children to share their ideas and discuss any questions arising from the exercise.

Using slides 3 to 10 introduce the class to climates and encourage children to think about factors that affect climate in different parts of the world.

Split the class into ability groups and introduce investigation task. Ensure each group investigates a different locality. Use worksheets 2, 3 and 4 to record data and plot graphs.

Plenary
Allow each group to present their findings and discuss with the children the similarities and differences between the weather in each of the mountain environments.

Compare bar graphs of rainfall for the different mountain environments and ask the question ‘is the driest time to go on holiday the same in all these places?’

Mountain climates slideshow- PDF document containing a set of slides for use with activity 2.

You will need:
Internet access for groups.

PDF document containing worksheet on Kathmandu (Low ability)

PDF document containing worksheet on Capel Curig (Middle ability)

PDF document containing worksheet on Cusco (High ability)

PDF document containing worksheet for any location within the UK

Link to the World Weather Information Service for Cusco.

Link to the World Weather Information Service for Kathmandu.

Link to the Met Office mountain weather forecast for Snowdonia (Capel Curig).

Web page reproduced with the kind permission of the Met Office

Measuring Temperature; Keeping Warm

Keeping warm

Upper Primary Science, Geography and Maths
Using a thermometer

Overview

In activity one, children will be introduced to thermometers and their uses, and have the opportunity to practise taking temperature readings using thermometers with different scales. They will link the measurement of temperature to how hot or cold things are.

In activity two, children will take careful readings of outside temperature during the day and try to explain findings in terms of weather conditions. Only a short time is needed at hourly intervals to take the temperature readings throughout the day.

Objectives

Children should learn:

to use a thermometer to make careful measurements of temperature, using standard measures.
that temperature is a measure of how hot or cold things are and that something hot will cool down and something cold will warm up until it is the same temperature as its surroundings.
to explain temperature and temperature changes using scientific knowledge and understanding

Lesson plans

Activity one

Introduction to using thermometers
Using slides 1 and 2 the children discuss uses of thermometers and are taught how to handle thermometers safely. They are then given a selection of thermometers to handle and examine.

Teach the children how to read the thermometer scale using the thermometer ITP.

Activity
Have containers of water at different temperatures ready, positioned so that all the children will be able to take temperature readings during the activity. Tell the children they will be practicing taking temperature readings for each container of water and the empty container which will be at room temperature. Remind the children that care will be needed when measuring the temperature of very hot water. Children record their measurements using the measuring temperatures worksheet and note the time. They will take a second reading an hour later.

While waiting to take the second reading, use the rest of the slides to practice reading temperatures, discuss temperature as a measure of how hot or cold things are and predict what will happen to the temperature of the water in the containers (the water will cool down or warm up to reach room temperature).

This will be a good time to introduce activity two, using slides 9 and 10 in preparation for starting the activity at 9a.m. when planned.

Plenary
Ask the children to measure the temperatures again and complete the worksheet.

Lower ability groups will need support to take temperature readings and complete the worksheet.

Lesson resources

Using a thermometer slideshow

You will need:
Containers of water at different temperatures including below room temperature and an empty container at room temperature.

Measuring temperatures worksheet

Activity two

Measuring the outside temperature
Place a thermometer in a safe place outside in the shade, away from direct sunlight.

Children take temperature readings at every hour and record them, using graph with or without scale.

Plenary
When children have completed all readings and constructed their bar graphs, discuss the results and ask children questions about their findings.

Ask the following:

What was the temperature at 9am?
What was the temperature at playtime?
How did the temperature change during the day?
What was the warmest time of the day?
Can you explain why the temperature changes during the day?

You will need:

Slides 9 and 10 from using a thermometer slideshow (above)

Outside temperatures worksheet

Outside temperatures worksheet(without scale).

Web page reproduced with the kind permission of the Met Office

MetLink - Royal Meteorological Society
We use cookies on this site to enhance your user experienceBy clicking any link on this page you are giving your consent for us to set cookies. More info

By clicking any link on this page you are giving your consent for us to set cookies. More info