Ocean Heating

Demonstrate Why the Oceans are Warming More Slowly Than the Atmosphere

Experiment based on that developed by NASA

Equipment

  • round party balloons
  • a lighter or lit candle
  • bottle of water
  • bucket or bowl

Please wear safety goggles when doing this experiment. 

Method

  • Blow up a balloon and tie it. The air-filled balloon represents Earth’s atmosphere. Hold it by the knot.  
  • Make sure all spectators are at least 1m away from you.
  • Light the lighter – the flame represents the heat from the sun. Hold the flame close to the balloon, at a safe distance from where you are holding the balloon.
  • As soon as the flame touches the balloon, the balloon will pop.
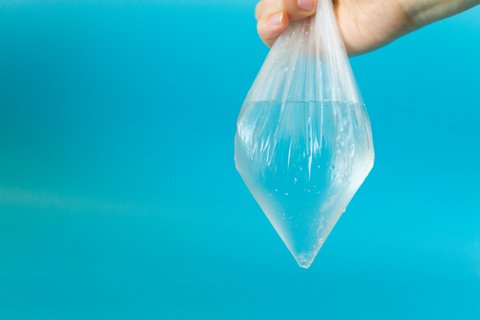
  • Now make a water balloon. When filling the balloon with the bottle, try to remove any air bubbles (which could cause the balloon to pop prematurely).  This balloon represents the Earth’s oceans. Hold the balloon by the knot, over the bucket. 
  • Now hold the flame close to the balloon, at a safe distance from where you are holding the balloon.
  • Depending on the size of the balloon, the quality and thickness of the rubber, and the presence of any air bubbles, the water-filled balloon should last more than one minute with the flame on it.  
  • Eventually the balloon will pop, so position the bucket to catch the water.

How does this relate to the oceans and atmosphere?

This demonstration illustrates how Earth’s oceans are absorbing a great deal of the excess heat in the climate system as the Earth’s climate changes – about 80 to 90%.

As the heat capacity of water is much higher than that of the atmosphere, the temperature of the oceans isn’t changing as much as the atmosphere.

In exactly the same way, the  flame took much longer to heat the water filled balloon to the point where the balloon melted. 

Where can I Find Out More?

More from NASA

Carbon Brief

Particulate Matter, ice, albedo and melting – Teacher’s Notes

In this experiment the students will look at the effect of Particulate matter or other substances that have landed on ice and test how this can speed up the melting of ice by affecting its albedo. Particulate Matter and aerosols are made up of a variety of pollutants, some of them enhancing and some counteracting the greenhouse effect when they are in the atmosphere. But once they land on snow or ice, they will promote the melting of these surfaces.

Chemistry Curriculum Links AQA GCSE

9.2.3. Properties and effects of atmospheric pollutants

Particulate Matter is a pollutant that absorbs at many different wavelengths, some act as greenhouse gases and others actually reflect more light than they absorb, leading to a reduction in the temperature of the atmosphere. When they (or Black Carbon in particular) deposit on snow and glaciers, they change the albedo (the reflectivity) of the snow surface. This controls the heat balance at the surface of snow and ice surfaces as the darker colour of the ice will lead to it melting faster.


Particulate Matter is solid particles that are so small that they float in the atmosphere and can be measured as a concentration in the atmosphere. They are formed from incomplete combustion of wood and fossil fuels. PM smaller than 2.5 microns (2.5 x 10⁻⁹ m), PM2.5 , is much smaller than the width of a human hair and can enter into our lungs and be carried into the blood system and cause damage to the brain and the cardiovascular system.

Uncertainties to do with the quantities of the different particles in the atmosphere (and the fact that particles enhance cloud formation) are part of the biggest current uncertainty in climate models.

Class Practical 

This experiment can be carried out in pairs or larger groups and takes about 20 minutes.

Follow the notes in the student worksheet, allowing more time to discuss what particulate matter is, what is albedo and how sunlight is absorbed differently by different coloured substances.

Discussion Questions

  1. Which ice cubes melted faster? Was it what they expected?
  2. Did all groups get similar results? Can we compare the melting rates as a % of original mass and see if they are similar between groups? What is the error in the melting rate of the 3 types of ice cubes?
  3. Does covering them with brown or black melt them faster?
  4. What are the possible errors in the experiment?

Application to the World’s Glaciers:

Glaciers around the world are more exposed to particulate matter now than they ever were before the industrial revolution and the increase in industry and cars over the last century. Covering snow and ice with a dark layer changes the albedo and they absorb more heat and melt quicker than the pure ice.

Particulates are tiny solid or liquid particles that are present in the atmosphere. They are sometimes termed aerosols when they float in the air. Examples are dust, spores and pollen, salt from sea spray, volcanic ash and smoke. Black carbon (elemental carbon (soot) or organic carbon) from incomplete combustion in the atmosphere can actually absorb incoming solar radiation and cool the Earth. However, when these particles land on ice, the absorption of radiation will enhance the ice´s melting.

References

Iain Stewart BBC black ice experiment

UN Environment programme, 2019: Glaciers are melting and air pollution is the cause

See bar chart of radiative forcing of various gases or particulates in Fig 14.4 Ramaswami et al., 2019

Particulate Matter, ice, albedo and melting – Worksheet

Have a look at these two glaciers, one has fresh snow over the glacier and the other is a dry glacier in summer with accumulated deposits of dust and Black Carbon from air pollution. Which one do you think is more vulnerable to melting? Does a bright white surface reflect more or less light than a darkened surface?

Silvretta Glacier with Fresh snow

Fresh clean snow on the Silvretta glacier,    Switzerland (Zoë Fleming)

Fox Glacier with dirty ice

Dirty ice on the Fox Glacier, New Zealand (Sylvia Knight)

Particulate Matter is solid particles that are so small that they float in the atmosphere. They are formed from incomplete combustion of wood and fossil fuels. When they are smaller than 2.5 microns (2.5 x 10⁻⁹ m, an eight the width of a human hair), this PM2.5 can enter into our lungs and be carried into the blood system and cause damage to the brain and the cardiovascular system.

When Particulate Matter (or Black Carbon, which is more or less soot or pure Carbon) settles on glaciers and snow it darkens the colour of the snow and hence changes the how much of the Sun’s light the snow reflects. In this experiment we will check to see whether dirty or clean ice melts faster.

Materials


Chemicals

Apparatus

3 ice cubes per group

3 bowls for placing ice cubes

Soot or Activated Carbon or burn a splint and gather the blackened combusted material

Spotlight

Soil or sand (as light coloured as possible)

Measuring scale


Spoon or forceps to move the ice cube between the bowl and the measuring scale

Method

  1. Take 3 ice cubes out of the freezer and place one in each bowl.
  2. Scatter soot over the ice cube in one bowl, covering it completely. Scatter the next ice cube with the soil. The last bowl will contain the control ice cube.
  3. Weigh each ice cube (using a spoon or forceps to place it on the scale).
  4. Shine the light bulb over the 3 bowls, trying to equally light/heat them all.
  5. After 5 minutes, remove each ice cube one at a time to weigh them.
  6. After 10 minutes, remove each ice cube one at a time to weigh them.
  7. If you have time to wait for the first ice cube to completely melt, note the time and note down how much was left of the other ice cubes (weigh them).

Results and Questions

  1. Which ice cubes melted faster?
  2. Does covering them with brown or black melt them faster?
  3. Thinking about a sunny day on snow, how do your eyes react to the sunlight? Does it seem like there is more light around or less than on a sunny day walking on bare soil? What about a sunny day on a boat? Do you think there is more or less light reflected back to your eyes than on land? The proportion of the Sun’s light which is reflected by a surface is called its albedo – a high albedo means a large proportion of the light is reflected and, therefore, only a small proportion is absorbed. 
  4. What about the difference between wearing white or black clothes on a sunny day- which one absorbs the sun rays and makes you feel warmer? Is that a small or large albedo?

Application for the world’s glaciers:

Glaciers around the world are more exposed to particulate matter now than they ever were before the industrial revolution. Covering them with a dark material changes the albedo. The darker the surface, the more of the Sun’s light is absorbed by the glacier, warming it and melting it. 

Particulates are tiny solid or liquid particles that are present in the atmosphere. They are sometimes termed aerosols as they float in the air. Black carbon (soot) is a particulate released from incomplete combustion. It absorbs the Sun’s light, which actually helps to cool the Earth. However, when it lands on ice, the absorption of radiation speeds up the ice´s melting as the light is absorbed by the dark colour and heats up the ice.


Social and political perspectives:

Knowing that air pollution that reaches glaciers is increasing their melting faster than what would happen from air temperature changes alone, what do you think we can do in terms of laws or behaviour change?

How can we reduce soot and Black Carbon reaching glaciers? Emission control of cars? Banning domestic wood-burning? Have you heard of smokeless coal that can be used in stoves in smoke-free zones? And pellet stoves, are there fewer emissions from these?

Note: You could carry out your own experiment if you are lucky enough to get snow. Prepare two neat snow blocks or two snow-balls of similar size and cover one with gravel or sand and leave the other clean. Watch which one melts first.

Experiments with an Infrared Thermometer

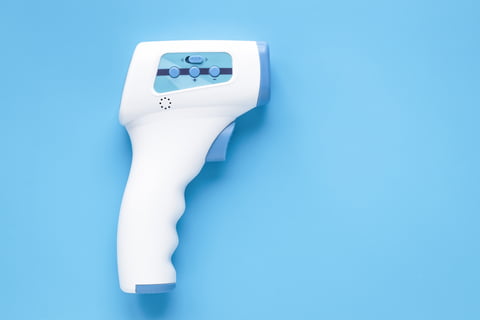
Infrared Thermometer Guidance

Infrared thermometers can be used to explore a range of questions, including:

– What is the temperature of the clouds?

– What is the greenhouse effect?

– If it is sunny, how does the temperature of dark/ light/ reflective things vary?

– Do clothes insulate?

– Which are the best/ worst insulated school buildings?

– What is the temperature of the Sun?

– What is the air temperature?

– How does evaporation depend on temperature?

Which questions you explore will depend on the weather, and level and ability of your students.

Basic Information about the Infrared Thermometers:

The thermometers are used by pointing them at the object you want to measure the temperature of (they don’t have to touch it!) and by pressing and holding the large black button on the front of the thermometer. They detect the infrared (IR) radiation (heat) given off by the object and from it, calculate the temperature of the object. It is the same principle that is used by wildlife photographers to detect animals at night. They do not give an accurate reading from a shiny surface.

Please be aware that the thermometers are equipped with a laser pointer on the front. For safety reasons, these have been covered up, and should not be uncovered. The yellow/ black thermometers have a laser button which should be switched off (no laser symbol on the display screen) to save battery power.

The infrared thermometers we send out have an optical resolution of 12:1 distance to spot ratio. This means that they can measure the temperature of an object which is at least 1/12 of the size of the distance the thermometer is away from the object. So, the temperature of an object 1m high and 1m wide can be measured from up to 12m away, whereas the temperature of a cloud 1km wide can be measured from up to 12km away. The further something is away, the bigger it has to be for you to be able to measure its temperature.infrared thermometer

For experts: The thermometers respond to 8–14 μm (long-wavelength infrared)—this range is not affected by water vapour or CO2 absorption. By integrating the Planck function over this range (Planck’s law describes the amount of energy emitted by a black body as radiation of a certain wavelength), the temperature of the dominant infrared source in the field of view may be obtained.

As an introduction, students could be asked to see what the coldest and warmest objects they can find are. They can compare the temperature of bare skin (face or hands) and clothes. If the sun is not actively heating up dark clothing, then the clothing should be cooler than the bare skin, demonstrating the insulating properties of clothing. By pointing the thermometer into an open mouth (without making contact!) you can get a good estimate of body core temperature.

Activity 1: What effect does colour have on temperature?

This activity works best on a sunny day.
Ask the students to compare the temperature of similar dark- and light-coloured objects. Zebra crossings and cars of different colours standing in a car park are particularly good for this. When asked why, for example, the black strip on a zebra crossing is warmer than the white stripe, students will usually respond that dark colours absorb heat better than light colours. Although this is true, it is the fact that they also absorb light better that is more important in this case. The Sun emits more light than heat. Dark colours look dark because they have absorbed the Sun’s light rather than reflecting it back in the direction of our eyes.

Sunny and shady

If the sun is shining, measure the temperature of the ground (eg tarmac, concrete, grass) in sunlight and nearby in shade.

Wet and dry

Put some water on part of a tarmac or concrete surface and leave it for a couple of minutes. Does the wet bit have the same temp as the dry bit? If not, why not?

Activity 2: What is the temperature of the clouds?

First, point the thermometers at a range of objects in the shade on the ground and get an estimate for the air temperature at ground level. Next, point the thermometer at any cloud (there may well be several types of clouds visible, which will give different results) and measure its temperature. Are the clouds warmer or colder than the ground? So does temperature rise or fall with height?

Temperature falls with height. The Sun warms the ground. The ground warms the air in contact with it (by conduction). The warm air rises, and, as it rises, the air pressure falls (air pressure is due to the weight of air above us. As you go up in the atmosphere, there is less air left above you and so the air pressure falls) and it cools (this is called adiabatic ascent and P/T=constant).

This can be related to the water cycle – as temperature falls, the rate of condensation becomes faster than the rate of evaporation and water droplets form to make clouds.

So why is the cloud base usually flat? It marks the level in the atmosphere where the temperature is just right for cloud droplets to form.

So what are high clouds made of? The highest clouds, called cirrus, are made of ice crystals which gives them their wispy appearance.

You can calculate the height of the clouds by assuming that the temperature falls by 6°C for every km of height (or use 10°C/ km for less able students).

Find a cloud key, chart or wheel to help you name the clouds.

Activity 3: Which buildings are best insulated?

This is a good activity for a cold winter’s day when the Sun is not shining.

Use the IR thermometers to investigate surrounding buildings – what is warmest, walls, windows or doors? The less well insulated a building is, the more heat it is letting out and the warmer the outside of the building will be. Are older buildings less well insulated than newer ones? Where would you recommend the school to invest in insulation?

Activity 4: What is the blue sky temperature?

Ask the students to measure the temperature of any blue sky visible. What are they measuring the temperature of? Some will respond ‘the ozone layer’. Whilst this is technically correct – ozone in the stratosphere absorbs the Sun’s ultraviolet (UV) light and re-emits the energy as heat, the ozone layer is sufficiently high up to not have a major impact on the temperature measured. Greenhouse gases in the atmosphere (water vapour, carbon dioxide, methane etc.) emit heat towards the Earth’s surface and therefore the infrared thermometers.

If the sky is completely blue, how does the temperature vary from the horizon to vertically upwards? Usually, the sky is warmer near the horizon than straight up.the earth's atmosphere

When the thermometer is pointing straight up (yellow arrow) it is looking through a fairly thin bit of the Earth’s atmosphere. When it is pointing towards the horizon (blue arrow) it is looking through much more atmosphere, therefore there is more greenhouse gas and more heat being radiated in the direction of the thermometer.

More Information (page 1 and 4)

Activity 5: What is the temperature of the Sun?

Students should be reminded never to look at the Sun!

If pointing the IR thermometer away from the sun on a clear summer’s day gives a temperature of z and pointing direct at the sun gives y.

Sun to Earth distance DSE is 149,600,000 km

Diameter of spot at this distance = DSE /12

Radius of spot at this distance = DSE /(12×2)

Spot size at this distance =pi(149,600,000/(12×2))2=1.22×1014 km2

Diameter of the Sun, D, is 1,392,000km

Area of the sun is pi(D/2)2 = 1.52×10¹²km2

So, the Sun covers 1.52 x10¹² / 1.22×10¹⁴ , about 1/80th of the field of view.

y = ((79 x z) + (Ts x 1))/80

We have estimated the temperature of the Sun,Ts, between 2500K and 4500K using this method.

The accepted temperature of the Sun is 5778K. Possible sources of error include the fact that the Sun doesn’t emit much radiation in this IR band, and that the atmosphere is scattering the incoming radiation away from a straight line path from the Sun to the thermometer, reducing the reading.

Activity 6: What is the air temperature?

Air temperature is not easily measured with an IR thermometer. However, to get a reasonable estimate, we suggest using sheets of A4 white paper. They will only take a few minutes to adjust to the local temperature (as would any other thermometer) and could be placed on the ground in different locations, or hung off bushes etc. with clothes pegs or bluetack. The IR thermometers can then be used to measure the temperature of the paper.

Activity 7: How do Evaporation Rates depend on temperature?

The Key Stage 2 National Curriculum asks students to investigate the effect of air temperature on evaporation rates. However, wind speed and sunlight can play a much larger role, swamping the signal from air temperature. By measuring the temperature of the object using an infrared thermometer, rather than the air temperature, you should get much better results, as the temperature of the object will reflect the amount of sunlight it is absorbing as well as any wind chill.

 Object Temperature (oC) Is it sunny or not?
 White car  
 Black car  
 Grass  
 Tarmac  
 Object in sunshine  
 Object in shade  
 Dry tarmac  
 Wet tarmac  
 Cloud (what type?)  
 Cloud (what type?)  
 Blue sky  
 Your forehead  
 Your clothes  

Use this table to write down the temperatures of things you measure. Choose some things of your own to measure and write their temperatures in the last few rows.

Borrow an Infrared Thermometer

Did you know the Royal Meteorological Society lends instruments to schools free of charge?

What is the Dew Point?

What is the Dew Point?

Learn about humidity

The dew point is the temperature at which, with a given amount of water vapour in the air (‘humidity’), water vapour will condense to form cloud droplets, if particles are present for the droplets to form on (see ‘clouds in a fizzy drink’ experiment).

Equipment

◊ An empty, clean tin can (e.g. baked bean tin) with the lid removed leaving no sharp edges.

◊ A thermometer

◊ Some crushed icea tin can

Method

1. Put the thermometer in the can and half fill it with tap water.

2. Cool the water slowly by adding a little ice at a time and waiting for the temperature to fall. Stir and wait for the ice to melt before adding more ice. When you first see condensation forming on the outside of the can, read the thermometer. If your thermometer reaches 0ºC and no condensation has formed, add salt and ice to get the water to cool below freezing. The temperature at which condensation first forms is the dew point of the air. How much cooler is the dew point than the air temperature outside?

So how does this relate to atmosphere?

The air temperature falls by about 6ºC for every 1000m you go up in the atmosphere. You can use your dew point to calculate how high up you would expect clouds to form.

You can also try the ‘DIY hygrometer’ experiment to check your dew point temperature.clouds in the sky

Where can I find more information?

How clouds form

An article from Physics Review

An article from Catalyst

Or why not have a go at making a cloud in a bottle

More experiments and demonstrations

Watch the Water Cycle

Watch the Water Cycle in a Bag

Equipment

plastic bag filled with water

A clear plastic ziplock type bag

A little water

Method

1. Put a small amount of water in the bag, then blow into the bag and try to trap some of the air in the bag whilst sealing it.

2. Place the bag on a sunny window sill, or over a radiator.

Some of the water will evaporate, rise and condense on the sides of the bag, and then run back down to join the water in the bottom of the bag. This is a simplified, miniature version of what happens in the atmosphere. The water at the bottom of the bag is like a sea or ocean, the condensation on the sides of the bag is like clouds, and the water running down the sides of the bag is like rain.

Why not draw a simplified picture of the water cycle on the outside of the bag? It should show the sea/ lakes/ rivers, evaporation, condensation, clouds and precipitation.

Where can I find more information?

Find out more about the water cycle

More experiments and demonstrations

Fronts in a Fish Tank

Weather fronts

We get different sorts of weather because of the way warm air and cold air move around us in the atmosphere.

What you will need:

  • A large, clear tank (an empty fish tank would be ideal)
  • Warm and cold water
  • Two plastic cups
  • Small stones (pebbles)
  • Food colouring

What to do:

  1. Fill the tank with normal water and leave this for a few hours to come to room temperature.
  2. Place a few small pebbles in each of the two cups to act as weights.
  3. Pour some hot water and a few drops of red food colouring in one of the cups.
  4. Fill the other cup with very cold water and add some blue food colouring.
  5. Place the two cups into the water at the same time, one at either end of the tank – the pebbles should hold the cups at the bottom.
  6. Carefully watch how the two different coloured waters move. You should see that the warmer red water should rise to the top, and the cooler blue water should sink to the bottom.

Warm air (shown by your warm red water) is less dense than cold air (cold blue water), so warm air rises and pushes down with less pressure than cold air. As air cools, it becomes denser, so it sinks and also pushes down with greater pressure.

You will need

a fish tank


Web page reproduced with the kind permission of the Met Office

Tricks with a Hair Dryer

Can you balance a ball over a hairdrier?

Learn about the Bernouilli Effect

Equipment

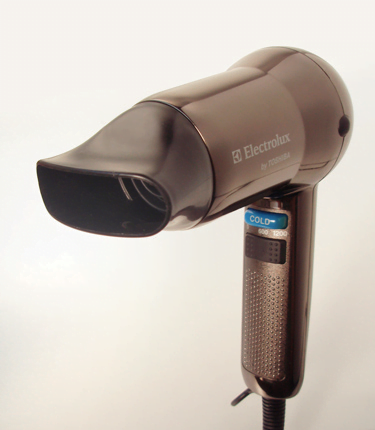
  1.  A hairdrier
  2.  A ping pong ball or other light plastic ball
  3.  A tube just wider than the ball

a hairdrier


Method

1. Switch the hairdrier on with the air flowing upwards. Can you balance the ball in the airflow? Try moving the hairdrier around and tilting it.

2. Now hold the tube vertically over the ball – what happens?

As you move the hairdrier around, air flows faster on one side of the ball than on the other. The faster the air flow, the lower the pressure (Bernoulli’s principle) and the ball moves towards the lower pressure, keeping it above the hairdrier. When you place the tube over the ball, the air is funneled through the tube, it cannot spread out as much and creates lower pressure in the tube. The ball is rapidly sucked up the tube.

How does this relate to the atmosphere?

Rain and hail will be suspended by the updraft inside a thunderstorm until the weight of the hail and water can no longer be supported. Usually, the stronger the updraft in a thunderstorm, the more intense the storm and the larger the size of hail that can be produced.

More experiments and demonstrations

Galileo Thermometer

Make your own Galileo Thermometer

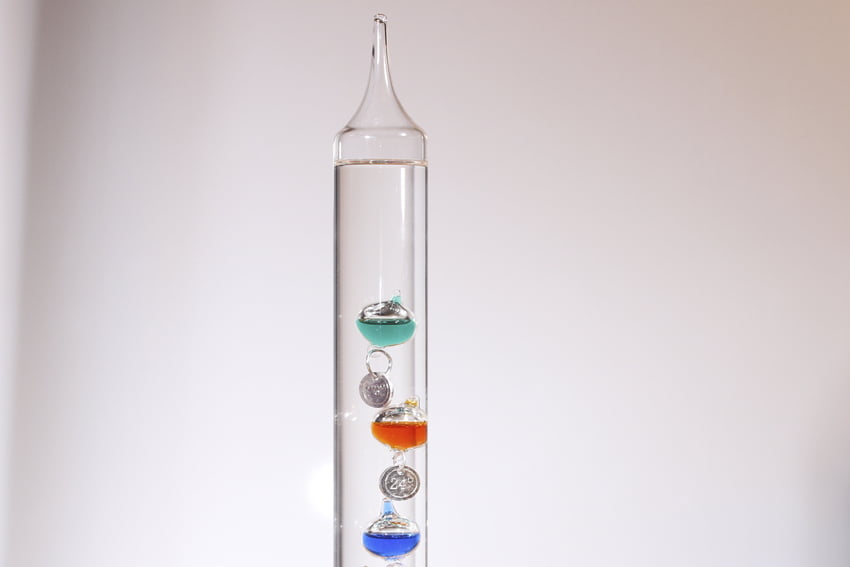
galileo thermometer

This is a very tricky experiment to get right.

Equipment

  • A small fish tank or similar clear sided container
  • 8 small baby food jars or similarly watertight, lidded containers
  • Sand
  • Water
  • Vaseline or silicone sealant
  • Digital Scales and a measuring cylinder

Method

1. Clean the jars and work out what their volume is – the easiest way to do this is to see how much volume they displace when you put them in a water-filled measuring cylinder. Mark the bottles with temperatures from 5-30°C in 2.5°C intervals.

2. Add some sand to each bottle so that you end up with the densities on the next page, remembering that density = mass/ volume. This is the tricky part! If you want to span a wider temperature range, look up a density chart for water on the
web.

3. Seal the jars with a thin layer of petroleum jelly or sealant and screw them tight shut, then put them in the fish tank full of water. Add ice and/ or hot water to the tank to change the temperature, and watch the bottles sink/ rise!

Alternatively, you can add a different mass of sand to each jar and then, using an alcohol in glass thermometer, determine what the water temperature is when they rise.

Temperature Table

Temperature (oC) Density of bottle g/cm3
 5 0.99997
 7.5 0.99988
 10 0.99970
 12.5 0.99944
 15 0.99910
 17.5 0.99869
 20 0.99820
 22.5 0.99766
 25 0.99704
 27.5 0.99637
 30 0.99565

How does it work?

Liquids such as water often expand much more than solids such as glass or metal when they are heated.

Objects float in water if the weight of water they displace is more than their own weight; if the weight of water displaced is less than the object’s weight, it will sink. The weight of an object does not change with temperature. The density (weight per unit volume) of a liquid changes with temperature because although the total weight is constant, the total volume changes.

More experiments and demonstrations

Reflective Surfaces

How reflective is that surface?

Learn about albedo

The albedo is a measure of the proportion of electromagnetic radiation that is reflected by a surface. The rest is absorbed and then reradiated, usually at a different wavelength depending on the temperature of the surface. So, for example, if a surface has an albedo of 0.3, then 30% of the light that hits it will be reflected. The rest will be absorbed.

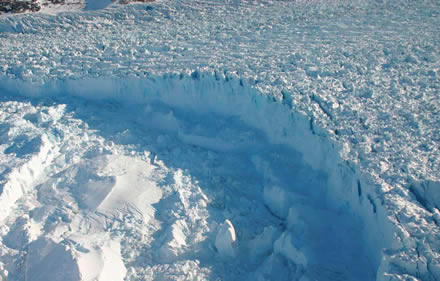
a glacier

Equipment

  1. 2 ice cream tubs or similar, one painted black inside
  2. 2 thermometers
  3. Thick polystyrene to encase the tubs
  4. Clingfilm
  5. One large lamp or two identical small ones, with low energy light bulbs

Method

1. Cover the sides and base of the ice cream tubs with polystyrene.

2. Place a thermometer in each tub and cover the tubs with cling film to stop convection (warm air rising and escaping from the tub).

3. Put the tub under the lamp, or lamps.

You should see the temperature in the black tub rise faster than in the white tub. The black tub will absorb the light and warm up, which will in turn warm the air inside it. The white tub on the other hand will mainly refl ect the visible light from the lamp. Beware, if you do this experiment with a ‘normal’, high energy light bulb that emits heat (infrared radiation), you may fi nd that the air in the white tub gets warmer as well.

So how does this relate to atmosphere?

As the albedo of the Earth changes due to changing climate (e.g. ice melting, changes in the amount of level of cloud cover) this will have a positive or negative feedback on the temperature of the atmosphere. Typical values of the albedo are 0.15-0.8 for clouds, depending on thickness and height, 0.8-0.9 for snow and ice, 0.35 for desert, 0.1-0.2 for forests and cities, 0.05-0.5 for water.

More experiments and demonstrations