This tool is best used on a laptop or other larger screen and may not function correctly on a phone.
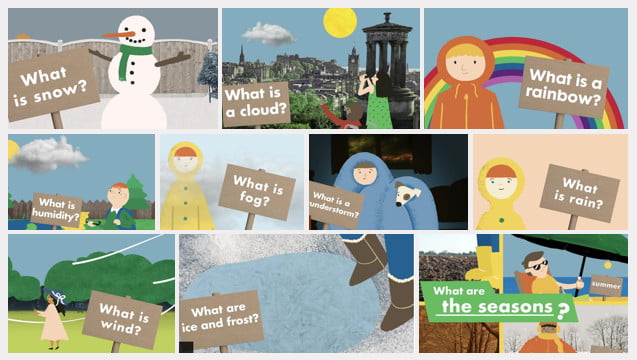
We were delighted to support BBC Bitesize Scotland in the creation of these 21 videos for primary schools. Here are some of our best resources to support the teaching of these topics:
[all images on this page are copyright of the BBC]
How is Struay similar to, and different from, where we live?
Overview
In this series of activities children will be exploring similarities and differences between their own locality and the island of Coll (the fictionalised isle of Struay in the Katie Morag books). They will draw on what they have learnt already, in order to compare landscapes, weather, people and transport on Coll with their own locality. They will be introduced to the effects of climate on landscapes and that people design houses to keep out the weather.
Objectives
Children should learn:
Look at the slides and use for discussion about the weather and housing. Any information about houses and landscapes can then be used in activity two.
Lesson resources
Daily weather forecast for Coll.
An island home – Slides for use with activity 1.
Organise children into small groups:
You will need:
Maps of the Isle of Coll
Photos of Coll and locality
Photos of houses on Coll
and Katie Morag story books.
Ask the children to use the differentiated worksheets to make a list of ways where they live is the same and different to the isle of Struay, where Katie Morag lives.
An island home (High ability): PDF document comparing the Isle of Struay with where we live.
An island home (Low ability): PDF document comparing the Isle of Struay with where we live.
Web page reproduced with the kind permission of the Met Office.
Other Recommended Resources:
Some lesson ideas from the States including poetry, art and music.
Seasons resources from NGfL-Cymru
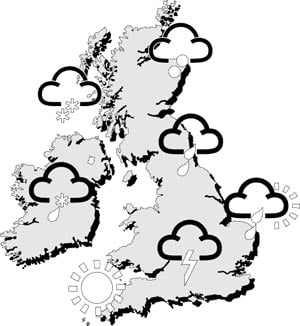
Weather symbols from the Met Office
Or how about making a weather tree to record the daily weather?

 It was reported in The Times newspaper on 15 April 1986 that a hailstorm lashing Dhaka, the capital of Bangladesh, had killed nearly 50 people and injured more than 400. The storm had brought winds of about 60 mph and hailstones weighing up to 2 lb (nearly 1 kg). Houses had been flattened, communications disrupted and the windscreens of more than 700 cars shattered. In such conditions, an umbrella was no use whatsoever; even a riot shield may not have provided adequate protection! According to Dick File, in Weather Facts (Oxford University Press, 1991), this storm (which struck on 14 April 1986) killed 92 people and produced hailstones that weighed 1.02 kg.
The heaviest hailstones to fall on the United Kingdom did so at Horsham, West Sussex, on 5 September 1958 and weighed 140 g. They were almost the size of a tennis ball. When they hit the ground, they were travelling at speeds in excess of 100 mph (50 m/s). If you find this surprising, do a little calculation, using the formula:
V2 = u2 + 2as where u is the initial speed, v the terminal speed, a the acceleration (in this case, due to gravity) and s the distance travelled. For a hailstone falling from a height of 500 m through still air, v = 100 m/s! The impact of a missile the size of a tennis ball travelling this fast is much more serious than that of a cricket ball hit for six.
Should you ever get the chance, collect some large hailstones and cut them in half. You may find a layered structure, with alternate layers of clear and opaque ice (as in the picture on the right, which shows a section of a hailstone viewed by transmitted light). The layers are acquired in different parts of the storm clouds. As hailstones fall, they collect tiny water droplets, which flow around them and freeze. If no air is trapped, the ice is clear.
The storm which struck the Wokingham area of Berkshire on 9 July 1959 produced hailstones more than 2.5 cm in diameter. This storm was studied in detail by Professor Frank Ludlam of Imperial College and his team of co-workers, who produced a striking three-dimensional model of the airflow with-in the storm and explained how large multi-layered hailstones may form in such weather systems.
In the diagram on the right, streamlines of air in which condensation occurred are shaded. The surface areas affected by rain and hail are shown by, respectively, grey and black shading. Heights are shown in thousands of feet. Precipitation formed in air which entered the storm near position H. As shown, the precipitation was carried across relative to the storm to around 13-15,000 feet, whereupon it fell and re-entered the strong updraught near posit-ion O. Some precipitation particles reached altitu-des of 30,000 feet or more and grew into large hail-stones before falling again, forward of the strong updraught, near position H’. The storm moved from left to right, with rain on its left flank and a squally ‘gust front’ (shown as a cold front) on its right flank. Behind the storm, chilled air reached the ground.
The diagram on the right shows a vertical section through a typical severe hailstorm (moving from right to left) and is also taken from Ludlam’s 1961 article in Weather. Compare this diagram with the three-dimensional model above
The paths of the air are drawn as if the storm was stationary. They are, therefore, relative streamlines. The dashed lines are trajectories of small hailstones. The thick full line shows the trajectory of a large hailstone.
To some extent, the features shown on this vertical section occur also in vigorous cumulo-nimbus systems which do not produce large hail. Students can look out for mamma, the udder-like cloud feature that hangs under the anvil and other parts of the cloud. How are mamma formed? Students can also observe gust fronts and measure the temperature drop that occurs when a storm passes. It is often several degrees Celsius. Perhaps, with the help of someone who has a car, they can map areas of rain and hail relative to moving storms.
In severe storms, downdraughts may be as strong as 30-40 m/s and reach the ground as ‘down-bursts’. These are dangerous, as the diagram above shows. Downbursts spread out near the ground. An aeroplane that flies into such an outflow first encounters an increasing head-wind (at 1 and 2), which adds to the speed of the speed of the air flowing over the aircraft’s wings and thus increases lift. At 3, however, the strength of the downdraught begins to reduce the altitude of the aircraft; and at 4 and 5 the aircraft experiences both a tail-wind (which reduces air speed and lift) and a downward force from the downdraught. Over the years, there have been many air disasters caused this way, especially in North America.
On 15 August 1952, the village of Lynmouth in North Devon was devastated by a torrent of water which poured off Exmoor; 34 people died. On 29 May 1920, in and around the Lincolnshire town of Louth, 22 people died when water from a storm over the Wolds caused the River Lud, normally a small stream, to rise 5 m above its normal level. In Dorset and Somerset, there have been similar occurrences; and in all cases, severe storms caused the havoc. When such storms occur in the British Isles, the wind in the upper troposphere is typically from the south-west, with the wind in the lower troposphere from a north-easterly point (and pressure low to the south and south-west). If this flow is lifted orographically, the storm may become stationary and deposit several inches of rain in a short time. Thus, it is places below slopes that face northwards or north-eastwards that are most at risk.
To frighten away the evil spirits that caused hail, primitive tribes used to shoot arrows into storm clouds; and Christians have tried to exorcise these spirits by ringing church bells (a dangerous practice because of lightning strikes on bell towers). Not only arrows, but also cannon-balls, artillery shells and rockets have been fired into storm clouds, but all to no avail. Though there is some evidence that cloud seeding may help to reduce the size of hailstones, there is nothing we can yet do to prevent the formation of severe storms.
Overview
This is a “Weather” game for use with an upper KS1 class, looking at seasonal and daily weather patterns. Differentiation is easy within a class by using different sets of question cards. Print sets on different coloured card so that pupils are not aware that some of the questions are different. Weaker readers could be supported by a classroom assistant.
What to do
The game consists of a journey through different ‘stations’ in a classroom or hall. At each station the pupil (or group) must answer a question with 3 possible answers. Choosing the correct answer will lead to the next venue and the final one will take you back to where you started. Pupils do not know the order in which they have to visit the stations and, as it is circular, groups can start at different places. Incorrect answers result in penalties which can either send pupils back to somewhere they have already visited or describe another task. At each station pupils collect a piece of interesting information. These can then be used for extension work for the whole class or for the more able pupils.
Preparation
There are 8 stations, 2 alternative sets of question cards with three possible answers for each question. Print one set of questions for each student or group. The second set is easier.
Other Recommended KS1 Resources:
Some lesson ideas from the States including poetry, art and music.
Seasons resources from NGfL-Cymru
Weather symbols from the Met Office
Or how about making a weather tree to record the daily weather?
It might be useful for you to know the conversion of units commonly used in meteorology for use in the classroom.
Fahrenheit to Celsius
To convert a Fahrenheit temperature reading to Celsius: first deduct 32 and then multiply the value you get by 5/9.
e.g. 59°F = (59-32)x(5/9) = 27×5/9 = 15°C.
Celsius temperature reading to Fahrenheit
To convert a Celsius temperature reading to Fahrenheit: first multiply by 9/5 and then add 32.
e.g. 20°C = (20×9/5)+32 = 36+32 = 68°F.
To convert inches to millimetres
1 inch = 25.4 mm
To convert millimetres to inches
1 mm = 0.03937 inch
To convert wind-speed units:
[kt = knot; m/s = metres per second; kph = kilometres per hour; mph = miles per hour]
1 kt = 0.515 m/s and 1 m/s = 1.94 kt;
1 kt = 1.853 kph, so 1 kph = 0.54 kt;
1 kt = 1.152 mph, so 1 mph = 0.87 kt.

We first need to understand that there is a difference between weather and climate. Weather is all around us. It is a description of what’s happening with the air, sun, rain and wind when you go outside. This can be during a period as short as a few minutes or a few hours, or as long as a few days or even weeks.
Climate is the average weather conditions at a particular place over a long period of time (for example, more than 30 years).
There is an old saying which sums this up: “Climate is what you can expect, weather is what you get”.
Climate is different all over the world. In the United Kingdom we have a temperate (mild) climate. It’s neither very hot nor cold, and neither very dry nor very wet. At the the North Pole the climate is much colder than ours in the UK. In the Sahara Desert it is very hot and dry, and in the Amazon rainforest it is hot, but it rains a lot throughout the year.
Most scientists now believe that the changes we are seeing to the world’s climate are partly due to the actions of humans. They talk about ‘global warming’, meaning that the climate of the world as a whole is getting hotter. This is what people call ‘climate change’.
Has climate changed in the past?
The Earth was formed around five billion years ago and we know ever since it has had lots of different climates. These changes have included polar regions without ice, to ice sheets across much of the northern hemisphere, including the United Kingdom.
Tree rings
The last ice age which covered most of the United Kingdom melted away about 10,000 years ago. Since then, the UK’s climate has sometimes been warmer and sometimes cooler than it is now.

We know all this from studying things like fossils, trees and glaciers. Fossils provide lots of useful information about the climate. Some animals can only live in warm places. So if you find their bones, you’ll know they lived in a warm place – even if that place is now in the cold (polar) regions.
By looking at the rings in a tree you can tell how old it is – every year a tree grows, it adds another ring – but also what the weather was like. The size of the tree ring is affected by the amount of rainfall as well as the local air temperatures in the growing season.
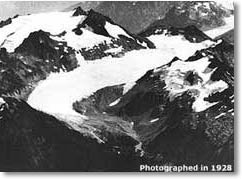
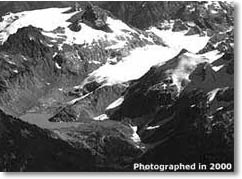
The retreat of the South Cascade Glacier, Washington State between 1928 and 2000. Images courtesy of USGS.
The size and positions of glaciers is a good indication of the climate on the Earth – the more ice coverage, the colder the planet.
In a recent study of glaciers for the period 1900–1980, it was discovered that 142 of 144 glaciers around the world were getting smaller. Warmer summer temperatures can result in the glacier losing more ice from the bottom than it is getting from snowfall at the top.
Has the climate changed recently?
Human weather records, tree rings and information from glaciers and fossils show that there has been a big change in the climate over the past few hundred years.
In Europe, we know there was a warmer period during the 14th century. This was followed by a quite sudden change to cooler weather in the 15th century. This cooling carried on until we had what some people call the ‘Little Ice Age’ in the 17th and 18th centuries.
Since then, during the 19th and 20th centuries, and especially this century, we have seen our climate warming up. The evidence for this mostly comes from measurements of temperature. The measurements show that the warming up is getting much faster than we have ever seen before.
The graph below shows what scientists know has happened to temperatures over the past 150 years. Although you can see small drops in temperature for a few years at a time, the line does clearly show that temperatures have risen over the past 150 years.
Should we trust the evidence?
Harvesting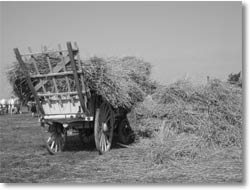 Scientists and others have found lots of very useful information in books from the past few hundred years. These books include personal diaries written by people at the time, telling us how the weather affected them in their daily lives.
Farmers have also kept valuable records of when they planted out seeds and harvested their crops. These records are very useful to scientists, as they only do this when the weather is right. The dates when harvests were good and bad are usually written down. These records provide really useful information, although they are not actual weather records.
Historical weather records and the evidence from things like fossils and ice give us a much better idea of how climate has changed over many thousands of years.
As an example, in places like Siberia, in the north of Russia, the ground is frozen all year round, and has been for thousands of years. This deeply-frozen ground is called permafrost. Because of rising temperatures around the world, some of the permafrost is now thawing out which may cause further global warming, as scientists know that when permafrost thaws out a lot of methane, which is a powerful greenhouse gas, is released into the air.
Old weather records There are many, very old weather records that scientists use to see what the weather was like a long time ago. But not all – especially those about 300 years old – contain all the information they should.
Also, in the past, the instruments that recorded the weather were too expensive for most people and did not work very well. But, fairly accurate measurements of temperature, rainfall and air pressure have now been possible for a long time.
All of these weather records are now being used to see what the weather and climate has been like for the past few hundred years.
What do the weather and climate records tell us?
The old weather records show that we are now seeing much higher temperatures. Also, temperatures during the past 30 years are getting much warmer, much faster than we have seen for a very long time.
However, some of these changes could be caused by other things.
As villages become small towns and continue to grow, weather records (especially temperatures) are going to be affected by all the new houses.
The instruments that measure the weather are sometimes moved to other places.
The equipment used to record the weather now has become more accurate.
All of this can make a big difference to how scientists use the information.
What is causing global warming?
A major cause of global warming is known as the ‘Greenhouse Effect’. In a greenhouse the temperature inside begins to rise above the temperature outside when the sun shines on it. This is because the sun’s heat gets trapped inside.
In the air, there are several gases that do the same thing as the glass in the greenhouse. The three ‘greenhouse’ gases that do this the most are called water vapour, methane and carbon dioxide.
While humans don’t create much water vapour in the air, we do make methane and carbon dioxide. Methane comes from several places, including agriculture (livestock), wetlands and landfill sites, and is a very powerful greenhouse gas.
When humans burn forests, oil and gas, it also makes huge amounts of carbon dioxide. In terms of global warming, carbon dioxide is the most important greenhouse gas.
Over the past 50 years, scientists have measured a steady increase in the amount of carbon dioxide in the air. This extra carbon dioxide has been shown to help warm up the whole Earth.
In fact, since the Industrial Revolution started around 200 years ago, the amount of carbon dioxide in the air has increased by 30% – mostly due to human activities.
The amounts of two other important greenhouse gases in the air, methane and nitrous oxide, are also increasing.
In fact, we now have more carbon dioxide and methane in the air than the earth has seen for at least 650,000 years.
Can anything be done about climate change?
There is more and more evidence that human beings are the main cause of the increase in two main greenhouse gases in the air; methane and carbon dioxide. Farming and wetlands are some of the biggest sources of methane. The burning of fossil fuels (like coal and gas), cement production and the burning of forests by humans is the biggest cause of the increase in carbon dioxide in the air.
On current scientific evidence, ‘global warming’ could be slowed if the amount of greenhouse gases in the air were reduced.
You can play your part. Perhaps use the bus or try to walk to school, instead of using a car. Changing to the energy saving light bulbs is also a good idea, as they use only 20% of the electricity used by a normal light bulb. And recycling as much as possible can save huge amounts of energy.
Web page reproduced with the kind permission of the Met Office

Poems and songs about the weather for children and schools
There are lots of songs and poems about the weather. Why not practise singing the ones here on this page? Or you could make up your very own song using your favourite weather words!!
TIPS: Tapping your fingers on a table sounds like raindrops, stamping your feet sounds like thunder, blowing sounds like the howling wind and you could even make shivery noises for the cold!!
Poems

Rain & Sun
Christina Rosetti

Wind
Christina Rosetti

Wind Poem 2
Christina Rosetti
We also like the following poems by more recent poets – see if you can find them in a poetry book!
Anything from The Book of Clouds Juris Kronbergs
The More it Snows A.A. Milne
Snowflakes Helen Moore
Snow Alice Wilkins
Winter Ocean John Updike
Winter Morning Ogden Nash
It s never Fair Weather Ogden Nash
Fog Carl Sandburg
Winds light to disastrous Spike Milligan
Storm Roger McGough
Rain George MacBeth
Glass Falling Louis MacNeice
Clouds Aileen Fisher
The Fight of the Year Roger McGough
Flooding may result from a large amount of rain or from rapid thawing of snow and in coastal regions may also be caused by a storm surge or a combination of high tide and high river level. The consequences of flooding are often disastrous but there can also be beneficial effects of flooding.
 Storm surges are mainly caused by the effect of the wind on the sea, not changes in atmospheric pressure. The effect of wind on the sea surface is known as wind stress. The wind stress on the surface of the sea causes the water level on a coast to rise if the net transport of water is towards land and to fall if it is away from land.
Many coasts are at risk from storm surges and these include the Atlantic side of the United States, the Bay of Bengal area around India, Thailand and Indonesia, the coastal areas of the Netherlands and eastern England coastline. At the head of the Bay of Bengal large storm surges (up to 4m in height) are initiated by hurricane force winds coupled with low pressure tropical cyclone systems. Fortunately for the UK surges large enough to bring about catastrophic flooding of these North Sea coasts are experienced only a few times each century, and improved sea defences should stop all but the most extreme surges. On the Indian sub-continent, especially near the mouths of the River Ganges, death tolls from storm surges caused by tropical cyclones have been huge. In 1970, for example, more than 200,000 died when such a surge struck the area. Here, as in other places where storm surges occur, the sam
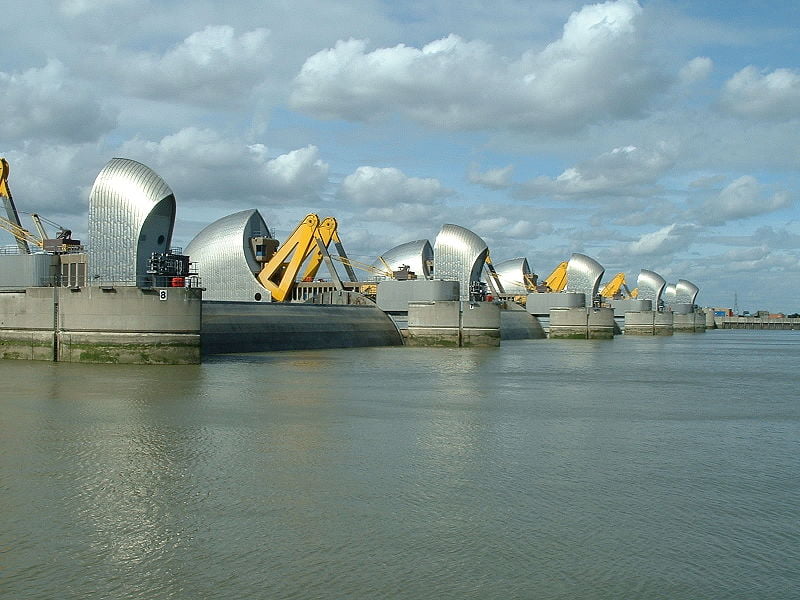
 Flooding of the Thames on 6th -7th January 1928 highlighted the need to find ways of forecasting storm surges. However, the real push to investigate storm-surges was on 31st January and 1st February 1953, when, a surge exceeding 2.7 metres at Southend in Essex and 3.5 metres in parts of Holland killed 307 people died in eastern England and 1,800 in the Netherlands. The storm that caused the 1953 surge was among the worst to hit the UK in the 20th century. Before the storm’s low pressure and storm-force northerly winds raised water levels in the southern North Sea, hurricane-force winds blew down more trees in Scotland than were normally felled in a year; and a car ferry, the Princess Victoria, on passage from Stranraer in Scotland to Larne in Northern Ireland, sank with the loss of 133 lives. Only 41 of the passengers and crew survived. Nowadays, surges are forecast with considerable accuracy and storm-surge barriers are in place in the most vulnerable places in the Low Countries and eastern England, one of them on the Thames a (south of Greenwich).
 When pressure falls by one millibar, sea level rises by one centimetre. Thus, a deep depression can cause sea level to rise 60 or 70cm above the level predicted purely on the basis of tidal theory. The pressure-induced rise in sea level caused by a tropical cyclone can be much greater, maybe a metre or more.
 One of the most energetic and destructive of all weather systems are tropical cyclones. The hurricane-force winds can reach 50m/s and torrential rain falls from their towering cumulonimbus clouds.flooding The winds can cause disastrous surges on coasts and the downpours of rain can cause serious flooding. Power and water supplies are disrupted, buildings are damaged, crops are destroyed, people and livestock are drowned, bridges collapse, roads and railways are undermined or blocked by debris, and beaches are scoured. Tropical cyclones nearly always leave behind a trail of destruction and misery.
 Flash floods are exceedingly dangerous. When water cannot percolate into the ground, it runs off the surface as it would from impermeable concrete. This is particularly so when the ground is very wet or when baked hard after a hot dry spell. Potholers can be especially at risk, such as on 24 June 1967, when five drowned in Yorkshire. The water which fell in a heavy thunderstorm after a spell of dry weather ran off rapidly into underground streams and caverns at Mossdale. The rise in water levels below ground was too rapid for the potholers to scramble to safety.
 In terms of water flow, the Mississippi is the sixth largest river in the world. Its annual average flow rate is 14,000 cubic metres per second and it discharges into the Gulf of Mexico 580 cubic kilometres of fresh water per year. The greatest flows occur in the period March to May and the least in the period August to October. A large proportion of the United States is drained by this river.
To protect against flooding, which would otherwise occur frequently, the Mississippi River is constrained by levees (embankments) all the way from the State of Missouri to the sea. This barrier, much of it concrete, has isolated the river from a lot of the surrounding countryside, but without it and other means of dealing with excess water in the river, low-lying cities such as New Orleans could not exist.
Tragically, some of the levees around New Orleans were breached on 29 August 2005 when they failed to withstand the battering imposed by the waves and a storm surge generated by Hurricane Katrina. Flood depths reached six metres in places and more than 1,000 people died.
Despite levees, spillways, reservoirs, pumping stations and other constructions, flooding does still occur. The flood-control system proved incapable of containing the flood of 1973, for example, and again proved inadequate in the summer of 1993, when abnormally high rainfall over central parts of the United States caused extensive flooding of the upper and middle Mississippi and lower Missouri rivers. The city of St Louis was particularly badly affected. Discharges of water from the Mississippi into the Gulf of Mexico in the late summer of 1993 were abnormally high. A study using satellite imagery showed that water from the Mississippi spread out far and wide off the States of Louisiana, Texas and Alabama. Indeed, some of the Mississippi water passed through the Florida Strait into the Atlantic.
 There was rain, more rain and even more rain in northern California soon after Christmas 1996. From 29 December 1996 to 4 January 1997, depression after depression from the central Pacific brought rain to northern California. As the air was unusually warm, a consequence of the precipitation was that large amounts of snow melted. During the week of the storms, 61 cm of rain was recorded. Significant flooding occurred in northern California and southern Oregon and 43 counties were declared disaster areas. Flooding occurred rapidly because soils became saturated and amounts of snowmelt were large. Flood-control reservoirs could not cope, as their storage capacity was no more than moderate because of near-normal rainfall and run-off prior to the onset of the severe weather. Levee failure occurred on several rivers.
After the United Kingdom’s snowy winter of 1947 came the thaw. In many parts of the British Isles in February and early March 1947, deep drifts of snow, some five metres or more deep, caused villages and hamlets to be cut off for days on end. Then, on 10 March, warm air and rain edged into south-west England and advanced across the British Isles. By 13 March, floods were widespread. Vast areas of Fenland, the Severn Valley and other parts of Britain were submerged. At Selby, Yorkshire, three-quarters of all the houses were under water. A severe south-westerly gale on 16 March drove water ahead and caused dykes in the Fens of eastern England to burst. Warm air and rain are much more effective at thawing large quantities of snow than sunshine. The albedo of old snow (proportion of light reflected) is about 55%. The albedo of fresh snow is about 80%.
On 9 and 10 April 1998, just before Easter, prolonged heavy rain fell over a wide area of Wales and central England. In the Midlands of England, there was serious flooding, with Northampton and Leamington Spa badly affected. In these Easter Floods, as they have come to be known, 4,500 homes were inundated, five people died and the estimated cost of the damage exceeded £350 million. The culprit was a slow-moving depression centred over Brittany. North of it, lying east-west across the Midlands, there were two parallel fronts which were almost stationary, producing prolonged heavy rain that fell on a catchment that was already saturated.
snowflakeIn coastal regions, flooding may be caused not only by a storm surge but also by a combination of high tide and high river level. An example of the latter occurred in South Wales in 1979. On 26 and 27 December of that year, falls of rain exceeded 100mm in many places, especially over the hills. Extensive flooding occurred on the 28th. Cardiff was badly hit when the River Taff in spate met a high tide from the Bristol Channel. Hundreds of homes and offices near the city centre were inundated. Flooding with sea water is bad enough, not least because the salt in the water is left behind when the water evaporates, but the flooding in Cardiff on this occasion was particularly unpleasant, as the water welled up into streets and houses through the sewers.
 In many parts of the world, there are serious health risks after disastrous flooding. Mosquitoes, flies and other insects may become more abundant than usual, as the filth, debris and stagnant water left by the floods provide suitable breeding conditions. Consequences may include out-breaks of typhoid, dysentery and encephalitis. Rats and mice displaced from their natural habitats may find conditions to their liking in houses, sheds, barns and other buildings.
 In some parts of the world, snakes also become a problem after flooding, as they, too, are displaced from their natural homes by the water. Quite often, they appear inside houses. However, snakes can be beneficial, as they help to reduce populations of rodents.
 Some of the most fertile land in the world lies beside rivers, the Nile valley being the classic example. For thousands of years, the people of Egypt have relied upon the waters of the Nile to overflow their banks every year, carrying with them fertile silt that makes agriculture possible. The flow of this river is nowadays controlled by means of the Aswan High Dam, an operation that can have its advantages and disadvantages. Salinity levels in the Nile Delta have increased, for example, because the outflow of fresh water from the river is much less now than before the High Dam existed. On the other hand, availability of water from the lake behind the dam, Lake Nasser, has allowed water levels downstream to be maintained in drought years, thus benefiting agriculture when in olden times crop failure and famine might have occurred.
 The Ganges Delta is another place where flooding brings benefits for agriculture. Here, every June to October, the waters of the Ganges, Brahmaputra and other rivers overflow and inundate the countryside. There is, however, no equivalent of the Aswan High Dam to control the waters of the Ganges Delta. Sometimes, crops are destroyed, hamlets ruined and humans and animals drowned.
In some arid regions (e.g. Namibia and central Australia), floods occur very occasionally. When they do, glorious displays of flowers follow. In these areas, seeds can lie dormant for many years and germinate (grow) very rapidly when the rains come.
 The heavy rains brought by tropical cyclones can help revive crops and replenish water supplies. Sometimes, fruit trees have flowered and borne fruit a second time after the passage of a cyclone. Sometimes, floods have flushed away mosquito breeding areas. There is a danger, however, that residual pools of water will, in turn, become mosquito breeding areas.
© 2024 Royal Meteorological Society
RMetS is a registered charity No. 208222