A Weather Station for your School

Why you need one; what to buy; where to put it; what to do with the data.

Geoff Jenkins 2014

Why does our school need a weather station?

There are lots of reasons why a weather station will be welcomed as a valuable new resource to the school. Some of those given below are more suited to primary schools, others to secondary ones.

  • The National Curriculum requires weather to be measured. Weather and climate feature several times in the new (2014) English National Curriculum for geography. In science, the Year 1 PoS requires that “pupils should be taught to observe changes across the four seasons, and observe and describe weather associated with the seasons”. Guidance suggests that “Pupils should observe and talk about changes in the weather, and work scientifically by making tables and charts about the weather.”  And in Years 3 and 4 they should “make systematic observations using … thermometers and data loggers”.   
  • Weather also links naturally into many other subjects such as History (weather affecting the outcome of battles, eg D-day), ICT (make your own instruments, weather blog/website, linking to the internet), Maths (analysing and plotting real-world data), English (write stories about unusual weather – maybe even get the local paper interested in printing a routine report), Art (Turner, Constable, etc) and even Sport (performance in different conditions).
  • Having a display of current weather, perhaps in the school’s main foyer, is a great general resource and talking point, especially at times of unusual weather – hot days, cold mornings, torrential rain and so on. In primary schools this can get pupils used to thinking scientifically, using units (ºC, mm of rain, etc.) and decimals.  They will also learn to associate measurements of weather with their personal comfort, for example outside at break time. It can also help with practical decisions, eg has there been too much rain today to allow the playing field to be used?
  • Even a cheap weather station can be linked to a computer, so that readings from the weather station can be shown on the school’s website; this will impress parents and prospective parents. If the school is in a village or small town that is unlikely to have any other weather station, then this information can be useful for others in the community and help build links.
  • You can add many other features to the website weather display, such as satellite photographs, weather maps and even your own webcam looking at the sky. You could add pupils’ own photographs of weather events, such as frost or snow.
  • With the right (free) software, your weather readings can be sent automatically to the Met Office, where they are shown hour-by-hour on a website (called WOW) alongside thousands of others from all over the world – a great resource when teaching about UK and world climate.
  • A weather station can be used as an integral part of a school Weather Club, Environment Club or Science Club.
  • Extreme weather seems to make the TV news headlines very frequently. So what was the weather like at our school yesterday when there was heavy flooding in Somerset or damaging winds in Wales?

What type of weather station should we buy?

The first choice you need to make is between a traditional manual weather station and a wireless automatic station. These are described below together with some discussion of pros and cons in each case.  If you have already decided you want an automatic type then skip the next section.

A traditional manual weather station

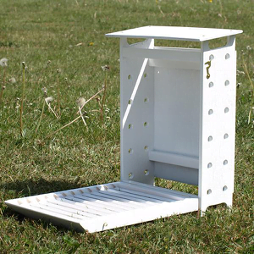
This type uses instruments to measure temperature, including maximum and minimum, and humidity, kept in a white louvred screen (“Stevenson screen”) to keep sunshine from warming up the instruments. Alongside this will be a rain gauge on the ground. The photos below show such an arrangement using glass thermometers, but mechanical (dial-type) ones can be used just as well. Wind measurements can be made with a hand-held anemometer, and pressure using a barometer on the classroom wall. More about setting up this type of weather station, and the instruments that could be used, can be found at:

Simple Weather Instruments.pdf

http://www.weatherforschools.me.uk/html/clouds.html

Typically, a couple of pupils will be assigned to go outside in the morning and at lunch time, and jot down readings, and display them in the classroom or foyer. If you want to keep long term records then they can be entered into a log book or (more commonly these days) a spreadsheet. One big advantage of using manual instruments is that they have to be read, which gives lots of practice with scales and units

weather station

(Left) A traditional manual weather station, with thermometers for measuring humidity (left) and maximum and minimum temperature (right), in a small louvered screen.  (Right) A simple plastic rain gauge with, alongside, a cylinder to measure the rainfall collected.

How much does it all cost? The collection of instruments illustrated above can be bought separately for a total of about £100 (including a self-assembly screen).   Anemometers will be around £60, and a barometer about £20. Although the Royal Meteorological Society does not recommend specific instruments, suppliers such as MetCheck and Brannan carry a wide range and can be found easily online.

What about using instruments we make ourselves? There are plenty of examples shown at: https://www.metlink.org/experiments/  and while these are great for teaching principles, they are generally not accurate or robust enough to be used outside for long periods.

A wireless automatic weather station

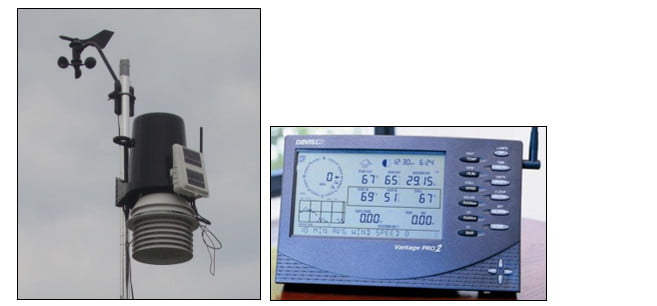
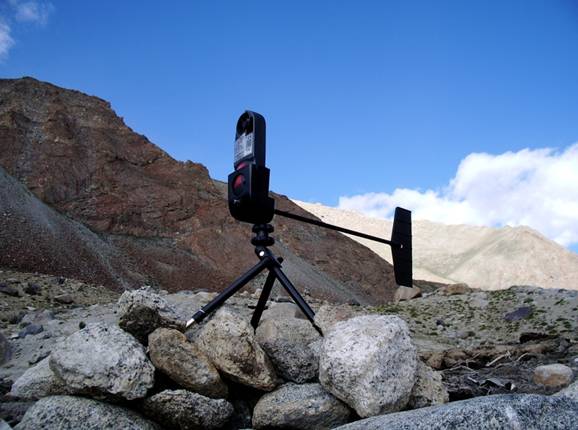
Wireless automatic weather stations (AWS) send all the information you need right into your classroom. They have two separate parts, outdoor and indoor, as illustrated below. A number of sensors are mounted outside on a mast attached to a building, with electronics that transmits data to a receiver console inside the school. Most AWS will measure temperature, humidity, rainfall, wind speed and wind direction. The indoor console will display these measurements (plus pressure), and in many cases also store them for a few weeks; they can then be downloaded into a PC using a USB cable. The weather station can be taken out of the box and set up by someone without a detailed technical knowledge of either weather or computing, using the instruction book provided.

weather station

A typical wireless automatic weather station costing around £60, with the sensor array outdoors (left) and the console which displays and records the data (right). But don’t put too much faith in the forecast shown.

weather station

A wireless automatic weather station and indoor console at the other end of the price range, costing around £900.

The price of such a weather station can be anywhere from £60 up to £900. In general, you get what you pay for, and pricier stations will generally be more accurate and reliable, and measure more things (solar radiation, for example).  In many cases, the main problem with budget weather stations is that the temperature and humidity sensors aren’t very well screened from sunshine, so they can often read a few degrees too high.  But even if you cannot afford to spend a few hundred pounds, quite a lot can be got from stations at the lower end of the market, so lack of massive funds should not stop you buying something.   

Although the Royal Meteorological Society does not recommend specific instruments, suppliers such as Maplin, Oregon, ProData and Weathershop carry a wide range of products and can be found easily online.

Where should we put it?

The good news is: you are not trying to be an official Met Office station!  Many schools and enthusiasts are deterred from setting up a weather station because they think that observations can only be made if you have a large expanse of open area away from buildings. This just isn’t true – perfectly good readings can be taken in pretty much any situation – many schools and amateurs attach their stations to the top of a building wall. It all comes down to what the readings represent – most Met Office stations are needed to represent weather that occurs in open, unsheltered, conditions, so there are strict rules about proximity to buildings and trees.  In addition, measurements of different weather elements have to be at set heights above the ground: temperature and humidity at 1.2m, rainfall at 0.3m and wind speed and direction at 10m. But your weather station doesn’t have to do all this, it just has to represent what the weather is like around your school – which may be similar to that around many other schools and back gardens, but will probably be nothing like that at a Met Office station. So do not let a lack of perfect exposure to weather put you off setting up a station.

Having said that, if you are lucky enough to have an area at ground level which is as open to the weather, and can provide a pole for the anemometer and some fencing to protect the station, then your data will look more like that at official stations.   

As noted above, one common method for mounting a wireless automatic weather station is on the side of a wall, poking above a roof, perhaps on an outbuilding (see photos below). If possible, put the anemometer and wind vane up higher than the other instruments so that the speed and direction of the wind is less affected by buildings. You could even attach it to an existing lamppost or tall fence.

The transmitter part of the weather station has to be reasonably close to the receiver console, somewhere between 50m and 300m depending on the type, or even closer if the radio signal has to penetrate walls. Always check that you have good reception before you finally decide on a spot.              

Vandalism can be a problem, so mount it out of reach, or use fencing (which can be expensive). On the other hand, someone in charge will need to access it from time to time (see next section), so think about the safety issues too.

Two videos (Location Part 1 and Location Part 2) from the London Grid for Learning (LGfL) discuss some of the issues:

http://weatherstations.lgfl.org.uk/maintenance.html

You can also Google “school weather station” images, to see examples of what other schools have decided to do – these show both automatic weather stations and traditional manual ones.

The final decision is always going to be a trade-off between several factors: as open to the weather as possible, accessibility for maintenance, security from damage and distance from the receiver. Quite often, you can get a position which isn’t too bad for temperature and humidity, is just about OK for rainfall, but isn’t very good at all for wind speed and direction. Remember, do the best you can, but a less-than-perfect exposure is better than nothing.  But bear in mind the deficiencies of location when comparing with other schools etc.

school weather station

(Left) A well exposed station at Sutton, part of the LGfL network, although quite difficult to access. (Centre)The weather station at Maiden Erlegh school. (Right)A typical home weather station on the side of a garage.


What maintenance is needed?

Like most things, a weather station will perform better if it is looked after, but this doesn’t need to be very onerous.

Batteries. Even if the weather station has solar panels, batteries are needed to help the station run at night and during the depths of winter, so need changing periodically. The indoor receiver and console will also need batteries replacing, unless it has a mains adaptor.  

Make a visual check from time to time to make sure the mounting pole is still vertical and hasn’t been bent over by high winds – this could affect wind and rainfall observations.

Rain gauges are prone to a couple of common problems that can be easily cured. Firstly, remove any leaves that may have gathered in the collecting funnel as eventually these can block any rain from getting to the measuring mechanism below. Secondly, lift off the funnel and check that there aren’t any spiders’ webs stopping the bucket from tipping – this is more common than you might think. 

Keep an eye on your data, and in particular compare it with the nearest station (this is easy to do using the WOW network – see below).  There are sometimes tell-tale signs of problems, for example lack of rainfall over a few days compared to a neighbour indicating a blocked gauge, or straight line traces invariably indicating a battery problem. Usually the pressure sensor is inside the receiver console, so if this is still working and the other readings aren’t, this may indicate a problem with the wireless link.


How do we store or disseminate the data?

Of course you don’t have to store any data, you can simply read the console (or the instruments) when you want to and leave it at that, or just note down the weather conditions, for example every morning. 

The consoles of many automatic weather stations (even cheap ones) can be plugged into a PC with a USB lead and readings can be displayed on the screen using a programme supplied with the station. The console also usually acts as a logger, to store weather data, typically at 10 min intervals. The same programme also allows you to download the data (maybe every two or three weeks) and keep it as an Excel spreadsheet on the PC.  This means you can plot the data on a graph later, or use it for investigations (see later paragraph).  An alternative to the manufacturer supplied software is a programme called Cumulus, which is available as donation-ware from www.sandaysoft.com

 Cumulus also makes it very straightforward to put your observations on the web, using the Weather Observations Website (WOW) developed by the Met Office and the Royal Meteorological Society.  This network shows observations from all over the world and has the following advantages for schools:

  • Forecasters at the Met Office HQ at Exeter use WOW maps to help them see if their forecast is evolving accurately, so contributing your school’s data will be helping to improve the forecast.
  • If you zoom in on your own area on the map, you can see how your school’s weather compares with other nearby stations. You can also select the nearest Met Office station to compare with – but remember, that will generally have a perfect open exposure so any differences will be partly due to this.
  • By clicking on your station, you can show graphs of weather over the past day or month or even longer – and, again, compare your station with a nearby one .
  • You can see your data as a table, and cut and paste it into an Excel spreadsheet. As this is always available from WOW, you may decide you don’t need to download and save your data yourself.
  • You can look back at maps of observations hour by hour, even months or years ago. So you can look at a special weather event such as thick fog, a baking hot day or some heavy rainfall. Or perhaps a special event such as Sports Day or a town carnival.
  • If you zoom out, you can see how your weather compares with that being collected at the same time by schools in Australia or Alaska – an instant geography lesson!
  • If there is an exciting weather event in some other country, such as a hurricane in Florida or a heatwave in Australia, you might be able to find evidence of it on WOW

Your WOW page allows you to add photographs of your station; this is particularly useful in showing to others how well your station is exposed.  Details of how to link your weather station to WOW.

weather graph

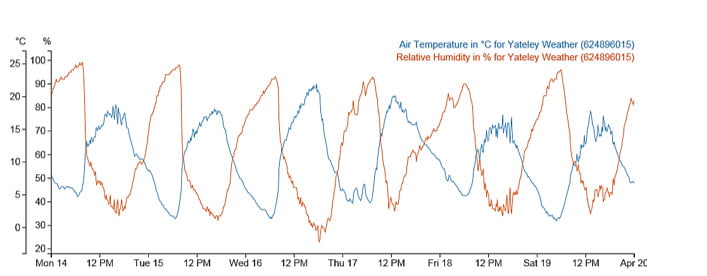
WOW can display your weather station data over any time period in the past, in this case a week with warm and dry days and cool and humid nights.

UK weather data

(Left) Using WOW it is easy to compare your readings with other schools or amateurs in the same area. This shows relative humidity in the Reading – Farnham area reported by 17 stations. (Right) Temperatures across the UK at the time of the 2014 London Marathon; cool areas are green, warm areas are orange.

global weather data

Using WOW for an instant view of world weather (January 2014); on this day the temperature ranged from -20ºC in Alaska to +38ºC in Australia.

How can we use the weather station for teaching activities?

  • Plot on a graph (using a spreadsheet or manually) pairs of weather elements, to see if there is any correlation between them. These could include rainfall and temperature, rainfall and pressure, temperature and wind speed, or wind speed and time of day. If there does appear to be a correlation, why should this be?
  • How does weather vary each season? Each month? What has the weather been like over the past week?
  • Produce a weather report for the day and present it as if you were a TV weather presenter.
  • Compare your readings with those from a nearby school or schools (you could use WOW for this) and explain the differences. You could forge links with the other school(s) to make this a joint project.
  • Host visits from other local schools that don’t have a weather station, to tell them what they are missing and help them set up their own.
  • Invite the Maths department to make full use of your data to teach statistics and graphs or as the basis of projects. This could include the correlations idea, above. Once you have a few years’ data, you can ask questions such as “What is the probability of getting frost at our school”, “How likely am I to get wet if I am playing football outside for an hour” or “Does it rain more at weekends than during the week?”
  • Once the school has collected, say, 5 years of data, this can be used to look at average conditions, and published (eg on the website) as “The climate of Meldrew School”.
  • Keep a log (either online or on the PC or even in a book) of “Weather extremes for Meldrew School”. Add the date and time of new extremes of temperature, wind speed etc. New extremes get more exciting as time goes on.
  • Add in visual observations of clouds (amount and type) and visibility, thunder and lightning, snow, sleet, hail, etc.
  • Use your school weather station to lead into the topic of climate change by pointing out that it is an affordable version of the sort of weather stations which are deployed in their tens of thousands all over the world. A careful examination of the data from those that have been operating for several decades allows us to say if climate is changing.
  • The weather station is a natural way to introduce many concepts in science – water vapour as a gas, evaporation and condensation, atmospheric pressure, solar radiation, etc
  • Link it to simple experiments such as making a cloud in a plastic bottle or making a tornado, which can be found at: https://www.metlink.org/experiments/ or demonstration videos at http://www.youtube.com/playlist?list=PL4D17D18D91FA431E&feature=plpp
  • Use the weather station to test the accuracy of home-made instruments such as a barometer, hygrometer, anemometer or rain gauge given at https://www.metlink.org/experimentsdemonstrations/
  • Compare the weather station data with measurements in different parts of the school using handheld instruments such as anemometers, simple rain gauges and thermometers, to build up a picture of the school’s microclimate
  • Use the microclimate data collected in the project above to make practical decisions about where would be the best place to put a wind generator, a rainwater collector or a solar panel.

(See in addition some of the points made in the opening page of this note).

Further information

Try Googling “running a school weather station” to see what others have done, and what they get out of it.

There is a wealth of forums on the web, run by both education and weather enthusiasts, where answers to many questions can be found.

Some of the ideas in this paper have come from online articles by Martin Sutton, who runs a weather station at Maiden Erlegh School near Reading.  You can read more of his excellent advice at: http://www.weatherstations.co.uk/maiden-erlegh.htm

If you want to read a bit deeper, but still in an understandable way, about weather stations, get hold of a copy of the Weather Observers Handbook by Stephen Burt.  http://www.cambridge.org/gb/academic/subjects/earth-and-environmental-science/atmospheric-science-and-meteorology/weather-observers-handbook?format=PB

Measuring Raindrops

How big is a raindrop?

Collect data and analyse mode, mean and median, range, interquartile range and standard deviation

Introduction: There are many words and many descriptions for different types of rain: fine rain, heavy rain, pelting down, mizzling. In fact the BBC news magazine has an article entitled “Fifty words for rain”. But how big is a rain drop? Does the size vary depending upon the time of year or the type of rain?

Aim: To collect data, manipulate data and analyse data to calculate and compare the size of raindrops.

Equipment Required

  • A platform of area of about 0.5m2 with edges.
  • Enough flour to cover the platform to a depth of about 3cm
  • An accurate measuring device, e.g. electronic sliding callipers.

Collecting the data

  • Cover the platform with the flour.
  • Place the platform in the rain for about 90 seconds, long enough for about 200 raindrops to hit the platform.
  • Use your measuring device to measure the diameter of the raindrops and record the data.

Manipulating, analysing, displaying and interpreting the data

There follows a number of suggestions of how the data can be used depending upon the ability of the students.

1. Calculate the mode, mean and median diameter of raindrop. Which is the most appropriate measure to use? Compare results from different groups.

2. Group the data into appropriate groups. Represent the data using histograms. Discuss whether it is appropriate to have all the groups the same size of vary the size of the groups. Compare the results from different groups. Compare data collected at different times of year if possible.

3. Calculate the spread of the data using range, interquartile range and standard deviation.

4. Discuss different methods of displaying the data. Is the data discrete or continuous? Should a bar chart or a histogram be used? This activity is ideal for discussing when a histogram should be used and the reasons for using a histogram.

5. Draw box plots to show the distribution of the data. Compare the spread of different data sets. What does this information tell us?

6. Write a report comparing the size of raindrops.

Extension

It may be appropriate for Advanced level students to explore the log-normal distribution as discussed in the accompanying article A Low Cost Experiment for determining Raindrop size Distribution.

Further Background Information

Making rainfall features fun: scientific activities for teaching children aged 5–12 years.

This lovely animation explores integration through Is it better to walk or run in the rain?

With thanks to Stephen Lyon at the National STEM centre

Does it Always Rain from Dark Clouds?

Microclimates

Find out about how to borrow weather instruments in order to be able to carry out a microclimate investigation with your school here, or more about urban heat islands here

What are microclimates?
What are the different types of microclimates?
What is an urban microclimate?
Urban precipitation
Smog
Urban winds
 

What are microclimates?

A microclimate is the distinctive climate of a small-scale area, such as a garden, park, valley or part of a city. The weather variables in a microclimate, such as temperature, rainfall, wind or humidity, may be subtly different from the conditions prevailing over the area as a whole and from those that might be reasonably expected under certain types of pressure or cloud cover. Indeed, it is the amalgam of many, slightly different local microclimates that actually makes up the microclimate for a town, city or wood.

It is these subtle differences and exceptions to the rule that make microclimates so fascinating to study, and these notes help to identify and explain the key differences which can be noticed by ground-level observations.

What are the different types of microclimates?

In truth, there is a distinctive microclimate for every type of environment on the Earth’s surface, and as far as the UK is concerned they include the following:
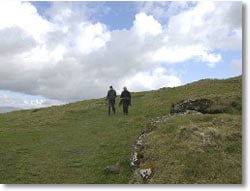
Upland regions

Upland areas have a specific type of climate that is notably different from the surrounding lower levels. Temperature usually falls with height at a rate of between 5 and 10 °C per 1000 m, depending on the humidity of the air. This means that even quite modest upland regions, such as The Cotswolds, can be significantly colder on average than somewhere like the nearby Severn Valley in Gloucestershire.

Occasionally, a temperature inversion can make it warmer above, but such conditions rarely last for long. With higher hills and mountains, the average temperatures can be so much lower that winters are longer and summers much shorter. Higher ground also tends to be windier, which makes for harsher winter weather. The effect of this is that plants and animals are often different from those at low levels.

Hills often cause cloud to form over them by forcing air to rise, either when winds have to go over them or they become heated by the sun. When winds blow against a hill-side and the air is moist, the base of the cloud that forms may be low enough to cover the summit. As the air descends on the other (lee) side, it dries and warms, sometimes enough to create a föhn effect. Consequently, the leeward side of hills and mountain ranges is much drier than the windward side. The clouds that form due to the sun’s heating sometimes grow large enough to produce showers, or even thunderstorms. This rising air can also create an anabatic wind on the sunny side of the hill. Sunshine-facing slopes (south-facing in the Northern Hemisphere, north-facing in the Southern Hemisphere) are warmer than the opposite slopes.

Apart from temperature inversions, another occasion when hills can be warmer than valleys is during clear nights with little wind, particularly in winter. As air cools, it begins to flow downhill and gathers on the valley floor or in pockets where there are dips in the ground. This can sometimes lead to fog and/or frost forming lower down. The flow of cold air can also create what is known as a katabatic wind.

Coastal regions

The coastal climate is influenced by both the land and sea between which the coast forms a boundary. The thermal properties of water are such that the sea maintains a relatively constant day to day temperature compared with the land. The sea also takes a long time to heat up during the summer months and, conversely, a long time to cool down during the winter. In the tropics, sea temperatures change little and the coastal climate depends on the effects caused by the daytime heating and night-time cooling of the land. This involves the development of a breeze from off the sea (sea breeze) from late morning and from off the land (land breeze) during the night. The tropical climate is dominated by convective showers and thunderstorms that continue to form over the sea but only develop over land during the day. As a consequence, showers are less likely to fall on coasts than either the sea or the land.

Around the Poles, sea temperatures remain low due to the presence of ice, and the position of the coast itself can change as ice thaws and the sea re-freezes. One characteristic feature is the development of powerful katabatic winds that can sweep down off the ice caps and out to sea.

In temperate latitudes, the coastal climate owes more to the influence of the sea than of the land and coasts are usually milder than inland during the winter and cooler in the summer. However, short-term variations in temperature and weather can be considerable. The temperature near a windward shore is similar to that over the sea whereas near a leeward shore, it varies much more. During autumn and winter, a windward shore is prone to showers while during spring and summer, showers tend to develop inland. On the other hand, a sea fog can be brought ashore and may persist for some time, while daytime heating causes fog to clear inland. A lee shore is almost always drier, since it is often not affected by showers or sea mist and even frontal rain can be significantly reduced. When there is little wind during the summer, land and sea breezes predominate, keeping showers away from the coast but maintaining any mist or fog from off the sea.
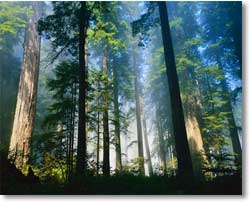
Forests

Tropical rainforests cover only about 6% of the earth’s land surface, but it is believed they have a significant effect on the transfer of water vapour to the atmosphere. This is due to a process known as evapotranspiration from the leaves of the forest trees. Woodland areas in more temperate latitudes can be cooler and less windy than surrounding grassland areas, with the trees acting as a windbreak and the incoming solar radiation being ‘filtered’ by the leaves and branches. However, these differences vary depending on the season, i.e. whether the trees are in leaf, and the type of vegetation, i.e. deciduous or evergreen. Certain types of tree are particularly suitable for use as windbreaks and are planted as barriers around fields or houses.
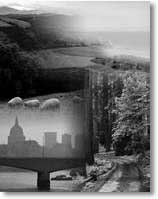
 

Urban regions

These are perhaps the most complex of all microclimates. With over 75% of the British population being classed as urban, it is no surprise that they are also the most heavily studied by students of geography and meteorology. Therefore, the rest of these notes focus on the various elements that constitute an urban microclimate.

What is an urban microclimate?

The table below summarises some of the differences in various weather elements in urban areas compared with rural locations.

Sunshine duration5 to 15% less
Annual mean temperature0.5-1.0 °C higher
Winter maximum temperatures1 to 2 °C higher
Occurrence of frosts2 to 3 weeks fewer
Relative humidity in winter2% lower
Relative humidity in summer8 to 10% lower
Total precipitation5 to 10% more
Number of rain days10% more
Number of days with snow14% fewer
Cloud cover5 to 10% more
Occurrence of fog in winter100% more
Amount of condensation nuclei10 times more

Urban heat islands

Marked differences in air temperature are some of the most important contrasts between urban and rural areas shown in the table above. For instance, Chandler (1965) found that, under clear skies and light winds, temperatures in central London during the spring reached a minimum of 11 °C, whereas in the suburbs they dropped to 5 °C.

Indeed, the term urban heat island is used to describe the dome of warm air that frequently builds up over towns and cities.

The formation of a heat island is the result of the interaction of the following factors:

  • the release (and reflection) of heat from industrial and domestic buildings;
  • the absorption by concrete, brick and tarmac of heat during the day, and its release into the lower atmosphere at night;
  • the reflection of solar radiation by glass buildings and windows. The central business districts of some urban areas can therefore have quite high albedo rates (proportion of light reflected);
  • the emission of hygroscopic pollutants from cars and heavy industry act as condensation nuclei, leading to the formation of cloud and smog, which can trap radiation. In some cases, a pollution dome can also build up;
  • recent research on London’s heat island has shown that the pollution domes can also filter incoming solar radiation, thereby reducing the build up of heat during the day. At night, the dome may trap some of the heat from the day, so these domes might be reducing the sharp differences between urban and rural areas;
  • the relative absence of water in urban areas means that less energy is used for evapotranspiration and more is available to heat the lower atmosphere;
  • the absence of strong winds to both disperse the heat and bring in cooler air from rural and suburban areas. Indeed, urban heat islands are often most clearly defined on calm summer evenings, often under blocking anticyclones.
Urban pollution dome and plume

The precise nature of the heat island varies from urban area to urban area, and it depends on the presence of large areas of open space, rivers, the distribution of industries and the density and height of buildings. In general, the temperatures are highest in the central areas and gradually decline towards the suburbs. In some cities, a temperature cliff occurs on the edge of town. This can be clearly seen on the heat profile below for Chester.

Urban heat island in Chester

Urban precipitation

As noted previously, the greater presence of condensation nuclei over urban areas can lead to cities being wetter and having more rain days than surrounding rural areas. Indeed, it was often said that Rochdale, the famous mill town, had significantly smaller amounts of rain on Sundays when the town’s factories were closed.

However, other factors play a major role, especially the heat islands. These can enhance convectional uplift, and the strong thermals that are generated during the summer months may serve to generate or intensify thunderstorms over or downwind of urban areas. Storms cells passing over cities can be ‘refuelled’ by contact with the warm surfaces and the addition of hygroscopic particles. Both can lead to enhanced rainfall, but this usually occurs downwind of the urban area.

Smog

Smogs were common in many British cities in the late 19th and early 20th centuries, when domestic fires, industrial furnaces and steam trains were all emitting smoke and other hygroscopic pollutants by burning fossil fuels. The smogs were particularly bad during the winter months and when temperature inversions built up under high pressure, causing the pollutants to become trapped in the lower atmosphere and for water vapour to condense around these particles.

One of the worst of these ‘pea-soup fogs’ was the London smog of the winter of 1952/53. Approximately 4,000 people died during the smog itself, but it is estimated that 12,000 people may have died due to its effects. As a result, the Clean Air Act of 1956 was introduced to reduce these emissions into the lower atmosphere. Taller chimney stacks and the banning of heavy industry from urban areas were just two of the measures introduced and, consequently, fewer smogs were recorded in the UK during the 1960s and 1970s.

Research in the 1990s has shown, however, that another type of smog – photochemical – is now occurring in some urban areas as a result of fumes from car exhausts and the build up of other pollutants in the lower atmosphere which react with incoming solar radiation. The presence of a brown-coloured haze over urban areas is an indication of photochemical smog, and among its side effects are people experiencing breathing difficulties and asthma attacks.

Urban winds

Tall buildings can significantly disturb airflows over urban areas, and even a building 100 metres or so high can deflect and slow down the faster upper-atmosphere winds. The net result is that urban areas, in general, are less windy than surrounding rural areas.

However, the ‘office quarter’ of larger conurbations can be windier, with quite marked gusts. This is the result of the increased surface roughness that the urban skyline creates, leading to strong vortices and eddies. In some cases, these faster, turbulent winds are funnelled in between buildings, producing a venturi effect, swirling up litter and making walking along the pavements quite difficult.

Web page reproduced with the kind permission of the Met Office

CloudWheel Cutout

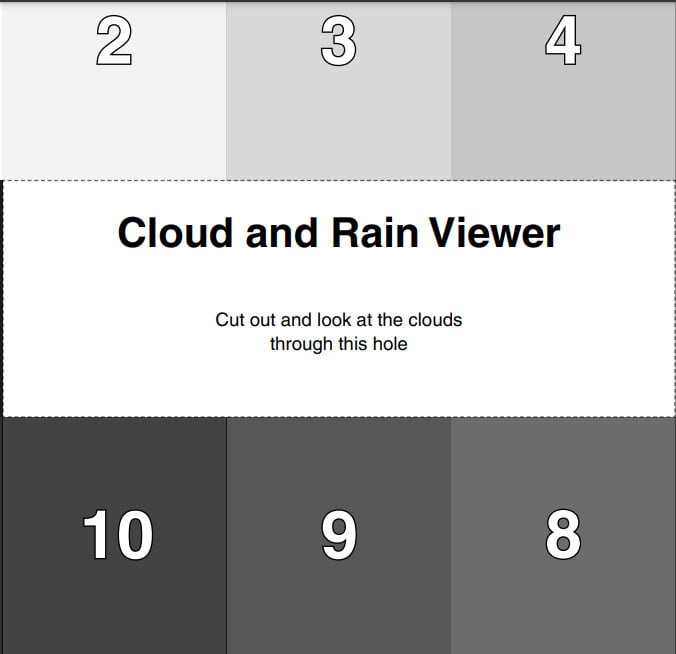
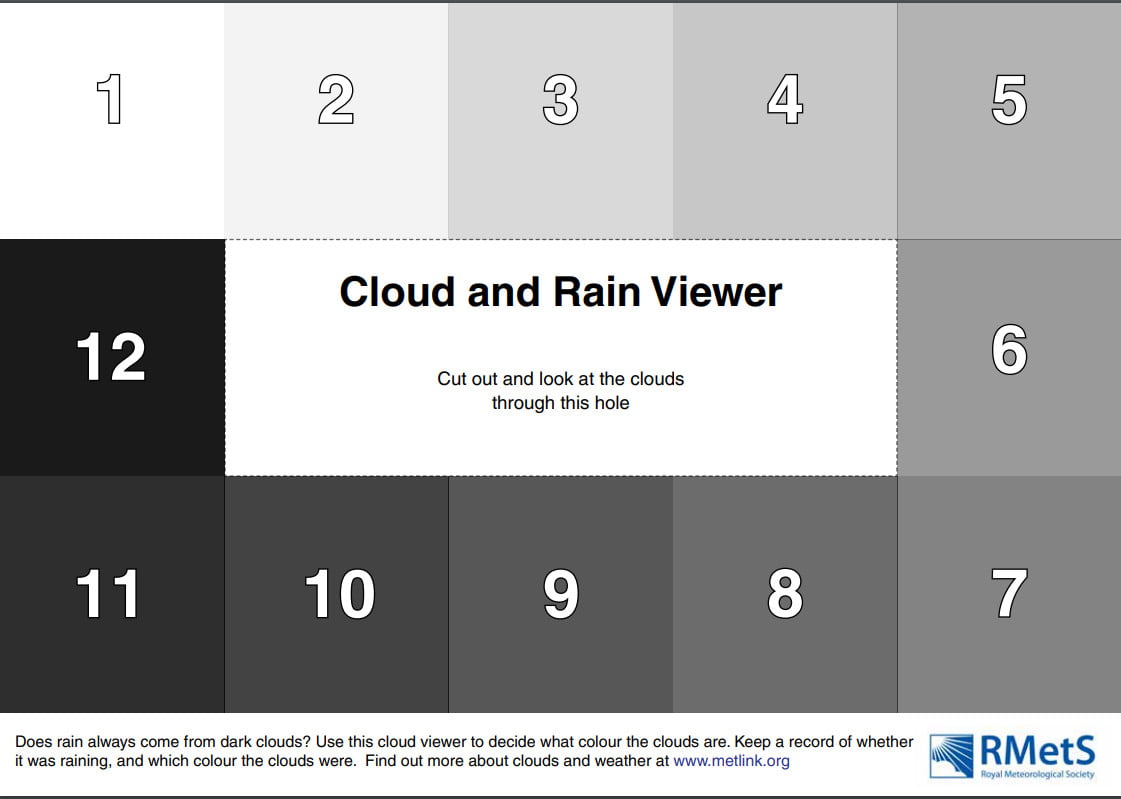
We have made a cloud wheel that can be cut out and used to identify clouds. Simply download the pdf, cut out the two circles, fasten together with a split pin and use to identify clouds.

Download Cloudwheel >>

CloudWheel Cut Out

Or, if you’d like a simpler version, use our Cloud bookmark.

Or, you can buy a laminated cloud identification key, produced in conjunction with the Field Studies Council, from our shop.

Bubble Chase

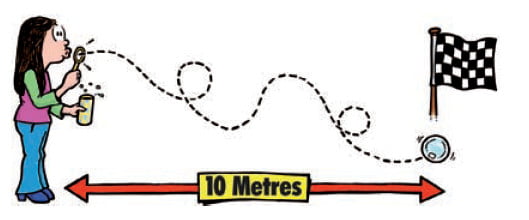
How to measure wind speed and direction using bubbles

Equipment

  • Bubble blowing kit
  • Stopwatch or phone
  • Compass or compass app

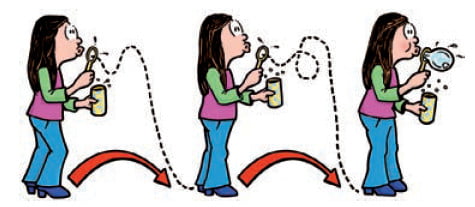
Bubble Chase to Measure Wind Direction

  • Place a marker at your start location. Choose an area of open ground which is safe and away from roads.
  • Blow some bubbles then pick one to follow.
  • Chase your chosen bubble, without getting in its way, until it pops or floats somewhere you cannot follow.
  • Blow another bubble from where you end up and follow that one.Bubble chase

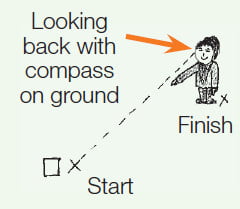
Wherever you end up, look back at where you have come from.
Now use your compass to work out the direction back to the starting point. This will give you the wind direction, because wind direction refers to where the wind is blowing from.
Repeat a few times if possible.Use your compass to find the direction back

Remember: wind direction is the direction wind is blowing from.
Turbulence: If you are in an area where there is a lot of turbulence the bubbles may not move very far from the release point, or may go all over the place!

Bubble Race to Measure Wind Speed

Bubble race to measure wind speedTwo people are needed for this: a ‘blower’ to blow bubbles and a ‘timer’ to time them using a stopwatch or watch.

  • Place a marker at your start location and another marker 10 metres away (about 10 adult paces) in the general direction the wind will carry the bubbles. This is your finishing line. If the wind is very light you can use a shorter distance.
  • The blower blows some bubbles and the timer picks one to follow.
  • The timer uses the stopwatch or watch to measure how long it takes the bubble to reach the finishing line.
  • Calculate the wind speed by dividing 10 metres by the time the bubble takes to cover that distance. So if the time it takes is 5 seconds, then the windspeed is 10 ÷ 5 = 2 metres per second.
  • Repeat a few times and find the average time.

Developed with the Field Studies Council.

Measuring Temperature and Humidity in your Garden

170th anniversary RMets logo


There are two ways to measure temperature and humidity in your garden; either using individual instruments or using a weather station.

Temperature can be measured with a simple glass thermometer (below left, £3-5) filled with alcohol, which expands up a thin tube when the temperature increases. (Older thermometers may use mercury). Use the Celsius (C) scale, and estimate temperature to the nearest degree, or half degree if it is in between.

glass thermometer
digital thermometer

Digital thermometers (above right, £5) use electronics to measure temperature and are easier to read. The probe at the end of the cable that senses the temperature could be put outside in the shade with the readout in a garage, for example. They usually show temperature to a tenth of a degree, for example 28.9ºC, so enter this number in your report. (NB: When using digital thermometers (or indeed digital instruments of any type) remember that, although the display may have a precision of 0.1°C, its accuracy is likely to be much poorer than that – maybe a degree or two).

dial hygrometer
electronic hygrometer

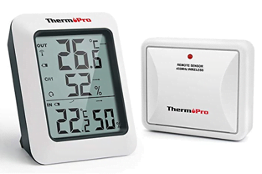
Instruments for measuring humidity are known as hygrometers. We will be measuring relative humidity in percent (%). A dial hygrometer (above left, around £10) uses hair, which expands when the atmosphere is moist. An electronic hygrometer uses electronics and has a clear display – devices which read both temperature and humidity are popular. Some of them (above right, £16-20) transmit data from outside sensors to a display indoors.

Humidity can also be measured with a wet and dry bulb hygrometer. This gives a more accurate reading, but involves the use of tables, so is a lot more complicated. Instructions will come with the hygrometer.

All types of thermometer and hygrometer must be kept out of direct sunlight at the time of reading (15:00-16:00) and for half an hour beforehand, either using some form of white louvered screen (below, £90), or by placing it in a position where sunlight doesn’t reach when you are observing, for example sheltered north facing location. As a last resort the thermometer can be hung on a north-facing wall or fence, but stood off as far away from the wall as possible to allow air to circulate all around it.white louvered screen

An Automatic Weather Station (AWS) measures temperature and humidity (and other quantities) with outdoor instruments which radio the data to an indoor display console. They can be bought for as little as £100 (below left), but for better accuracy you will have to pay £300 or more (below, right). They are generally mounted on top of fences or garages, to put them out in the open as much as possible. AWS can be mounted in direct sunlight, but in light winds and strong sunlight the budget versions can be up to 4 degrees in error. Temperature and humidity can be read direct from the indoor display and entered in your report.

£100 automatic weather station
£300 automatic weather station

Clouds

Useful links

Download a Cloud Wheel or bookmark as a cloud identification chart.

Experiments demonstrate clouds forming in the Classroom from Physics Education, 2012, Catalyst article on Cloud SeedingPhysics Review article on Clouds, or have a look at our Experiments and Demonstrations page for experiments which demonstrate how clouds can look dark from below but white from above, or how to make a hygrometer to measure air humidity.

For a deeper understanding of how and where clouds form, have a look at our exercise using height/ temperature graphs to investigate atmospheric stability, lapse rates and cloud formation with a worksheet for students with an introductory PowerPoint or this paper.

What causes clouds
Types of clouds
Low clouds
Medium clouds
High clouds
What influences the colour of clouds?
Why do clouds stop growing upwards?
Why are there no clouds on some days?
Measuring clouds
The formation of precipitation
The nature of clouds
Types of cloud
Cumulus
Cumulonimbus
Stratus
Stratocumulus
Altocumulus
Altostratus
Nimbostratus
Cirriform clouds
Short-answer questions

What causes clouds

A cloud is defined as ‘a visible aggregate of minute droplets of water or particles of ice or a mixture of both floating in the free air’. Each droplet has a diameter of about a hundredth of a millimetre and each cubic metre of air will contain 100 million droplets. Because the droplets are so small, they can remain in liquid form in temperatures of -30 °C. If so, they are called supercooled droplets.

Clouds at higher and extremely cold levels in the atmosphere are composed of ice crystals – these can be about a tenth of a millimetre long.

Clouds form when the invisible water vapour in the air condenses into visible water droplets or ice crystals. For this to happen, the parcel of air must be saturated, i.e. unable to hold all the water it contains in vapour form, so it starts to condense into a liquid or solid form. There are two ways by which saturation is reached.

(a) By increasing the water content in the air, e.g. through evaporation, to a point where the air can hold no more.

(b) By cooling the air so that it reaches its dew point – this is the temperature at which condensation occurs, and is unable to ‘hold’ any more water. Figure 1 shows how there is a maximum amount of water vapour the air, at a given temperature, can hold. In general, the warmer the air, the more water vapour it can hold. Therefore, reducing its temperature decreases its ability to hold water vapour so that condensation occurs.

Graph plotting temperature and vapour pressure
Fig 1: There is a maximum amount of water vapour the air, at a given temperature, can hold

Method (b) is the usual way that clouds are produced, and it is associated with air rising in the lower part of the atmosphere. As the air rises it expands due to lower atmospheric pressure, and the energy used in expansion causes the air to cool. Generally speaking, for each 100 metres which the air rises, it will cool by 1 °C, as shown in Figure 2. The rate of cooling will vary depending on the water content, or humidity, of the air. Moist parcels of air may cool more slowly, at a rate of 0.5 °C per 100 metres.

graph plotting height and temperature
Fig 2: For each 100 metres which the air rises, it will cool by 1 °C

Therefore, the vertical ascent of air will reduce its ability to hold water vapour, so that condensation occurs. The height at which dew point is reached and clouds form is called the condensation level.

There are five factors which can lead to air rising and cooling.

1. Surface heating. The ground is heated by the sun which heats the air in contact with it causing it to rise. The rising columns are often called thermals.

2. Topography. Air forced to rise over a barrier of mountains or hills. This is known as orographic uplift.

3. Frontal. A mass of warm air rising up over a mass of cold, dense air. The boundary is called a ‘front’.

4. Convergence. Streams of air flowing from different directions are forced to rise where they meet.

5. Turbulence. A sudden change in wind speed with height creating turbulent eddies in the air.

Another important factor to consider is that water vapour needs something to condense onto. Floating in the air are millions of minute salt, dust and smoke particles known as condensation nuclei which enable condensation to take place when the air is just saturated.

Types of clouds

In 1803 a retail chemist and amateur meteorologist called Luke Howard proposed a system which has subsequently become the basis of the present international classification. Howard also become known by some people as ‘the father of British meteorology’, and his pioneering work stemmed from his curiosity into the vivid sunsets in the late 18th century following a series of violent volcanic eruptions. They had ejected dust high up into the atmosphere, thereby increasing the amount of condensation nuclei, and producing spectacular cloud formations and sunsets.

Howard recognised four types of cloud and gave them the following Latin names.

Cumulus  heaped or in a pile

Stratus  in a sheet or layer

Cirrus  thread-like, hairy or curled

Nimbus  a rain bearer

If we include another Latin word altum meaning height, the names of the 10 main cloud types are all derived from these five words and based upon their appearance from ground level and visual characteristics.

The cloud types are split into three groups according to the height of their base above mean sea level. Note that ‘medium’ level clouds are prefixed by the word alto and ‘high’ clouds by the word cirro (see Table 1). All heights given are approximate above sea level in mid-latitudes. If observing from a hill top or mountain site, the range of bases will accordingly be lower.

Table 1: The 10 main cloud type
Low clouds
Surface – 7,000 ft
Medium clouds
7,000 – 17,000 ft
High clouds
17,000 – 35,000 ft
Cumulus
Altocumulus
Cirrus
Cumulonimbus
Altostratus
Cirrostratus
Stratus
Nimbostratus
Cirrocumulus
Stratocumulus


Low clouds

Cumulus (Cu)
Height of base: 1,200-6,000 ft
Colour: White on its sunlit parts but with darker undersides.
Shape: This cloud appears in the form of detached heaps. Shallow cumulus may appear quite ragged, especially in strong winds, but well formed clouds have flattened bases and sharp outlines. Large cumulus clouds have a distinctive ‘cauliflower’ shape.
Other features: Well developed cumulus may produce showers.

Cumulus clouds
Fig 3: Cumulus
photo © R.K.Pilsbury

Cumulonimbus (Cb)
Height of base: 1,000-5,000 ft
Colour: White upper parts with dark, threatening undersides.
Shape: A cumulus-type cloud of considerable vertical extent. When the top of a cumulus reaches great heights, the water droplets are transformed into ice crystals and it loses its clear, sharp outline. At this stage the cloud has become a cumulonimbus. Often, the fibrous cloud top spreads out into a distinctive wedge or anvil shape.
Other features: Accompanied by heavy showers, perhaps with hail and thunder. By convention Cb is usually reported if hail or thunder occur, even if the observer does not immediately recognise the cloud as Cb (it may be embedded within layers of other cloud types).

Cumulonimbus clouds
Fig 4: Cumulonimbus
photo © R.K.Pilsbury

Stratus (St)
Height of base: surface-1,500 ft
Colour: Usually grey.
Shape: May appear as a layer with a fairly uniform base or in ragged patches, especially during precipitation falling from a cloud layer above. Fog will often lift into a layer of stratus due to an increase in wind or rise in temperature. As the sun heats the ground the base of stratus cloud may rise and break becoming shallow cumulus cloud as its edges take on a more distinctive form.
Other features: If thin, the disc of the sun or moon will be visible (providing there are no other cloud layers above). If thick, it may produce drizzle or snow grains.

Stratus clouds
Fig 5: Stratus
photo © C.S.Broomfield

Stratocumulus (Sc)
Height of base: 1,200-7,000 ft
Colour: Grey or white, generally with shading.
Shape: Either patches or a sheet of rounded elements but may also appear as an undulating layer. When viewed from the ground, the size of individual elements will have an apparent width of more than 5° when at an elevation greater than 30° (the width of three fingers at arm’s length).
Other features: May produce light rain or snow. Sometimes the cloud may result from the spreading out of cumulus, giving a light shower.

stratocumulus clouds
Fig 6: Stratocumulus
photo © J.F.P Galvin

Medium clouds

Altocumulus (Ac)
Height of base: 7,000-17,000 ft
Colour: Grey or white, generally with some shading.
Shape: Several different types, the most common being either patches or a sheet of rounded elements but may also appear as a layer without much form. When viewed from the ground, the size of individual elements will have an apparent width of 1 to 5° when at an elevation greater than 30° (the width of one to three fingers at arm’s length). Even if the elements appear smaller than this the cloud is still classified altocumulus if it shows shading.
Other features: Occasionally some slight rain or snow, perhaps in the form of a shower may reach the ground. On rare occasions, a thunderstorm may occur from one type of Ac known as altocumulus castellanus – so called because in outline, the cloud tops look like a series of turrets and towers along a castle wall.

altocumulus clouds
Fig 7: Altocumulus
photo © C.S.Broomfield

Altostratus (As)
Height of base: 8,000-17,000 ft
Colour: Greyish or bluish.
Shape: A sheet of uniform appearance totally or partly covering the sky.
Other features: Sometimes thin enough to reveal the sun or moon vaguely, as through ground glass. Objects on the ground do not cast shadows. May give generally light rain or snow, occasionally ice pellets, if the cloud base is no higher than about 10,000 ft.

altostratus clouds
Fig 8: Altostratus
photo © C.S.Broomfield

Nimbostratus (Ns)
Height of base: 1,500-10,000 ft
Colour: Dark grey.
Shape: A thick, diffuse layer covering all or most of the sky.
Other features: Sun or moon always blotted out. Accompanied by moderate or heavy rain or snow, occasionally ice pellets. Although classed as a medium cloud, its base frequently descends to low cloud levels. May be partly or even totally obscured by stratus forming underneath in precipitation.

nimbostratus clouds
Fig 9: Nimbostratus
photo © C.S.Broomfield

High clouds

Cirrus (Ci)
Height of base: 17,000-35,000 ft
Colour: Composed of ice crystals, therefore white.
Shape: Delicate hair-like filaments, sometimes hooked at the end; or in denser, entangled patches; or occasionally in parallel bands which appear to converge towards the horizon.
Other features: The remains of the upper portion of a cumulonimbus is also classified as cirrus.

cirrus
Fig 10: Cirrus
photo © R.K.Pilsbury

Cirrocumulus (Cc)
Height of base: 17,000-35,000 ft
Colour: Composed of ice crystals, therefore white.
Shape: Patches or sheet of very small elements in the form of grains or ripples or a honeycomb. When viewed from the ground, the size of individual elements will have an apparent width of less than 1° when at an elevation greater than 30° (no greater than the width of a little finger at arm’s length).
Other features: Sometimes its appearance in a regular pattern of ‘waves’ and small gaps may resemble the scales of a fish, thus giving rise to the popular name ‘mackerel sky’ (this name may also be attributed to high altocumulus clouds).

cirrocumulus
Fig 11: Cirrocumulus
photo © R.K.Pilsbury

Cirrostratus (Cs)
Height of base: 17,000-35,000 ft
Colour: Composed of ice crystals, therefore white.
Shape: A transparent veil of fibrous or smooth appearance totally or partly covering the sky.
Other features: Thin enough to allow the sun to cast shadows on the ground unless it is low in the sky. Produces halo phenomena, the most frequent being the small (22°) halo around the sun or moon ≬ a little more than the distance between the top of the thumb and the little finger spread wide apart at arm’s length.

cirrostratus
Fig 12: Cirrostratus
photo © R.K.Pilsbury

Condensation trails (contrails)
These are thin trails of condensation, formed by the water vapour rushing out from the engines of jet aircraft flying at high altitudes. They are not true clouds, but can remain in the sky for a long time, and grow into cirrus clouds.

contrails
Fig 13: Cirrus with contrails
photo © S D Burt

What influences the colour of clouds?

Light from both the sky and from clouds is sunlight which has been scattered. In the case of the sky, the molecules of air (nitrogen and oxygen) undertake the scattering, but the molecules are so small that the blue part of the spectrum is scattered more strongly than other colours.

The water droplets in the cloud are much larger, and these larger particles scatter all of the colours of the spectrum by about the same amount, so white light from the sun emerges from the clouds still white.

Sometimes, clouds have a yellowish or brownish tinge – this is a sign of air pollution.

Why do clouds stop growing upwards?

Condensation involves the release of latent heat. This is the ‘invisible’ heat which a water droplet ‘stores’ when it changes from a liquid into a vapour. Its subsequent change of form again releases enough latent heat to make the damp parcel of air warmer than the air surrounding it. This allows the parcel of air to rise until all of the ‘surplus’ water vapour has condensed and all the latent heat has been released.

Therefore, the main reason which stops clouds growing upwards is the end of the release of latent heat through the condensation process. There are two other factors which also play a role. Faster upper atmospheric winds can plane off the tops of tall clouds, whilst in very high clouds, the cloud might cross the tropopause, and enter the stratosphere where temperatures rise, rather than decrease, with altitude. This thermal change will prevent further condensation.

Why are there no clouds on some days?

Even when it is very warm and sunny, there might not be any clouds and the sky is a clear blue. The usual reason for the absence of clouds will be the type of pressure, with the area being under the influence of a high pressure or anticyclone. Air would be sinking slowly, rather than rising and cooling. As the air sinks into the lower part of the atmosphere, the pressure rises, it becomes compressed and warms up, so that no condensation takes place. In simple terms, there are no mechanisms for clouds to form under these pressure conditions.

Measuring clouds

The cloud amount is defined as ‘the proportion of the celestial dome which is covered by cloud.’ The scale used is eighths, or oktas, with observers standing in an open space or on a rooftop to get a good view or panorama of the sky.

Complete cloud cover is reported as 8 oktas, half cover as 4 oktas, and a completely clear sky as zero oktas. If there is low-lying mist or fog, the observer will report sky obscured.

The reporter will also report the amount of each cloud level – 2 oktas of cumulus and 3 oktas of cirrus, etc.

The frequent passage of depressions across the United Kingdom means that the most commonly reported cloud amount is, not surprisingly, 8 oktas. A clear blue sky, i.e. zero oktas, is less common, as often on hot, sunny days, there are small wispy layers of cirrostratus or fine tufts of thin cirrus at high altitudes.

The formation of precipitation

Cooling, condensation and cloud formation is the start of the process which results in precipitation. But not all clouds will produce raindrops or snowflakes – many are so short-lived and small that there are no opportunities for precipitation mechanisms to start.

There are two theories that explain how minute cloud droplets develop into precipitation.

10.1 The Bergeron Findeisen ice-crystal mechanism

If parcels of air are uplifted to a sufficient height in the troposphere, the dew-point temperature will be very low, and minute ice crystals will start to form. The supercooled water droplets will also freeze on contact with these ice nuclei.

The ice crystals subsequently combine to form larger flakes which attract more supercooled droplets. This process continues until the flakes fall back towards the ground. As they fall through the warmer layers of air, the ice particles melt to form raindrops. However, some ice pellets or snowflakes might be carried down to ground level by cold downdraughts.

10.2 Longmuir’s collision and coalescence theory

This applies to ‘warm’ clouds, i.e. those without large numbers of ice crystals. Instead they contain water droplets of many differing sizes, which are swept upwards at different velocities so that they collide and combine with other droplets.

It is thought that when the droplets have a radius of 3 mm, their movement causes them to splinter and disintegrate, forming a fresh supply of water droplets.

This theory allows droplets of varying sizes to be produced, and as shown in the table below, each will have a different terminal (or falling) velocity. 


Particle radius (mm)
Terminal velocity (m/s)
Cloud


0.001
0.005
0.01
0.5
0.0001
0.0025
0.01
0.25
Drizzle
 
0.1
0.25
0.7
2.0
Rain


0.5
1.0
1.5
2.0
2.5
3.9
6.5
8.1
8.8
9.1

Table 2: The terminal velocities of different particle sizes

10.3 Man-made rain

In recent years, experiments have taken place, chiefly in the USA, China and the former USSR, adding particles into clouds that act as condensation or freezing nuclei. This cloud seeding involves the addition into the atmosphere from aircraft of dry ice, silver iodide or other hygroscopic substances. These experiments have largely taken place on the margins of farming areas where rainfall is needed for crop growth, or to divert rain from major events such as the 2008 Beijing Olympics.

The nature of clouds

A classification of clouds was introduced by Luke Howard (1772-1864) who used Latin words to describe their characteristics.
  • Cirrus – a tuft or filament (e.g. of hair)
  • Cumulus – a heap or pile
  • Stratus – a layer
  • Nimbus – rain bearing
clouds
C.S. Broomfield (© Crown Copyright)
There are now ten basic cloud types with names based on combinations of these words (the word ‘alto’, meaning high but now used to denote medium-level cloud, is also used).

Clouds form when moist air is cooled to such an extent that it becomes saturated. The main mechanism for cooling air is to force it to rise. As air rises it expands – because the pressure decreases with height in the atmosphere – and this causes it to cool. Eventually it may become saturated and the water vapour then condenses into tiny water droplets, similar in size to those found in fog, and forms cloud. If the temperature falls below about minus 20 °C, many of the cloud droplets will have frozen so that the cloud is mainly composed of ice crystals.

The main ways in which air rises to form cloud

  1. Rapid local ascent when heated air at the earth’s surface rises in the form of thermal currents (convection).
  2. Slow, widespread, mass ascent where warm moist air is forced to rise above cold air. The region between warm and cold air is called a ‘front’.
  3. Upward motion associated with turbulent eddies resulting from the frictional effect of the earth’s surface.
  4. Air forced to rise over a barrier of mountains or hills.

The first of these tends to produce cumulus-type clouds, whereas the next two usually produce layered clouds. The last can produce either cumulus-type cloud or layered cloud depending upon the state of the atmosphere. The range of ways in which clouds can be formed and the variable nature of the atmosphere give rise to the enormous variety of shapes, sizes and textures of clouds.

Types of cloud

The ten main types of cloud can be separated into three broad categories according to the height of their base above the ground: high clouds, medium clouds and low clouds.

High clouds are usually composed solely of ice crystals and have a base between 18,000 and 45,000 feet (5,500 and 14,000 metres).

  • Cirrus – white filaments
  • Cirrocumulus – small rippled elements
  • Cirrostratus – transparent sheet, often with a halo

Medium clouds are usually composed of water droplets or a mixture of water droplets and ice crystals, and have a base between 6,500 and 18,000 feet (2,000 and 5,500 metres).

  • Altocumulus – layered, rippled elements, generally white with some shading
  • Altostratus – thin layer, grey, allows sun to appear as if through ground glass
  • Nimbostratus – thick layer, low base, dark. Rain or snow falling from it may sometimes be heavy

Low clouds are usually composed of water droplets – though cumulonimbus clouds include ice crystals – and have a base below 6,500 feet (2,000 metres).

  • Stratocumulus – layered, series of rounded rolls, generally white with some shading
  • Stratus – layered, uniform base, grey
  • Cumulus – individual cells, vertical rolls or towers, flat base
  • Cumulonimbus – large cauliflower-shaped towers, often ‘anvil tops’, sometimes giving thunderstorms or showers of rain or snow

Most of the main cloud types can be subdivided further on the basis of shape, structure and degree of transparency.

Cumulus

Cumulus clouds are often said to look like lumps of cotton wool. With a stiff breeze, they march steadily across the sky; their speed of movement gives a clue to their low altitude. Cumulus clouds occasionally produce light showers of rain or snow.

Cumulus clouds over water

© Steve Jebson

Cumulus clouds over land

© Steve Jebson

Typically, the base of cumulus clouds will be about 2,000 feet (600 metres) above ground in winter, and perhaps 4,000 feet (1,200 metres) or more on a summer afternoon. Individual clouds are often short-lived, lasting only about 15 minutes. They tend to form as the ground heats up during the day and become less frequent as the sun’s heat wanes towards evening.

The cause of small cumulus clouds is usually convection. Heat from the sun warms the ground, which in turn warms the air above. If a ‘parcel’ of warm air is less dense than the cooler air around it or above it, the ‘parcel’ of air starts to rise – this is known as a ‘thermal’. As it rises it expands and cools, and, if cooled sufficiently, the water vapour condenses out as tiny cloud droplets. A cumulus cloud is born.

The air within the cloud will continue to rise until it ceases to be buoyant. On some sunny days there is insufficient moisture or instability for moisture to form.

In hilly regions, a high, south-facing slope acts as a good source of thermals, and therefore of cumulus. Occasionally, a power station or factory will produce a cloud of its own. 

When air rises in thermals there must be compensating downdraughts nearby. These create the clear areas between cumulus clouds and make it easier for glider pilots to find the thermals that they can use to gain height.

Cumulonimbus

Just as cumulus is heaped cloud, so cumulonimbus is a heaped rain cloud (nimbus means rain).

Cumulonimbus
© N. Elkins

In many ways the rain-bearing variety can be considered as a bigger, better-organised version of the cumulus. A cumulonimbus may be 10 km across and extend 10 km above the ground. This compares with a cumulus cloud which is typically a few hundred metres across and reaches a height of only a few kilometres. Instead of a ball of cotton wool, a cumulonimbus will resemble a huge cauliflower of sprouting towers and bulging turrets.

But there is one important structural difference in that the uppermost levels of the cumulonimbus have turned to ice and become fibrous in appearance, whereas cumulus clouds are composed entirely of water droplets. This icy section at the top may flatten out into an ‘anvil’ shape when the cloud is fully developed. When it reaches this stage, the base is usually dark, and there will be showers of rain or, sometimes, hail. In winter, the showers may be of sleet or snow. The showers are often quite heavy and may be accompanied by lightning and thunder.

Sometimes cumulonimbus will be ’embedded’ or half hidden among other clouds. On other occasions they will be well separated and the ‘anvil’ may well be visible many miles away. Cumulonimbus clouds may be seen at any time of the day, but are most common inland during the afternoon in spring and summer, and frequently occur in the tropics. They develop where convection is at its strongest and most organised.

The lifetime of a cumulonimbus is usually less than one hour.

There are exceptions though. The ‘Hampstead storm’ of 14 August 1975 was an example of a cumulonimbus cloud that managed to keep regenerating itself over one small area of London. About 170 mm of rain fell in three hours, causing severe flooding.

Stratus

Stratus over hills

© Jim Galvin

Stratus over buildings

© A. Bushell

Stratus is a low-level layer cloud (not to be confused with altostratus and cirrostratus, which are much higher). In appearance, it is usually a featureless grey layer. Sometimes, when a sheet of stratus is affecting an area, the cloud base will be right down to the ground and will cause fog. However, the usual base is between the ground and 1,000 feet (300 metres), which means that hilltops may be obscured by cloud. Sometimes stratus will produce drizzle or light snow, particularly over hills.

Perhaps the most important indication of its low altitude is its apparent rapid movement across the sky in any wind stronger than a flat calm. For example, a stratus cloud at 500 feet (150 metres) moving at 20 miles per hour will appear to move much faster than altostratus with its base at 10,000 feet (3,000 metres) moving at 60 miles per hour.

An approximate guide to the height of stratus may be gained by measuring the relative humidity and subtracting it from 100. The resulting number gives some idea of the height of the low cloud in hundreds of feet. For example, 94% relative humidity would indicate that the stratus is about 600 feet (180 metres) above the ground. 

Stratus forms as the result of condensation in moist air at low levels due to cooling. The cooling may be caused in a number of ways:

  1. lifting of air over land due to hills or ‘bumping’ over rough ground;
  2. warm air moving over a cold sea. If the cloud moves in over the land, it will readily cover any relatively high ground. In some cases, the base of the cloud falls to the sea surface, causing fog. This may drift in over the coast and is called sea fog, though it goes by the name of haar in the north and east of Scotland and fret in the east of England;
  3. temperature falling over land at night. The air may have been brought inland during the day on a sea breeze. There needs to be some wind, otherwise the cooling may lead to radiation fog.

Stratocumulus

Stratocumulus clouds usually form between 1,000 and 6,500 feet (300 and 2,000 metres).

Stratocumulus
© Jim Galvin

Stratocumulus will often give a sheet of almost total cloud cover, with perhaps one or two breaks. The cloud elements are rounded and almost join up. Occasionally, the sheet is composed of a series of more or less parallel rolls, which often, but not always, lie ‘across the wind’. Stratocumulus sometimes produces light falls of rain or snow.

Stratocumulus is formed by weak convection currents, perhaps triggered by turbulent airflows aloft. The convection affects a shallow zone because dry, stable air above the cloud sheet prevents further upward development.

Sometimes there are huge sheets of stratocumulus covering thousands of square kilometres around the flanks of a high pressure system, especially over the oceans. The weather below such sheets tends to be dry, but it may be rather dull if the cloud is two or three thousand feet thick.

Altocumulus

Altocumulus clouds usually form between 6,500 and 17,000 feet (2,000 and 5,000 metres) and are referred to as medium level clouds.

Altocumulus
© Steve Jebson

In most cases, there is little difference between the properties of stratocumulus and altocumulus, since both are composed of water droplets and are normally limited in vertical extent. The deciding factor between stratocumulus and altocumulus normally comes down to height as both types are formed in the same way.

Altocumulus also provides a sort of dappled pattern, but, since it is at a greater altitude, the cloud elements look smaller. One significantly different form is altocumulus castellanus, which is like a vigorous medium-level cumulus , sometimes with rain falling from their base, known as trailing virga. This type of cloud is sometimes an indication that thunderstorms will follow

Altostratus

Altostratus clouds normally have a base between 8,000 and 17,000 feet (2,500 and 5,000 metres).

Altostratus © C. S. Broomfield

Altostratus appears as a uniform sheet either totally or partially covering the sky. Sometimes it is thin enough to just reveal the sun or moon. The sun appears as if through ground glass but shadows are not visible on the ground. Sometimes, if the base is below 10,000 feet (3,000 metres) it may give light rain or snow.


Nimbostratus

Nimbostratus
© C. S. Broomfield

Nimbostratus clouds are found between 1,500 and 10,000ft (450 and 3,000 metres).

Nimbostratus forms a thick, diffuse layer of dark grey cloud covering all or most of the sky, which always obscures the sun or moon. It is accompanied by moderate or heavy rain or snow, occasionally ice pellets. Although classed as a medium cloud, its base frequently descends to low cloud levels. Nimbostratus may be partly or even totally obscured by stratus forming underneath in precipitation.

Cirriform clouds

Cirriform clouds (i.e. clouds from the cirrus family) are found at high altitude, usually above 20,000 feet (6,000 metres). They are composed of ice crystals. Three types of cloud make up the group: cirrus, cirrostratus and cirrocumulus.

CirrusCirrus itself is very common in the British Isles and throughout most of the world. It is thin, wispy and white in appearance, and its name, coming from the Latin word for ‘tuft of hair’, gives a good description of the cloud. Another name for the cloud, ‘mares tails’, also conjures up an accurate image. Cirrus may be hooked or straight depending on the airflow aloft. Sometimes it comes as a very dense patch which is left over from the ‘anvil’ cloud of a cumulonimbus that has disappeared. On other occasions, cirrus may be quite extensive when associated with a jet stream – the cloud can then be seen moving across the sky, despite its great altitude. Aircraft condensation trails are a form of man-made cirrus. They can sometimes be seen in ‘historical’ films, to the delight of film buffs who enjoy spotting technical inaccuracies.

CirrostratusCirrostratus is a fairly uniform sheet of thin cloud through which the sun or moon can be seen. Sometimes, if the cloud is thin, a bright ring of light (called a halo) surrounds the sun or moon. A layer of cirrostratus is often an indication of a deterioration in the weather.

CirrocumulusCirrocumulus is often present in small amounts along with cirrus, but rarely does it dominate the sky. On those occasions when it is widespread, a beautiful spectacle is created, especially at sunset. The individual clouds appear very small – often tiny rows of roughly spherical pear-like cloud elements. Sometimes they occur in undulating patterns like tiny ripples.

This information sheet is based on a series of articles written by Dick File that appeared in The Guardian. Web page reproduced with the kind permission of the Met Office

Short-answer questions

1. Make concise definitions of the following terms.
(a) Condensation.
(b) Dew point.
(c) Supercooled.
(d) Humidity.

2. Explain the two ways by which parcels of air can reach saturation.

3. Outline the five factors that will cause parcels of air to
rise and cool.

4. Match up the descriptions in list B with the correct term
in list A:
List A: Cumulus; Cirrus; Stratus; Nimbus.
List B: Rain bearer; Heaped; Thread-like or hairy; Sheets or layers.

5. Which of the following are correct statements?
(i)   Low clouds form up to 10,000
feet above the surface.
(ii)  High clouds form between 17,000
and 35,000 feet above the surface.
(iii) Altocumulus and altostratus are two types
of high cloud.
(iv) Nimbostratus is a medium-level cloud.
(v)  Cumulonimbus is a low cloud.

6. Describe the likely characteristics of the following cloud
types.
(a) Cumulus
(b) Stratus
(c) Cirrus

7. With which cloud formations would you associate the phrase
‘mackerel sky’?

8. What weather conditions might follow the appearance of altocumulus
castellanus?

9. What are contrails? What clouds might they produce over time?

10. Why do most clouds appear white?

11. What prevents clouds from building up to very high levels
in the troposphere?

12. Under what conditions might you find warm, sunny weather,
but no clouds forming?

13. Outline how clouds are measured by observers.

14. Which amount of cloud cover is most commonly observed in
the British Isles? Explain why?

15. Why is it quite rare to observe zero oktas of cloud cover?

16. Explain the two theories that explain how cloud droplets
turn into precipitation.

17. What is cloud seeding?

Web page reproduced with the kind permission of the Met Office

Cumulus clouds over water
Cumulus clouds over land
Stratus over hills
Stratus over buildings

Urban Heat Islands

Urban Heat Island Information

What is an urban heat island?

An urban heat island is a metropolitan area which is significantly warmer than its surrounding rural areas. The temperature difference is usually larger at night than during the day, and is most obvious when winds are weak. One of the main causes of the urban heat island is the fact that there is little bare earth and vegetation in urban areas. This means that less energy is used up evaporating water, that less of the Sun’s energy is reflected and that more heat is stored by buildings and the ground in urban than in rural areas. The heat generated by heating, cooling, transport and other energy uses also contributes, particularly in winter, as does the complex three dimensional structure of the urban landscape.

urban heat island profile
The urban heat island effect is greatest in the Central Business District. Local features such as parks can have a big effect.
Birmingham heatwave
The development of Birmingham’s UHI on the night of the 22nd July 2013, during a heat wave.

What effects do urban heat islands have on measurements of climate change?

Although most of the really long temperature records available to meteorologists come from in or near urban areas, the weather stations tend to be found in parks and open spaces which are less affected by changes in urbanisation. One study has attempted to see how much the urban heat island effect has affected long temperature records, by comparing the temperatures recorded on calm nights (big urban heat island effect) with those recorded on windy nights (less urban heat island effect) – this suggested that the long temperature records were not affected by the urban heat island effect. In other words, any long term trends in temperature seen in the records were probably the same as if they had been recorded in a rural area. In the last few decades, data from satellites has been added to the records available to meteorologists. The IPCC concluded in their 2007 climate change report:

mean temperature England 1772-2008
The Central England Temperature record is the longest available instrumental temperature record in the world.

“Recent studies confirm that effects of urbanisation and land use change on the global temperature record are negligible (less than 0.006°C per decade over land and zero over the ocean) as far as hemispheric and continental-scale averages are concerned. All observations are subject to data quality and consistency checks to correct for potential biases. The real but local effects of urban areas are accounted for in the land temperature data sets used [both by excluding as many of the affected sites as possible from the global temperature data and by increasing the error range]. Urbanisation and land use effects are not relevant to the widespread oceanic warming that has been observed. Increasing evidence suggests that urban heat island effects also affect precipitation, cloud and diurnal temperature range.”

As the climate changes, what impacts will there be on urban areas?

Urban areas are particularly vulnerable to changes in the climate, and, as the world becomes increasingly urbanised, more and more people will become vulnerable to changes in climate and extreme weather events. The 2003 heat wave was considered responsible for 14,802 and 2,045 excess deaths in France and England & Wales respectively. Many of these deaths occurred in urban areas because of the combined effect of the heat wave with the urban micro-climate. Heat waves like this are expected to become more common in the future. The summer of 2003, for example, is expected to become `typical’ by the 2050s. A lot of research is currently going into understanding the urban micro-climate, and into finding ways of designing cities and building to minimise the effect of a changing climate – both by reducing the urban heat island, and by finding ways to cool the insides of buildings.

Conversely, urban heat islands can have important consequences for which areas are most badly affected by fuel poverty.

map showing land surface temperature
The 2003 summer heat wave was greatest in central France and Germany, and was responsible for tens of thousands of deaths across Europe.

Teaching Resources

Urban heat island isotherm drawing exercise: notes for teachers, idealised weather station data for isotherm drawing, satellite image of Birmingham and solution for teachers.

UHI Introduction – Teachers Notes

PowerPoint 1 for use with the Teachers Notes

Teachers Notes on using WOW automatic weather station data to look for urban heat islands with corresponding PowerPoint2 for use in the plenary activity.

Urban Heat Island Fieldwork Resource Packs
Borrow instruments and other lesson resources in order to carry out your own class urban heat island fieldwork. More information available here.

Find out more

http://en.wikipedia.org/wiki/Urban_heat_island

the Met Office guide to microclimates, including urban microclimates

Case Studies of Urban Heat Islands

Reading, Berkshire
M. Parry’s 1955 paper on ‘local temperature variations in the Reading area‘

E. Melhuish and M. Pedder’s 1998 paper from Weather on ‘Observing an urban heat island by bicycle‘

Manchester
Mapping Manchester’s Urban Heat Island a 2010 Weather paper by Knight, Smith and Roberts, looking at the results of the Royal Meteorological Society’s urban heat island experiment in Manchester.

Birmingham
Birmingham Urban Heat Island Information a 1980 paper from Weather.

London
2006 London.gov.uk report or as an rtf.

The urban heat island in central London and urban related warming trends in central London since 1900 – a 2010 Weather paper by Jones and Lister.

Past and projected trends in London’s urban heat island a 2003 Weather paper by Wilby.

Urban warming? An analysis of recent trends in London’s heat island a 1992 paper by Lee.

Chicago

temperatures Chicago
Chicago’s urban heat island is strongest at night, and lasts longer in the winter than in the summer

Rainbows

The rainbow is a familiar sight when the Sun is shining and rain is falling. It can also be seen in the spray from sprinklers and car-washes and in the spray above waterfalls. Sunshine and showers are the ideal condition for rainbows to be seen as they are formed by sun shining through raindrops.

Download rainbow fact file for printing

Where should you look for a rainbow, and when?

rainbowTo see a rainbow you should look opposite from the sun, against a showers or thunderstorms. In the UK, rainbows tend to be most common in the late afternoon and early evening period when the Sun is in the west. Remember: the Sun rises in the east and sets in the west.


rainbow reflected on waterRainbows have been talked about for many years. The ancient Greeks wrote about rainbows as a path made by Iris (the messenger of the Gods) between heaven and earth. Chinese mythology speaks of a slit in the sky sealed by the Goddess Nüwa using stones of five different colours. The Bible in the story of Noah talks about the rainbow of a sign from God that life would never again be destroyed by floods. But perhaps the most famous is that the Leprechauns keep their pot of gold at the end of the rainbow.

Rainbows were first explained by the infamous scientists Sir Isaac Newton and Rene Descartes in the 1600s. Descartes explained that rainbows were caused by the reflection of light from raindrops, but couldn’t explain why. However, Sir Isaac Newton (shown in the picture) explained with the use of a glass prism experiment in 1666 how raindrops separate light into the colours of the rainbow we see.

What colours do we normally see?

The colours we normally see in a rainbow are red, orange, yellow, green, blue, indigo and violet, but really a rainbow has an unlimited number of colours! There are a few different mnemonics that help you remember the seven colours of the rainbow, but one of the favourites is ‘Richard Of York Gave Battle In Vain’ – that’s Red, Orange, Yellow, Green, Blue, Indigo, Violet.

What is the science behind rainbows?

sunlight refracted in raindropsSunlight is refracted in raindrops and is split into the different colours that make up the sunlight. The refracted light is then reflected off the back of the raindrop at an angle of around 42 degrees, which defines the angle in the sky that we see the rainbow. The blue light is a shorter wavelength and so is refracted at a bigger angle than the longer wavelength red light, which means that in the bow you see the red at the top and the blue near the bottom. The spreading out of light at different wavelengths is called dispersion. Because we see only one colour from each raindrop, a great many drops must be present for us to see a rainbow.

Why can we never reach the end of the rainbow and find the pot of gold?

Unfortunately you will never reach the end of the rainbow for two reasons. The first is that because it’s an optical effect then it moves as you move and so you can never reach the bottom. Secondly, and perhaps more importantly, a rainbow is really a circle, it’s just that we see half of it.

Sometimes you can see a secondary rainbow. The secondary rainbow occurs when the light undergoes a double reflection in the raindrop. Because this is a second reflection the colours occur upside down compared to the primary rainbow, and they are dimmer. We call the area in between the two bows Alexander’s band after the ancient Greek Alexander of Aphrodisias who wrote about it. It is possible on very rare occasions to see a third bow, but as by this stage the light is very dim and it appears in the direction of the Sun it is extremely difficult to spot.

Find out More: A short explanation of the colours in the rainbow from  MinutePhysics