Back in 2021 we released the Weather and Climate Teachers’ guide, accompanied by resources for the classroom and teacher CPD.
We are now happy to announce that the CPD ‘More For Teachers’ documents are now available as a series of short films on our YouTube channel.
The videos, like the guide, are aimed at secondary geography teachers to support the delivery of weather and climate lessons to 11–14+ year old students. They are not linked to any specific curriculum and should support teaching across all of the UK.
See the first video here:


Students complete a graphic organiser using videos and information sheets. This could be done as a marketplace activity, where students rotate around stations in the room gathering information.
Adaptation/ mitigation worksheet
Adaptation and Mitigation – information sheets for the activity


Example of climate change adaptation and mitigation – Sheffield and flooding along the River Don
Adaptation Top Trumps – introduction
Adaptation Top Trumps – file for printing
External link: strategies to adapt to inland flooding in Sheffield from Earth Learning Ideas


The Pakistan floods of 2022 – causes -ppt
The physical causes of the Monsoon worksheet
Pakistan Floods are a climate catastrophe video tasks worksheet
The Pakistan floods of 2022 – impacts – ppt

Flooding in Sheffield, causes and attribution to climate change

Cambridge temperature data worksheet
2022 heatwave – consequences for people and place worksheet
Heat waves and climate change worksheet
Knowledge Organiser: 2022 Heatwave in Cambridge Case Study


In this lesson we deal with what hazardous weather is and why our weather is becoming more hazardous.
1.How do we define ‘extreme weather’ and why can it be difficult?
2.What events qualify as “extreme weather”?
3.What has happened to the frequency of extreme weather events globally?
4.What has happened to the distribution of extreme weather events?


Time: 30 minutes
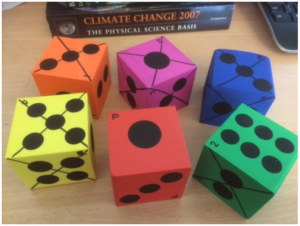
You will need: money.docx printed in colour, WeatherRiskGame.pptx, 6 dice – large ones which the whole class can see work best. I got some foam ones very cheaply.
a) Before the event, mark the dice ‘p’ and 1-5. On the die marked 1, cross out or otherwise mark one side, on the die marked 2 cross out or otherwise mark two sides etc. Crossed-out sides represent good weather and sides which aren’t crossed out represent bad weather. The more sides are crossed out, the lower the chance of bad weather!
b) Use the ppt to guide the activity.
c) The students will need to get into 6 groups. Give each group one colour of money and ask them to cut it up. You should keep the ‘insured’ slips.
d) Each time you play, roll the P dice first. On the basis of which side it shows, the students should decide whether to insure their businesses or not (if a 6 is shown, then there is no chance of bad weather and presumably no-one will insure). If they choose to insure, they should pay you the appropriate sum in return for an ‘Insured’ slip. Then, roll the appropriate die (so if the P die gave a 3, next roll the die labelled 3). If a crossed-out side is rolled, then anyone who was not insured should pay you the appropriate sum.
e) Collect in all the insured slips and start again.
f) Continue until either one team, or all teams except one are out, depending on time.


This resource has been developed by Rob Gamesby (Cool Geography) with the Royal Meteorological Society and the Field Studies Council for the National Festival of Fieldwork.
All schools in England have to produce a Climate Action Plan, and part of that action plan involves assessing the schools’ vulnerability to extreme weather, such as heatwaves, and taking actions to reduce the risk of extreme heat.
These fieldwork options are designed to allow secondary geography students in our schools to explore how vulnerable their school is and what can be done to adapt to that risk.
Scheme of Work – start here!
Background information for teachers
Guidance for school Sustainability Leads
Lesson 1 – Introduction, Community Reminiscences and School Questionnaires
Reminiscences data collection Sheet
Questionnaire data collection sheet
Fieldwork Option – Variations in Temperature in the School Grounds
Fieldwork Option – the impact of trees on temperature
Fieldwork Option – Variations in Temperature between classrooms


Resource produced in collaboration with MEI
Brief overview of session ‘logic’
Mathematical opportunities offered
Download the resources
© 2024 Royal Meteorological Society
RMetS is a registered charity No. 208222