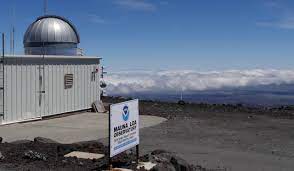





An exam style question suitable for GCSE science.
The units for the data are in fact ppmv which we have simplified to ‘parts per million’ for this question.
This is a nice visualisation of what 420ppmv looks like.
The questions explore the fact that there is a seasonal cycle in carbon dioxide in the atmosphere because plants take up carbon dioxide during photosynthesis in the spring and summer, which is then released back into the atmosphere when plants die and leaves rot in the autumn and winter.
Carbon dioxide is a well mixed gas, meaning that the data recorded at Mauna Loa is representative of the Northern Hemisphere, and that at the South Pole is representative of the Southern Hemisphere.
The seasons are out of phase with each other – when it is summer in the Southern Hemisphere, it is winter in the Northern Hemisphere.
As there is far less vegetation in the Southern Hemisphere than in the Northern Hemisphere, the seasonal cycle is much smaller.
Students may notice that there could also be a human element to the cycle – we burn more fossil fuels in the winter than in the summer (and there are also fewer people in the Southern Hemisphere).
The correct answer for the mean is 416.1 parts per million.
As well as the seasonal cycle, the graph provided shows the increase in atmospheric carbon dioxide since 1958. This increase is because of the emissions of carbon dioxide by human activities including land use change including deforestation, burning fossil fuels and cement production.
https://scrippsco2.ucsd.edu/data/atmospheric_co2/spo.html
https://gml.noaa.gov/webdata/ccgg/trends/co2/co2_mm_mlo.txt
https://climate.nasa.gov/vital-signs/carbon-dioxide/
NOAA/ Susan Cobb
A classroom resource where students submit an (imaginary) application outlining a plan to reduce global warming and increase biodiversity by replanting kelp forests.
Climate Change and Biodiversity
Exploring the links between biodiversity and climate change.
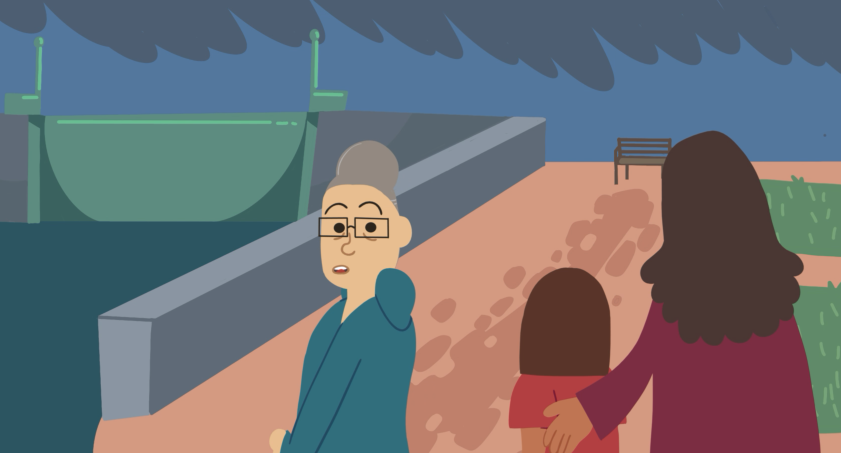
Watch this short animation to learn about the causes and impacts of storm surges in the UK, as well as the expected impact of climate change on them.
At the bottom of the page, you can download a Knowledge Organiser to complement the animation.
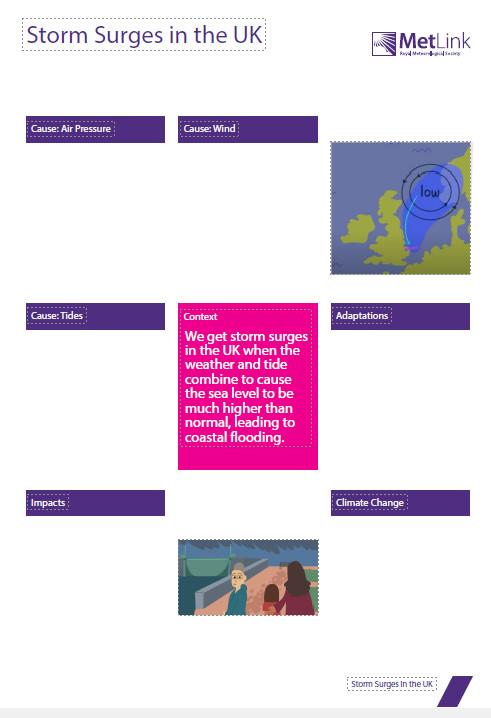
With thanks to the students and staff at Boston College for their contribution to the animation.
‘Saving Venice’ on the BBC iPlayer also has a good explanation of storm surges and overview of some of the innovative responses Venice is implementing.


A diverse range of questions based on applications of physics in weather and climate, including sea level rise, radar frequencies, aerosols, oceanic circulation, tidal barrages etc.
Isaac Physics is an online study tool developed by the University of Cambridge. Isaac Physics questions are self marking practice questions for secondary school and undergraduate scientists.
Isotrope Concentrations and Ocean Circulation
Radar wavelengths and frequencies

Climate-based questions for students and teachers. A team of students and academics at the University of Oxford developed these Maths for Planet Earth questions.

Learning Objectives
In its acceptance speech at COP26, Egypt celebrated its renewable energy resources:
This is an extract from https://unfccc-cop26.streamworld.de/webcast/closing-plenary-of-the-cop-followed-by-cmp-and-c-2 from 09:20
‘Egypt transitioned from the traditional energy sources to renewable, more sustainable and planet-friendly energy sources…’
One of these resources is the huge Benban solar farm.
Watch the relevant part of the COP26 plenary video and/ or


images from google maps
Discussion point: What is a kWh? (if 1 kWh is the electrical energy converted by a 1 kW appliance used for 1 hour rephrase this in terms of electrical energy generation. See https://www.bbc.co.uk/bitesize/guides/z2h4dxs/revision/1 for more detail)
Discussion point: So what is a kWh/ m2?
Extension: Express this answer as a proportion or percentage
(37.2km2 = 37 200 000m2 so 2366 x 37 200 000 = 88,015,200,000 kWh = 88 015.2 GWh = 88.0TWh)
Discuss: kilo, mega, giga, Tera etc.
Extension – write this as a proportion or percentage
Discussion – why so much? Solar panels don’t cover the whole of the ground, solar panels are actually less efficient when they get hot, you can see solar panels, so they must be reflecting some of the Sun’s light, not absorbing it all etc.)
(cost = power (kW ) x time (hours) x price (per kWh).
So value = 3, 800, 000, 000 kWh x 2/52 x 28.34 = £41,420,000.
Discussion – is that surprising?
Why might the quantity of electricity produced actually be different? (We started with an annual value, but the seasons and the weather will actually have an impact on how much is produced in a given week).


The 2022 United Nations climate change conference (27th session of the Conference of Parties – COP27) will be held in Sharm El-Sheikh in Egypt, starting on the 7th of November.
In the introduction video screened at the end of COP26 in Glasgow, Egypt celebrated its adaptations and mitigations to climate change. In this resource, students will explore population growth, urbanisation and the greenhouse gas emissions from the construction industry in Egypt.
Resources:
Learning Outcomes


Calculate the best flight time from A to B and reduce greenhouse gas emissions!
The table below represents a cross section through the atmosphere and gives wind speeds (in m/s) in boxes which are 200km long and 1km high.
Your task is to pilot an aircraft, which flies at 230m/s when it is flying in the less dense atmosphere higher than 5km, and 150m/s when it is flying in the more dense atmosphere lower than 5km, from A to B in the shortest time possible.
Remember, flying in the same direction as the wind increases your speed but flying against the wind slows you down.
Map your route on the chart below and then calculate the flight time!
Rules

Some students may find the following table useful:


In this activity students use current data to investigate the UK’s energy resources.
Go to gridwatch.co.uk and use the table and the key at the bottom of the page to complete the following table. This website shows you where the UK’s electric power is coming from and what the total demand (use) is and has been over the past year.
(1 GW = 1 000 000 000W)

Extension
By looking at the total energy demand, and the production by wind energy, what can you deduce is the purpose of gas turbines?
Can you see any correlation between wind output and gas turbine output?
Opportunity for Group Work
Make a poster or presentation showing what you have learned.
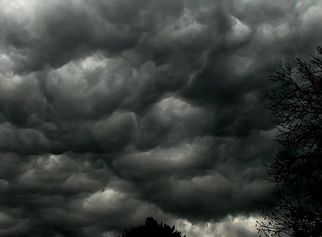
In this activity, students will test the hypothesis that “When the clouds are darker, more of the Sun’s light has been scattered and so less light reaches the ground”
Advice for teachers
Ideally, this activity should be carried out over a week or longer. This could mean that different classes contribute towards collecting the data.
You will need
Advice

Extension
Draw a graph which shows light level against grey scale number

Questions


We can’t see or feel atmospheric pressure but rely on barometers to tell us how the pressure is changing.
Pressure changes with altitude. Changing weather patterns can also lead to changing atmospheric pressure.
For these exercises, you will need to download the phyphox app onto your phone or, if you are working in small groups, onto one person’s phone.
You will also need a tape measure (5m) and access to an open stairwell – the higher, the better!

Using the following information, calculate the theoretical atmospheric pressure at the surface of the Earth:
Total mass of the atmosphere: 5 x 10¹⁸kg
Radius of the Earth: 6370km (OR surface area of Earth = 5.1 x 10 14 m2)
Gravitational field strength, g = 10 ms-2
Pressure = force/ area
Pressure = mass x g/ (4 pi r2)
Pressure = (5 x 1018 x 10)/ (5.1 x 10 14)
Pressure = 98057 Pa
Alternative units: 1hPa = 100 Pa
1 millibar (mbar) = 1 hPa
Now open the app and select pressure:

Now use the forward arrow to start measuring the pressure:

Record the current air pressure in your classroom in Pa __________________________________
What proportion of the theoretical atmospheric pressure you calculated above it this (express your answer as a percentage)?___________________________
Move to an open stairwell and complete the following table, using a tape measure to record the vertical distance you have ascended between each measurement you make. Make sure that you make your first measurement at floor level.

Now draw a graph of change in atmospheric pressure (dependent variable) against height (independent variable).
Complete the following sentence “A pressure change of 1hPa indicates an altitude change of ____m”.
Extension Questions
Many smart phones, watches etc. are equipped with pressure sensors so that they can be used to calculate altitude.
1) If you used a phone (in flight safe mode) to measure the pressure inside an aeroplane in flight, why won’t it give you an accurate indication of the height you are flying at?
2) You are on a many-day expedition to the Himalayan mountains and you are using the pressure sensor in your watch to tell you how high you are. Why would it not be safe to rely on this information?
(resources created from ideas on https://phyphox.org/)
