KS3 Maths – Moving Around

Open Road lesson 1 – Moving Around

Outline
Students are to traverse a network in the most efficient manner possible. Consider different information to influence their decisions on the best route to take.

Objectives
By the end of the lesson:

All student will analyse a network and select the most efficient route
Most students will analyse a network and select the most sensible route using additional information
Some students will consider three factors to select the most sensible route at the most appropriate timing

Lesson plan

Main Body
Pupils should be given the road network worksheet and information sheet.

Activity 1
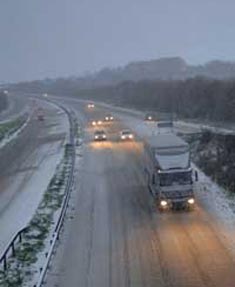
The objective for the pupils is to plan a route for the driver of a gritting lorry. Pupils use the information and the map to find the quickest route that allows all roads to be covered at least once. The path should begin and end at the depot (it is not possible to complete the route without overlapping). Pupils should add up the time taken to complete their chosen route and best solutions discussed. Note: some roads are A roads some B.

Activity 2
Pupils are now given the road temperature forecast graphs. The best time to spread grit salt is just before the road temperature freezes (discuss with pupils why this might be). Pupils should use the information given about the freezing time for each road to plot the best route for the gritter to take now.

Extension Activity
When a group have found their optimum route they should then use the timing cards from activity 1 to establish how long their route will take and decide what time the driver should start work/take breaks etc.

Plenary
Discuss how additional information can change the decisions you make.

Lesson resources
Open Road distances standard
Open Road distances advanced
Open Road network map
Open Road temperatures

Web page reproduced with the kind permission of the Met Office.
KS3 Maths – Keeping the Roads Open

Open Road Lesson 2

Outline
The main activity is essentially a simulation of County Council decision making when roads are forecast to freeze. Pupils use temperature forecasts from the Met Office to decide how much salt to spread on the roads and calculate the cost.

Objectives
By the end of the lesson:

All student will use the information from a graph and translate into a response using a key. Most students will evaluate the decisions made in light of additional information.

Lesson Plans

Starter
Discuss the effects of icy roads, videos of cars skidding from YouTube can be used to illustrate the point.

What are the impacts? Tease out responses of the costs in terms of financial, for example: social costs (costs to NHS/Police), economic costs (lost productivity of workers having time off) and personal costs (damage of car). Make the point that with costs like these it is worth gritting to reduce the impacts.

Main body

Pupils (working in pairs) to be given the road gritting planning sheet.

Pupils should use the gritting flowchart (based on a real life plan used by the councils) to decide how much grit should be spread by the council each night following the forecasts given. Pupils should be reminded that weather forecasts are forecasts of what is expected to happen and that conditions might change meaning reality is a little different.

Give the pupils the forecast information sheet.

Go through the first example showing forecast temperature, allowing students to decide what quantity of grit to use and then actual temperature, review this decision.

Using the forecasts for the next few days allow students to assess each day and work out the cost of grit for the week.

Once pupils have successfully assessed the cost of their choice for each day the actual temperature graph for that day can be revealed.

Plenary
Discuss the difference in choices, and the impact that pupils felt they made by their choices.

Lesson resources
Open Road network map
Open Road Temperatures
Open Road gritting flow chart
Open Road gritting planning sheet

Web page reproduced with the kind permission of the Met Office.

KS3 Maths – Is Temperature Rising?

Is temperature rising?

Key Stage 3, Maths

Prior learning
A basic knowledge of averages would be useful. The ability to use Excel if computers are used, or the ability to draw line graphs from data.

Objectives
By the end of the lesson:

Students will demonstrate that the temperatures in England are rising
Students will produce a report to justify their findings using graphs and charts where necessary

Lesson plan

Look at the graphs. Discuss what the graphs might be showing. If each one is showing the same thing, what could they be? (Use negative axis to help – they show temperatures over a 10 year period)

What time of the year or where in the world might they be showing? Students to discuss:

  • B – summer (July)
  • C – winter (January)
  • A and D are yearly averages

The Met Office has records of temperature in England. When do you think they started recording temperatures? (1659 is when they recorded a temperature for the country called the Central England Temperature (CET))

Discuss differences between earlier recordings and 1671 then 1699 (reading become more accurate so decimals were used). From the graphs that you have looked at over four different 10 year periods can you tell if temperatures are rising? (No)

Look at the worksheet. Here is a sample of temperatures from one 10 year period. Assign each pair/group to draw the graph for an individual month’s temperatures over the 10 years (x-axis is year, y-axis is temperature).

Once graphs are drawn encourage pupils to think about the questions at the bottom of the page.

Plenary
Discuss results of graphs and questions.

Lesson resources
Central England Temperatures

These monthly mean temperatures are representative of a roughly triangular area of the United Kingdom enclosed by Lancashire, London and Bristol. The monthly series, which begins in 1659, is the longest available instrumental record of temperatures in the world. Live data of Central England Temperatures are available here.

Is temperature rising graphs.

Is temperature rising worksheet.

Web page reproduced with the kind permission of the Met Office.