
Developed in Partnership with Dr Frost Learning, these resources are suitable to 11-16 maths teaching (KS3 and KS4 in England), unless otherwise indicated.
Each lesson features a lesson PowerPoint as well as printable exercise and investigation sheets.
Substitution with the Four Operations and Integers
Substitution is the process of replacing the variables in an algebraic expression, usually with a numerical value. We can then work out the total value of the expression.
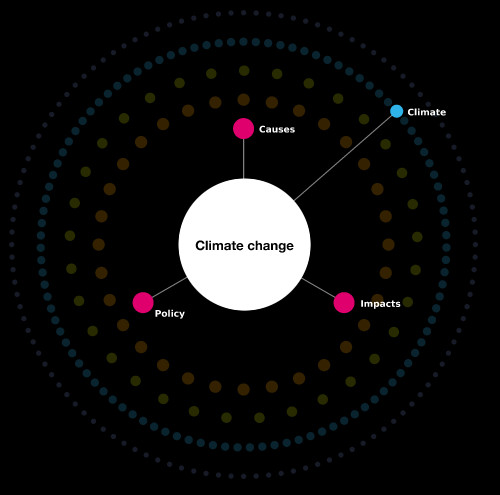
Climate change context
Calculating household carbon dioxide emissions
Prior Learning:
- Negative numbers and arithmetic
- Decimals and arithmetic
- Fractions and arithmetic
- Powers and roots
- Basic algebraic notation
- Using function machines & their inverses
Integer Substitution with Powers and Roots
Climate change contexts:
Substitution and the Sahara
Rainforest deforestation
Prior Learning
- Substitution with four operations and integers
- Using notation for powers and roots
- Knowing powers and roots with base 2, 3, 4, 5 and 10
Substitution with Fractions and Decimals
Prior Learning
- Decimals and arithmetic
- Fractions and arithmetic
- Powers and roots
- Basic algebraic notation
- Substitution using integers with the four operations
- Substitution using integers with powers and roots
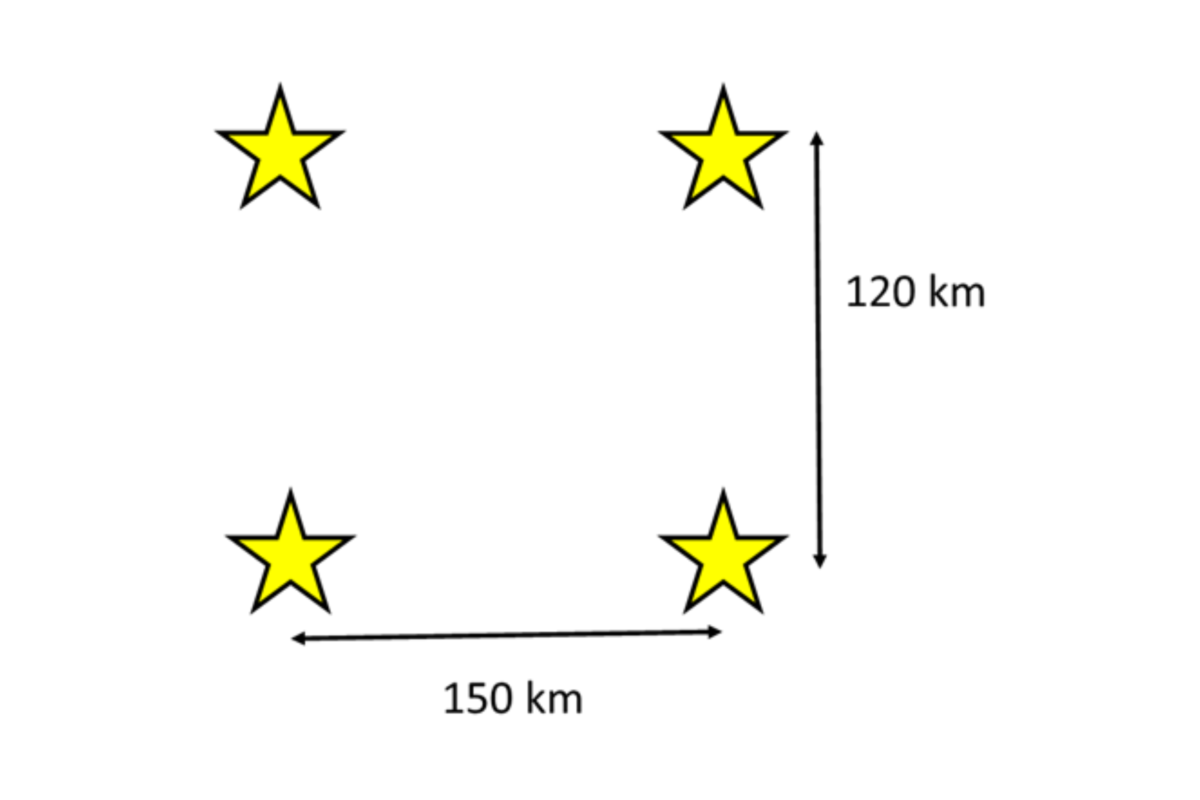
Investigation Sheet 1 – Wind Turbine
Investigation Sheet 2 – Wind Turbine
Form Simple Expressions
Climate Change Contexts
Arctic warming
Building insulation
Carbon footprint of social media
Emissions reductions
Prior Learning
- Use and interpret algebraic notation, including:
–ab in place of a×b,
–3y in place of y+y+y and 3×y,
–a/b in place of a÷b,
–coefficients written as fractions rather than as decimals.
–brackets
- Simplify expressions with sums, products and powers including index laws
- Distinguish between expressions, equations, inequalities, terms and factors
- Algebraic substitution
- Recognise & create equivalent expressions
- Order of operations
Form and Use Simple Formulae
Climate Change Contexts
Tree planting
Vehicle emission reductions
Solar panel output
Prior Knowledge
- Use and interpret algebraic notation, including:
–ab in place of a×b,
–3y in place of y+y+y and 3×y,
–a/b in place of a÷b,
–coefficients written as fractions rather than as decimals.
–brackets
- Simplify expressions with sums, products and powers including index laws
- Distinguish between expressions, equations, inequalities, terms and factors
- Algebraic substitution
- Recognise & create equivalent expressions
- Order of operations
- Form simple expressions
Form and Solve Linear Equations from Simple Contexts
Climate Change Context
Emission reductions and net zero
Prior Knowledge
- Solve simple linear equations.
- Solve linear equations with brackets.
- Solve linear equations where the variable appears on both sides of the equation.
- Solve linear equations involving brackets.
- Expanding single brackets.
- Form simple expressions & formulae.
- Use and interpret algebraic notation, including:
–ab in place of a×b,
–3y in place of y+y+y and 3×y,
–a/b in place of a÷b,
–coefficients written as fractions rather than as decimals.
–Brackets.
Form and Solve Linear Equations for Problems Involving Perimeter and Area
Climate Change Context
Carbon footprint/ growing food
Tree planting
Prior Knowledge
- Find the area and perimeter of simple shapes.
- Solve simple linear equations.
- Solve linear equations where the variable appears on both sides of the equation.
- Expanding single brackets.
- Form simple expressions & formulae
- Use and interpret algebraic notation, including:
–ab in place of a×b,
–3y in place of y+y+y and 3×y,
–a/b in place of a÷b,
–coefficients written as fractions rather than as decimals.
–Brackets
- Simplify expressions with sums, products and powers including index laws
- Distinguish between expressions, equations, inequalities, terms and factors
- Algebraic substitution
- Recognise & create equivalent expressions
- Order of operations
Changing the Subject – One Step
Climate Change Context
Ocean Warming
Prior Knowledge
- Solve simple linear equations.
- Expanding single brackets.
- Form simple expressions & formulae
- Use and interpret algebraic notation, including:
–ab in place of a×b,
–3y in place of y+y+y and 3×y,
–a/b in place of a÷b,
–coefficients written as fractions rather than as decimals.
–Brackets
- Simplify expressions with sums, products and powers including index laws
- Distinguish between expressions, equations, inequalities, terms and factors
- Algebraic substitution
- Order of operations
Dr Frost Learning is a UK registered charity with goal of delivering high quality education for all individuals and institutions regardless of income, centred around the philosophy that education is a fundamental right of all and central to addressing social inequality on a global level. The charity was founded by Dr Jamie Frost and he received the Covid Hero Award in the Global Teacher Prize 2020.


