Experiments with an Infrared Thermometer

Infrared Thermometer Guidance

Infrared thermometers can be used to explore a range of questions, including:

– What is the temperature of the clouds?

– What is the greenhouse effect?

– If it is sunny, how does the temperature of dark/ light/ reflective things vary?

– Do clothes insulate?

– Which are the best/ worst insulated school buildings?

– What is the temperature of the Sun?

– What is the air temperature?

– How does evaporation depend on temperature?

Which questions you explore will depend on the weather, and level and ability of your students.

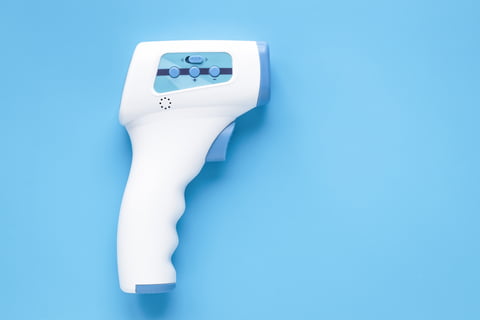
Basic Information about the Infrared Thermometers:

The thermometers are used by pointing them at the object you want to measure the temperature of (they don’t have to touch it!) and by pressing and holding the large black button on the front of the thermometer. They detect the infrared (IR) radiation (heat) given off by the object and from it, calculate the temperature of the object. It is the same principle that is used by wildlife photographers to detect animals at night. They do not give an accurate reading from a shiny surface.

Please be aware that the thermometers are equipped with a laser pointer on the front. For safety reasons, these have been covered up, and should not be uncovered. The yellow/ black thermometers have a laser button which should be switched off (no laser symbol on the display screen) to save battery power.

The infrared thermometers we send out have an optical resolution of 12:1 distance to spot ratio. This means that they can measure the temperature of an object which is at least 1/12 of the size of the distance the thermometer is away from the object. So, the temperature of an object 1m high and 1m wide can be measured from up to 12m away, whereas the temperature of a cloud 1km wide can be measured from up to 12km away. The further something is away, the bigger it has to be for you to be able to measure its temperature.infrared thermometer

For experts: The thermometers respond to 8–14 μm (long-wavelength infrared)—this range is not affected by water vapour or CO2 absorption. By integrating the Planck function over this range (Planck’s law describes the amount of energy emitted by a black body as radiation of a certain wavelength), the temperature of the dominant infrared source in the field of view may be obtained.

As an introduction, students could be asked to see what the coldest and warmest objects they can find are. They can compare the temperature of bare skin (face or hands) and clothes. If the sun is not actively heating up dark clothing, then the clothing should be cooler than the bare skin, demonstrating the insulating properties of clothing. By pointing the thermometer into an open mouth (without making contact!) you can get a good estimate of body core temperature.

Activity 1: What effect does colour have on temperature?

This activity works best on a sunny day.
Ask the students to compare the temperature of similar dark- and light-coloured objects. Zebra crossings and cars of different colours standing in a car park are particularly good for this. When asked why, for example, the black strip on a zebra crossing is warmer than the white stripe, students will usually respond that dark colours absorb heat better than light colours. Although this is true, it is the fact that they also absorb light better that is more important in this case. The Sun emits more light than heat. Dark colours look dark because they have absorbed the Sun’s light rather than reflecting it back in the direction of our eyes.

Sunny and shady

If the sun is shining, measure the temperature of the ground (eg tarmac, concrete, grass) in sunlight and nearby in shade.

Wet and dry

Put some water on part of a tarmac or concrete surface and leave it for a couple of minutes. Does the wet bit have the same temp as the dry bit? If not, why not?

Activity 2: What is the temperature of the clouds?

First, point the thermometers at a range of objects in the shade on the ground and get an estimate for the air temperature at ground level. Next, point the thermometer at any cloud (there may well be several types of clouds visible, which will give different results) and measure its temperature. Are the clouds warmer or colder than the ground? So does temperature rise or fall with height?

Temperature falls with height. The Sun warms the ground. The ground warms the air in contact with it (by conduction). The warm air rises, and, as it rises, the air pressure falls (air pressure is due to the weight of air above us. As you go up in the atmosphere, there is less air left above you and so the air pressure falls) and it cools (this is called adiabatic ascent and P/T=constant).

This can be related to the water cycle – as temperature falls, the rate of condensation becomes faster than the rate of evaporation and water droplets form to make clouds.

So why is the cloud base usually flat? It marks the level in the atmosphere where the temperature is just right for cloud droplets to form.

So what are high clouds made of? The highest clouds, called cirrus, are made of ice crystals which gives them their wispy appearance.

You can calculate the height of the clouds by assuming that the temperature falls by 6°C for every km of height (or use 10°C/ km for less able students).

Find a cloud key, chart or wheel to help you name the clouds.

Activity 3: Which buildings are best insulated?

This is a good activity for a cold winter’s day when the Sun is not shining.

Use the IR thermometers to investigate surrounding buildings – what is warmest, walls, windows or doors? The less well insulated a building is, the more heat it is letting out and the warmer the outside of the building will be. Are older buildings less well insulated than newer ones? Where would you recommend the school to invest in insulation?

Activity 4: What is the blue sky temperature?

Ask the students to measure the temperature of any blue sky visible. What are they measuring the temperature of? Some will respond ‘the ozone layer’. Whilst this is technically correct – ozone in the stratosphere absorbs the Sun’s ultraviolet (UV) light and re-emits the energy as heat, the ozone layer is sufficiently high up to not have a major impact on the temperature measured. Greenhouse gases in the atmosphere (water vapour, carbon dioxide, methane etc.) emit heat towards the Earth’s surface and therefore the infrared thermometers.

If the sky is completely blue, how does the temperature vary from the horizon to vertically upwards? Usually, the sky is warmer near the horizon than straight up.the earth's atmosphere

When the thermometer is pointing straight up (yellow arrow) it is looking through a fairly thin bit of the Earth’s atmosphere. When it is pointing towards the horizon (blue arrow) it is looking through much more atmosphere, therefore there is more greenhouse gas and more heat being radiated in the direction of the thermometer.

More Information (page 1 and 4)

Activity 5: What is the temperature of the Sun?

Students should be reminded never to look at the Sun!

If pointing the IR thermometer away from the sun on a clear summer’s day gives a temperature of z and pointing direct at the sun gives y.

Sun to Earth distance DSE is 149,600,000 km

Diameter of spot at this distance = DSE /12

Radius of spot at this distance = DSE /(12×2)

Spot size at this distance =pi(149,600,000/(12×2))2=1.22×1014 km2

Diameter of the Sun, D, is 1,392,000km

Area of the sun is pi(D/2)2 = 1.52×10¹²km2

So, the Sun covers 1.52 x10¹² / 1.22×10¹⁴ , about 1/80th of the field of view.

y = ((79 x z) + (Ts x 1))/80

We have estimated the temperature of the Sun,Ts, between 2500K and 4500K using this method.

The accepted temperature of the Sun is 5778K. Possible sources of error include the fact that the Sun doesn’t emit much radiation in this IR band, and that the atmosphere is scattering the incoming radiation away from a straight line path from the Sun to the thermometer, reducing the reading.

Activity 6: What is the air temperature?

Air temperature is not easily measured with an IR thermometer. However, to get a reasonable estimate, we suggest using sheets of A4 white paper. They will only take a few minutes to adjust to the local temperature (as would any other thermometer) and could be placed on the ground in different locations, or hung off bushes etc. with clothes pegs or bluetack. The IR thermometers can then be used to measure the temperature of the paper.

Activity 7: How do Evaporation Rates depend on temperature?

The Key Stage 2 National Curriculum asks students to investigate the effect of air temperature on evaporation rates. However, wind speed and sunlight can play a much larger role, swamping the signal from air temperature. By measuring the temperature of the object using an infrared thermometer, rather than the air temperature, you should get much better results, as the temperature of the object will reflect the amount of sunlight it is absorbing as well as any wind chill.

 Object Temperature (oC) Is it sunny or not?
 White car  
 Black car  
 Grass  
 Tarmac  
 Object in sunshine  
 Object in shade  
 Dry tarmac  
 Wet tarmac  
 Cloud (what type?)  
 Cloud (what type?)  
 Blue sky  
 Your forehead  
 Your clothes  

Use this table to write down the temperatures of things you measure. Choose some things of your own to measure and write their temperatures in the last few rows.

Borrow an Infrared Thermometer

Did you know the Royal Meteorological Society lends instruments to schools free of charge?

Make a Rain Gauge

Make your own Raingauge

For measuring the amount of rain

Equipment

◊ A 2 litre clear PLASTIC DRINKS BOTTLE (coca cola, water etc)

◊ SCISSORS

◊ PAPERCLIPS

◊ JELLY (3 or 4 cubes made up as directed on the packet), plasticine or paraffin wax.

◊ RULERA water bottle

Method

1. Cut off the top of this bottle about a quarter of the way down, below the neck of the bottle, where the diameter is constant. Cut smoothly.

2. Take the bottle top that you have cut off, turn it upside down and place it back in the bottom part of the bottle. It should fit snugly but to make sure it does not fall out use a few paper clips to hold the two halves together. This reduces the amount of water that evaporates from the bottle. 


A rain gauge


3. The bottles are usually shaped at the bottom; however, you need a completely flat bottom to be able to measure the depth accurately. To achieve this pour in some brightly coloured jelly mixture or paraffin wax and let it set in the bottom of the bottle. Depths can then be measured from the top  of the jelly. Jelly does tend to attract slugs (and eventually goes off)! Alternatively, if you have access to a measuring cylinder,  you can not bother with this stage and just pour the collected water into a measuring cylinder every day. This will give you a volume rather than a depth of water (rainfall is usually reported in mm). 


4. Attach a ruler to the side of your rain gauge in order to measure the amount of water collected. Remember to line up the zero with the top of the jelly not the bottom of the bottle.


5. Place the rain gauge outside – if possible, in a plant pot with soil around it to give it extra stability.

6. Read the depth of water in the gauge every day and empty it. You’ll also need to check it for slugs, leaves and spiders’ webs!

More experiments and demonstrations

Borrow an Instrument

Did you know the Royal Meteorological Society lends instruments to schools free of charge?

Make a Hygrometer

Make your own Hygrometer

Wet and Dry Bulb Thermometers measure relative humidity

Equipment

◊ Clean, empty 1 pint milk/soup CARTON

◊ 2 small THERMOMETERS (e.g. fish tank/bath)

◊ SELLOTAPE

◊ WATER

◊ COTTON WOOL BALL

◊ STRINGA milk cartonBalls of string

Method

1. Punch 2 holes in the top of the carton (where the lid comes together), thread a long piece of string through the holes and tie the ends together to form a loop. This will form a handle for your hygrometer.

2. Cover the bulb of one of the thermometers with the cotton wool ball, tie in place with some string. Soak the cotton wool in water and tape the thermometers to either side of carton.”

3. Go outside and swing the carton around for 1 minute. Quickly look at the temperatures on the two thermometers and write them down.

Find out what your results mean……..

Results

You should find that the ‘wet bulb’ (i.e. with wet cotton wool) thermometer shows a LOWER temperature reading than the ‘dry bulb’.

This is because water evaporating from the cotton wool is cooling the wet bulb thermometer down. The easier it is for water to evaporate, the BIGGER the difference between the two thermometers and the DRIER the air.A hygrometer

You can convert the two readings into a RELATIVE HUMIDITY (amount of moisture in the air as a percentage of that needed to saturate it) by entering your values into this converter.

(note the relative humidity is not very dependent on pressure – if you do not know the air pressure, just enter 1000 hPa). You might sometimes see millibars written instead of hPa – these are equivalent units.

More experiments and demonstrations

Borrow an Instrument

Did you know the Royal Meteorological Society lends instruments to schools free of charge?

Make an Aneroid Barometer

Make your own Aneroid Barometer

Measure Air Pressure

Aneroid barometers do not use fluids such as mercury or alcohol.

Equipment

◊ An empty food or coffee tin (washed!) – the wider the better. Make sure that it doesn’t have a sharp edge where the top was removed.

◊ A large balloon

◊ A rubber band that will fit snugly around the tin

◊ A pin

◊ Glue (runny paper glue is best)

◊ A drinking straw (the longer the better)

◊ Paper

Method

1. Cut a large piece of the balloon and stretch it over the tin. Hold the balloon in place with a rubber band stretched around the tin, over the balloon. Make sure that there is a tight seal around the rubber band,
with no air leaks.

2. Use a little glue and attach the straw to the middle of the balloon (see photo). Then use a little more glue and attach the pin to the other end of the straw (see photo)

3. Take a piece of paper and, using a ruler, place some regularly spaced lines on it. Set up the
tin and paper as shown in the photo.

An aneroid barometer


How can I use this to measure temperature?

The needle rises and falls because of air pressure. As the air presses down (increased atmospheric pressure) on the balloon, the needle will rise. When the air pressure decreases on the balloon, the needle will fall. The change in barometric pressure will help you to forecast the weather. Decreasing air pressure often indicates the approach of a low pressure area, which often brings clouds and precipitation. Increasing air pressure often means that a high pressure area is approaching, bringing with it clearing or fair weather.

Note that this barometer will be sensitive to changes in temperature as well as to changes in air pressure. It will work best in a place where the temperature stays pretty constant. Small pressure changes could well be masked by temperature changes, but you should be able to observe large pressure changes (for example as a weather system passes through) with it.

You could try and calibrate your barometer by finding out the current pressure from the Met Office website and then seeing how much it moves as the pressure changes.
The air pressure varies between about 970-1040mb as weather systems pass over. Pressure also falls with height. At the top of Mount Everest the pressure is only 330mb.

Find out more

There is lots more information about barometers on the Barometer World website.

A tin can

One of the things you need to make your barometer.

Borrow an Instrument

Did you know the Royal Meteorological Society lends instruments to schools free of charge?

Make a Barometer

Make a Barometer

Measure air pressure

Equipment

◊ An empty 2 litre plastic water bottle.

◊ A ruler (30cm)

◊ Sellotape

◊ 40cm of clear plastic tubing

◊ Bluetack

◊ Water (with optional food colouring)

◊ A pen that will draw on plastic

A barometer


Method

1. Cut off the top of the bottle. Begin by standing the ruler in the bottle. Tape the ruler to the outside of the bottle. Make sure that the numbers on the ruler are visible through the bottle.

2. Stand the plastic tube inside the bottle. Tape the tube to the bottle, but make sure that the tube is not touching the bottom of the bottle – raise it by a couple of cm. As tape will not stick well under water, make sure that the tube is mainly secured higher up. It doesn’t matter if the tube is not very straight.

3. Fill the bottle about half way with water. Use the plastic tube like a straw and draw some water half way up the tube. Use your tongue to trap the water in the tube. Quickly move the bluetack onto the top of the tube to seal it. This is the tricky part!

4. Make a mark on the outside of the bottle to record where the water level is in the tube. Each time you notice a change in the water level, make another mark.

How can I use this to measure pressure?

You’ll notice, over time, that the water level rises and falls. Pay attention to the change in weather as the water level changes and, if possible have a look at BBC Weather to find out what the actual pressure is where you are.

The water in the tube rises and falls because of air pressure exerted on the water in the bottle. As the air presses down (increased atmospheric pressure) on the water in the bottle, more water is pushed into the tube, causing the water level in the tube to rise. When the air pressure decreases on the water in the bottle, some of the water will move down out of the tube, causing the water level in the tube to fall. The change in barometric pressure will help you to forecast the weather. Decreasing air pressure often indicates the approach of a low pressure area, which often brings clouds and precipitation. Increasing air pressure often means that a high pressure area is approaching, bringing with it clearing or fair weather. The air pressure varies between about 970-1040mb as weather systems pass over. Pressure also falls with height. At the top of Mount Everest the pressure is only 330mb.

Borrow an Instrument

Did you know the Royal Meteorological Society lends instruments to schools free of charge?

Make a Wind Meter

DIY Wind Meter

A simple anemometer

Equipment

◊ Stick or broom handle.

◊ 5x10cm pieces of thin string or cotton

◊ Tissue paper, writing paper

◊ Cooking foil, thin card, thick card

windmeter diagram

Method

1. Cut approximately equal sized strips of tissue, paper, foil, thin and thick card, and made a hole near one end.

2. Using the string, tie each strip to the stick, with as much space as possible between them.

3. Take your wind meter outside and hold it as high as you can. Which strips are moved by the wind? You could try and find the windiest place – do the buildings and trees around you shelter you from the wind, or funnel it?

Related Experiments

Why not have a go at making a DIY anemometer, which will give you an idea of how fast the wind really is. Alternatively, if you have access to a bought anemometer, you could try calibrating your wind meter – what wind speed do you need to have before each strip gets blown around?

Borrow an Instrument

Did you know the Royal Meteorological Society lends instruments to schools free of charge?

Make an Anemometer

Make your own Anemometer

For measuring wind speedPing pong balls

Equipment

◊ 30cm of strong THREAD or fishing line

◊ A PING PONG or other small, light, plastic ball

◊ SELLOTAPE

◊ PROTRACTORA protractor

◊ A piece of strong CARDBOARD

15cm x 10cm

Method

1. Stick the protractor to the cardboard with sellotape, with the straight edge at the top of the card.

 string angle degree  90  80  70  60  50  40  30  20
 wind speed m/s  0  3.6  5.3  6.7  8.1  9.4  11.4  14.4

2. Write the above wind conversion chart onto the cardboard.

3. Using sellotape attach the thread to the ping pong ball. Tie or glue the other end of the thread to the centre of the top edge of the protractor.

4. Hold the cardboard in the direction that the wind is blowing, so the ball is caught by the wind. You will see the thread makes an angle that you can measure on the protractor.
Convert the angle the thread makes to a wind speed using the conversion chart.
If you have one, compare your readings to those made with a ‘real’ anemometer – how does it compare? Otherwise, compare your readings with the Beaufort Scale.

The Beaufort Scale

Wind Force  Description  Speed (m/s)  Speed (knots)  Specifications
 0  calm  0-0.2  0  Smoke rises vertically
 1  light air  0.3-1.5  1-3  Direction shown by smoke drift but not by wind vanes
 2  light breeze  1.6-3.3  4-6  Wind felt on face; leaves rustle; wind vane moved by wind
 3  gentle breeze  3.4-5.4  7-10  Leaves and small twigs in constant motion; light flags extended
 4  moderate breeze  5.5-7.9  11-16  Raises dust and loose paper; small branches moved.
 5  fresh breeze  8.0-10.7  17-21  Small trees in leaf begin to sway; crested wavelets form on inland waters.
 6  strong breeze  10.8-13.8  22-27  Large branches in motion; whistling heard in telegraph wires; umbrellas used with difficulty.
 7  near gale  13.9-17.1  28-33  Whole trees in motion; inconvenience felt when walking against the wind.
 8  gale  17.2-20.7  34-40  Twigs break off trees; generally impedes progress.
 9  strong gale  20.8-24.4  41-47  Slight structural damage (chimney pots and slates removed).
 10  storm  24.5-28.4  48-55  Seldom experienced inland; trees uprooted; considerable structural damage
 11  violent storm  28.5-32.6  56-63  Very rarely experienced; accompanied by widespread damage.
 12  hurricane  32.7+  64+  Devastation

For more advanced students

Can you do your own calculation to relate wind speed to the angle of the string?
Think about the forces acting on the ping pong ball:

A diagram showing the forces acting on the ping pong

Borrow an Instrument

Did you know the Royal Meteorological Society lends instruments to schools free of charge?

Pine Cone Weather Station

Make a pine cone weather station

A simple way to record the weather

Equipment

a pinecone◊ A pine cone


Method

1. Place the pine cone on a window sill.

2. Have a look at the pine cone every day and
record whether it is open or closed. Is it raining?

Pine cones are full of very light seeds. They open on fine, dry days so that the wind can carry the seeds far away from the parent tree. On days when the humidity is higher, the seeds are less likely to be carried away, so the pine cones remain closed.

Borrow an Instrument

Did you know the Royal Meteorological Society lends instruments to schools free of charge?

DIY Windmill

Make a windmill

Wind is used to power things, you might see large windmills in the countryside or out at sea.

What you will need:

  • Windmill printout
  • Colouring pens
  • Scissors
  • Pencil or knitting needle
  • Blu-Tack (or similar)
  • A paper fastener
  • A small bead that can go through the paper fastener
  • A cardboard tube (from kitchen towels would be ideal)
colouring pens
a cardboard tube

What to do:

(you might need some adult help)

  1. Print the windmill template and cut it out. 
  2. Decorate with colourful patterns.
  3. Put the lump of Blu-Tack under a little circle where you need to make a hole.
  4. Use a pencil or knitting needle to make a hole. You need to make five holes.
  5. Fold towards the centre and push a paper fastener through all five holes.
  6. Thread a small bead on the back of the paper fastener.
  7. Make a hole near the top of your cardboard tube.
  8. Push the paper fastener in the hole and fold the ends back to stop it from coming out again.

You can decorate the cardboard tube to make it more colourful.

Web page reproduced with the kind permission of the Met Office.

Borrow an Instrument

Did you know the Royal Meteorological Society lends instruments to schools free of charge?

DIY Wind Vane

Make your own wind vane

Wind vane

wind vane

The instrument used for measuring wind direction is called a wind vane.


What you will need:

  • A ruler
  • A pen top
  • A plastic fizzy drink bottle
  • Card
  • A knitting needle
  • Matchsticks
  • A cork
  • Sand
  • Blu-Tack (or similar)
a cork
a DIY weather vane

What to do:

  1. Draw an arrow 25 cm long on the card and cut it out.
  2. Make another arrow by drawing around the first arrow and cutting it out.
  3. Place the pen top between the arrows, in the centre, and glue together. You may need to weight the pointy end of the arrow with blu tack or paper clips.
  4. Push four matchsticks into the long edge of the cork at right angles to each other.
  5. Cut out four small squares of card and label with the four main points of the compass; N, E, S, W. Attach these to the end of each matchstick with Blu-tack.
  6. Fill the bottle with sand.
  7. Push the knitting needle into the cork and push the cork in the top of the bottle. Now balance the wind vane on top of the needle.
  8. Choose an open area, perhaps near your rain gauge, to place your wind vane. Use a compass to point the N label on the bottle towards North.

The arrow always shows the direction the wind is blowing from.

Web page reproduced with the kind permission of the Met Office

Borrow an Instrument

Did you know the Royal Meteorological Society lends instruments to schools free of charge?