UK Energy Usage

The table gives information about how the UK used its energy in 2017.

CREDS calculations based on BEIS (2018)

Sector

Percentage of UK energy used by sector (%)

Industry

17

Transport

40

Households

28

Other

15

a) Draw an accurate pie chart to show this information. 

[3 marks]

In 2017, the UK used the equivalent of 141 million tonnes of oil for energy.

One year the government develops a new initiative to get more people to use electric buses. 

The energy used by transport decreased by 15%.

The UK will use the same total amount of energy.

b) Express the amount of energy the UK will use for transport as a percentage of 141 million tonnes of oil equivalent. 

[3 marks]

A New Power Station

A new kind of gas-fired power station releases on average 1.73×10⁴ kg of pure carbon dioxide (CO2) every day. It also uses the heat of exhaust gases to provide community heating so the carbon dioxide leaving the power station is at same temperature as the environment. The density of CO2 as it leaves the power station is 1.98 kg/m³.


a) What volume of pure CO2 will be emitted from the power station each day? 

[2 marks]

The CO2 now enters the atmosphere and is ‘diluted’ by other air molecules and therefore occupies a larger volume. In the atmosphere, for every million (1000000) air molecules, there are 400 CO₂ molecules. 

b) Work out the volume that the diluted CO2 will now take up in the atmosphere. Give your answer to 3sf.

[2 marks]

A new technology is added to the power station to capture this carbon dioxide and store it as a liquid.

c) The density of liquid carbon dioxide is 1100kg/m³. 

Work out the volume that the amount carbon dioxide produced every day will occupy if stored as a liquid. 

[2 marks]

A depleted oil field contains a reservoir of area 1150 m2 which is 150m deep. This reservoir could be used to store the liquid carbon dioxide.

d) Evaluate how many years’ worth of carbon dioxide emitted from the power station could be stored in this oil field. Give your answer to two significant figures. 

[3 marks]

Sankey Diagrams for Physics

Energy and Climate Change

Energy is needed in the form of electricity to power our lives, and to fuel our travel and industry. Since 1990, total world energy consumption has increased by over 55% and is projected to increase by another third by 2040.

Globally, oil accounts for over 30% of total energy use, followed by coal, gas and nuclear at 4%. This mix is different when you look only at electricity production, and different again on a country by country level.

A sustainable energy transition is a shift from an energy intensive society based on fossil fuels to energy efficiency with low carbon and renewable energy sources.

The Paris Agreement is a legally binding global climate change agreement, adopted by 189 nations at the Paris climate conference (COP21) in December 2015. It sets out a global framework to avoid dangerous climate change by limiting global warming to well below 2°C and pursuing efforts to limit it to 1.5°C.

Significant changes in energy production, transmission and use are necessary to achieve these commitments.

This should lead to co-benefits including improved air quality and reductions in energy poverty.

Since 2019, the costs of developing new power plants based on hydroelectric power, onshore wind, solar photovoltaic (PV), biomass and geothermal energy have become comparable to the costs of new oil and gas fuel plants.   

Physicists play an essential role in all aspects of climate change research and policy decisions as well as in development of technologies and new ideas for preventing and mitigating the effects of future, damaging climate change.

Energy and Core Physics


Energy is a fundamental concept in physics and a key topic in any physics curriculum. The Earth’s climate system is driven by energy stores and transfers. Development of clean, sustainable energy generation and distribution methods relies on understanding the core physics involved. The climate system and sustainable energy production therefore provide engaging and relevant sources of examples for enhancing the teaching and learning of energy as a topic in Physics. They give teachers an obvious opportunity to engage their students in an appreciation of the importance of the physics already in the school curriculum in solving many of the problems surrounding accelerated climate change, as illustrated in the following, brief summary of potential links.

Energy is transferred by radiation from the Sun, increasing the thermal store in the Earth’s atmosphere and ocean systems. Energy transfers within these systems take place through the physical processes of conduction, convection, radiation and changes of state. Seasonal and longer term, natural variations in heating and cooling of the Earth are a result of the alignment of the Earth in space and its orbital motion around the Sun. Land and ice surfaces are heated differentially according to the absorptive or reflective nature of the surface type and rocks are heated internally due to energy released during radioactive decay and large scale, convective motion of the Earth’s interior.

Successful and sustainable, low carbon generation of electricity to meet current and future demands relies on understanding and exploiting many of these natural, physical processes. Atmospheric convection causes winds to drive wind turbines and also generates the ocean waves exploited in wave power devices. The relative motion of the Earth, Moon and Sun causes the ocean tides exploited in tidal barrages and undersea-current driven turbines. Seasonal changes, weather patterns and latitude can all affect the output of solar energy devices as can reflection and absorption of radiation by the materials they are made from. Geothermal energy relies on energy transfers due to radioactive heating of rocks, local volcanism or simply the heat capacity of the soil acting as a thermal store of energy.

Many large-scale electricity generation methods depend on the basic principle of a turbine turning a generator which relies on understanding the principles of electromagnetic induction and factors affecting potential power output and efficiency. Electricity distribution on a large scale, via the National Grid, involves minimising energy dissipation into the surroundings by transmitting electricity at very high potential difference and low current thus reducing thermal transfers of energy within the cables. Domestic uses of electricity involve devices with varying levels of energy efficiency and informed choice of the most efficient appliances and how long they are used for can lead to reductions in an individual’s energy demands, carbon footprint and household bills.

Energy Efficiency

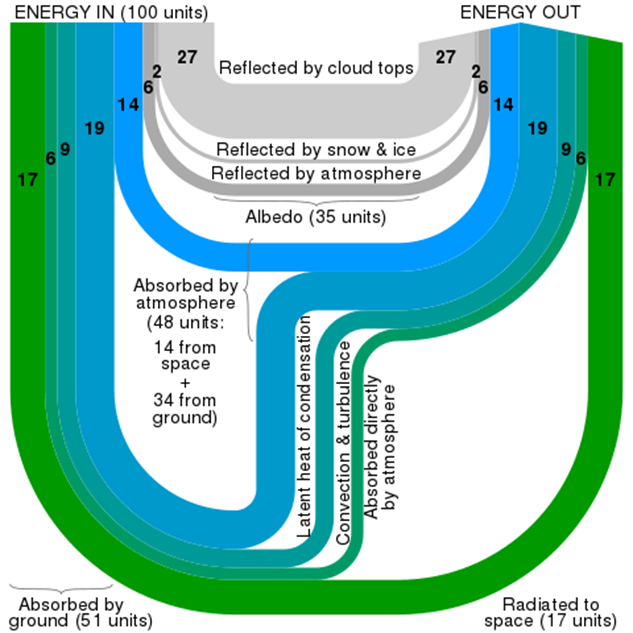
Improving energy efficiency saves individuals money, reduces waste, conserves resources and cuts emissions of greenhouse gases and other pollutants. Discussing personal, financial savings and more immediately obvious environmental impacts can lead to engagement with climate change by an indirect route with valid applications in the physics curriculum. This is also a good opportunity to reinforce accurate vocabulary using the terms energy stores, transfers and pathways as well as the concept of energy dissipation and avoiding terms such as energy saving (https://spark.iop.org/collections/energy-new-curriculum). Examples can be given of more relevant applications of the Sankey Diagram as a tool for accounting for energy transfers in the atmosphere:

(see also http://www.sankey-diagrams.com/greenhouse-effect-explanation-with-sankey-diagram/ and https://www.metlink.org/wp-content/uploads/2020/11/PhysRev-25_energybudgets.pdf)

Sankey energy diagram

By Cmglee – Own work, CC BY-SA 3.0

This could be used to illustrate a more complex example of a Sankey diagram and lead to a discussion of the possible effects of changes to some of the pathways, reinforcing the concept of energy conservation as both sides must remain balanced.

Wind Turbine Example 

In a wind turbine, 20% of the energy from the wind is converted to electricity. Lost wind leads to a loss of 30 % of the energy, friction between the wind and the blades of the turbine and the wind leads to a loss of 25% of the energy, and the rest of the energy is lost due to friction in the electric generator.

  1. How much energy is lost due to friction in the generator?

2.   Draw a Sankey diagram for the wind turbine, considering that the output in electrical energy is 20 kJ.


Carbon Footprint – Worksheet

What is a Carbon Footprint?

Carbon is one of the building blocks of life. Humans, animals and plants are made up of organic compounds. We burn wood and fossil fuels to produce energy and power transport, inadvertently releasing the greenhouse gas, CO2 into the atmosphere.

We will look at a series of calculations that represent the carbon cycle and how CO2 production is related to energy. You will start to see the energy implications of various fuels and technologies and their CO2 footprint.

The associated information sheet will provide the data you need to answer the questions below. 

  1. How much CO2 is emitted by the following activities? (calculate them in kg of CO2)

  • Driving 100 miles?

(Using 13 litres of petrol or 10 litres diesel)


  • Using your LED TV for 5 hours a day during a week?

(A 50” LED TV uses 100 watts, to convert to kWh, multiply kW by number of hours)


  • Boiling water in the electric kettle for a family for a week?

(A kettle uses 1200 W and it takes 3 minutes to boil water and this is done 10 times a day – or does your household drink more hot drinks?)


  • Heating the water with natural gas for a week of daily 5 minute showers?

(Heating 30 litre of water to 40°C uses 1.1 kWh in the form of gas, where emissions  from natural gas are 0.2 kg CO2/ kWh burned)


  • Charging mobile phones for the family for a week. With an average of two full charges a day.

(Typical phone charges at 0.015 kWh and takes 2 hours to charge fully)


  • Play station for 20 hours a week

(A Playstation 4 Pro uses 139 W)


2.  How to quantify CO2 emissions in terms of volume and mass?

  • How many cubic metres of CO2 would 5000 kg CO2 occupy?

  • A factory states that it releases 10 tons C per year (as greenhouse gas emissions). How many m3 of CO2e is this?

  • If UK car emissions released 3 GtC in a year and all the CO2 remained in the atmosphere, by how much would the CO2 concentration increase?

  • Go to see last year´s UK Carbon emissions published by the government (Provisional GHG emissions). In 2019 it was 351.5 Mt CO2 Considering the UK population is 63 million and the world population is 8.3 billion, are our carbon emissions representative of global average emissions? ((World emissions in 2017 were 36 Bt) 

  • Why has CO2 not decreased in 2020 if CO2 emissions have dropped? Is there still last years and the decade before´s emissions in the air or are we still emitting more despite the drop in transport and industry in 2020?

3.  Steps towards reaching carbon neutrality

  • Do you think the UK is on its way to becoming a low carbon economy? Why do you think some countries like Estonia are way behind the UK and countries like Sweden are way ahead?
  • The UK has a goal of reaching Carbon neutrality by 2050- do you think we are on our way to reaching that?
  • What percentage of our man-made CO2 emissions are absorbed by the oceans?
  • If a fully grown tree absorbs 22 kg of CO2 per year and an acre of forests 2.5 tons of Carbon, if we wanted to neutralize our country-wide annual emissions of 351.5Mt* CO2, how many more trees or acres of forest would we need?**

*The latest government statistics on UK annual CO2 emissions (for 2019) was 351.5 Mt CO2 equivalent

**UK forests absorbed 21 million tonnes CO2 in total in 2020, so they are working away continuously at helping to neutralise our emissions!


Carbon Footprint – Teacher’s Notes

Carbon, fossils fuels and CO2

Carbon is one of the building blocks of life. Humans, animals and plants are made up of organic compounds. We burn wood and fossil fuels to produce energy and power transport, inadvertently releasing the greenhouse gas, CO2 into the atmosphere. Students will become more aware of the facts and figures that link the carbon cycle with CO2 emissions and the jargon that is used in the news and in global climate politics.

Chemistry curriculum links: AQA GCSE

3.2.1 Use of amount of substance in relation to masses of pure substances (Moles)

7.1 Carbon compounds as fuels and feedstock

9.2 Carbon dioxide and methane as greenhouse gases

9.2.4 The carbon footprint and its reduction

Chemistry in the activity

Calculating the energy from combustion of different fuels is related to the number of Carbon atoms these hydrocarbons contain. The amount of CO2 produced upon combustion is our way of measuring the Carbon footprint of energy sources. Electricity is generated from various forms of energy in each country´s electricity mix and the more renewables and the fewer inefficient coal power plants there are, the less CO2 is released per kWh electricity used. The UK is trying to go below 100 g of CO2 released per kWh by 2030 and is likely to achieve this before that date.

In the associated worksheet the students will carry out calculations based on a range of information they will find in the corresponding information sheet. They will become familiar with conversions between tons of Carbon and tons of CO2, the volume of CO2 and other factors they may hear in the news or that relate to their personal, a country´s or organisation´s carbon emissions.

They will go to websites that provide current global CO2 levels and a breakdown of the UK´s electricity supply, with the corresponding kg of CO2 this will emit per unit electricity used. Questions 1&2 use numeracy skills to evaluate and compare different forms of energy and different technologies.

Question 3 is best used as a classroom discussion and covers carbon neutrality, achieving the UK´s Carbon neutrality goals and calculate how many trees they would have to plant to neutralise this year´s CO2 emissions.

1.  Which fuels or activities produce more CO2?

QUESTIONS


Which of these activities produces more CO2 emissions? (calculate them in kg of CO2)


  • Driving 100 miles?

(Using 13 litres of petrol or 10 litres of diesel)

Petrol = 2.3 x 13, Diesel = 2.7 x 10 = 29.9 kg CO2 for petrol and 27 kg for diesel


  • Using your LED TV for 5 hours a day during a week?

(A 50” LED TV uses 100 watts, to convert to kWh, multiply kW by number of hours)

5 x 7 hours at 100 watts = 3.5 kWh = 3.5 kg CO2


  • Boiling water in the electric kettle for a family for a week?

(A kettle uses 1200 W and it takes 3 minutes to boil water and this is done 10 times a day – or does your family drink more tea?)

1200 x 10 x 3 x 7 = 210 minutes (3.5 hours) or 4.2 kWh  x 0.283 = 1.19 kg CO2

  • Heating the water with natural gas for a week of daily 5 minute showers?

(Heating 30 litre of water to 40°C uses 1.1 kWh in the form of gas, where emissions from natural gas are 0.2 kg CO2/ kWh burned)

Heating the water for a week uses 7.7 kWh so 0.2 x 7.7 is 1.54 kg CO2

  • Mobile phone usage for the family in a week. Assume the family does an average of two full charges a day.

(Typical phone charges at 0.015 kWh and takes 2 hours to charge fully)

4 x 7 x 0.005 = 0.014 kWh x 0.283 = 0.396 kg CO2

  • Play station for 20 hours a week

(A Playstation 4 Pro uses 139 W)

139 x 20 = 2.4 kWh = 7.87 kg CO2

2.  How to quantify CO2 emissions in terms of volume and mass?

QUESTIONS

  • How many cubic metres of CO2 would 5000 kg CO2 occupy? 2500 m3
  • A factory states that it releases 10 tons C per year (for its greenhouse gas emissions). How many m3 of CO2e is this? 10,000 kg x 44/12 = 36,667 kg CO2, so ½ x this is 18,333 m3
  • If UK car emissions released 3 GtC in a year and all the CO2 remained in the atmosphere, by how much would the CO2 concentration increase?

0.47 x 3 = 1.41 ppmv

  • Go to see last year´s UK Carbon emissions published by the government (Provisional GHG emissions). In 2019 it was 351.5 Mt CO2 Considering the UK population is 63 million and world population is 8.3 billion, are our carbon emissions representative of global average emissions? ((World emissions in 2017 were 36 Bt)

63m/8.3b =0.81 % of population and CO2 emissions are 351.5Mt/36000Mt = 0.98 %, so the population of the UK creates more CO2 than their population dictates, we produce 0.98/0.81 =1.21 times more CO2 than the average world population

(figures for 2020) 500 ppm; increase of 100 ppm between 1950 and 2020 (in 70 years), that is a 0.7 ppm average increase; it has increased 4 ppm since 2018 (in 2 years), 2 ppm increase per year. The rate of increase of CO2 concentration has increased since the 1950s.

  • Why has CO2 concentration not decreased in 2020 if CO2 emissions have dropped?

The lifetime of CO2 means that it stays around in the atmosphere for many years and you will not see a decrease in the CO2 from the year that you stop releasing it, it will gradually level off, that is why we need to reach our CO2 emission peak as early as possible, to see the results a few years later.

3. Steps towards reaching carbon neutrality

QUESTIONS to discuss as a class

  • Do you think the UK is on its way to becoming a low carbon economy? Why do you think some countries like Estonia are way behind the UK and countries like Sweden are way ahead? (http://www.globalcarbonatlas.org/en/CO2-emissions is a useful information source)

Estonia still burns a lot of coal, hence its high CO2 emissions. Sweden has 80 % of its electricity from nuclear and renewables

  • The UK has a goal of reaching Carbon neutrality by 2050- do you think we are on our way to reaching that?
  • What percentage of our anthropogenic (human) CO2 emissions are absorbed by the oceans?

31 %

  • If a fully grown tree absorbs 22 kg of CO2 per year and an acre of forest, 2.5 tons of Carbon, if we wanted to neutralize our country-wide annual emissions of 351.5Mt* CO2, how many more trees or acres of forest would we need?**

351500/2.5 = 140600 acres. There are 60 million acres in the UK, so actually, only adding 0.234 % of the land as forests would do this!

*The latest government statistics on UK annual CO2 emissions (for 2019) was 351.5 Mt CO2 equivalent

**UK forests absorbed 21 million tonnes CO2 in total in 2020, so they are working away continuously at helping to neutralise our emissions!


Carbon Footprint – Information Sheet

Carbon is one of the building blocks of life. Humans, animals and plants are made up of organic compounds. We burn wood and fossil fuels to produce energy and power transport, inadvertently releasing the greenhouse gas, CO2 into the atmosphere.

1.  Which fuels or activities produce more energy or CO2?


What are fossil fuels made up of?   Hydrocarbons with varying amounts of Carbon:

  • Coal contains large complex hydrocarbon molecules (with C:H:O ratios of ~85C:5H:10O)
  • Diesel is made up of alkanes containing 12 or more carbon atoms. (e.g. C13H28)
  • Petrol contains alkanes and cyclo-alkanes with between 5 and 12 Carbon atoms (with an average composition of C8H12 (octane))
  • The mass of one mole of pure Carbon is 12 g and the mass of one mole of CO2 is 12 + (2×16) = 44 g (to convert from CO2e to C multiply by 12/44)

What are the combustion reactions and how much energy and CO2 do they produce?


  • 1 kg of petrol burned yields about 47 MJ of energy (1litre, 34.2MJ)
  • 1 kg of diesel burned yields about 46 MJ of energy (1litre, 38.6MJ) (diesel is denser than petrol and has more energy per litre)
  • 1 kg of coal burned yields about 30 MJ of energy
  • 1 kg of wood burned yields about 19 MJ of energy
  • 1 kg of coal (containing 0.78 kg Carbon) will produce 2.4 kg of CO2
  • 1 litre of petrol (containing 0.63 kg of carbon) will produce 2.3 kg of CO2
  • 1 litre of diesel (containing 0.72 kg of carbon) will produce 2.7 kg of CO2

The most up-to-date information on the make-up of the UK electricity grid (which is a mix of sources) can be found at RENSmart and the value in February 2021 was that 1 kWh produces 0.23314 kg CO2. (kWh are calculated by multiplying kW by the number of hours). If you live in another country you could compare its CO2 emissions per kWh electricity factor. Here is a good comparison site for many countries but with older data.


2. How to quantify CO2 emissions in terms of volume and mass?

Volume and mass of CO2

You will often hear about kg of CO2 emitted, relating to the energy usage of different forms of transport, of a household, of a company, of a particular industry (like the cement industry) or of a country or a person.

From what we know about the combustion processes, their efficiency and our energy needs, we can use emission factors to calculate carbon footprints. We also know that a mole of any gas occupies 22.4 dm3 at ambient temperature. So we can express the emissions as a volume of CO2. If we know how much of a gas is emitted and what the original concentration of that gas was in the atmosphere, we can see whether the emissions will change the concentration.

  • 1 kg pure CO2 occupies a volume of half a cubic metre (500 dm3 (or litres))
  • CO2 emissions are often stated in GtC (109 tonnes (or Gigatonnes) of Carbon)
  • Concentrations of CO2 in the atmosphere are expressed in parts per million by volume (ppmv). 1 ppmv takes up 0.0001% of the volume of the atmosphere. Check out the Mauna Loa CO2 measurement station in Hawai for today´s level.
  • A release of CO2containing 1 GtC would increase the atmospheric CO2 concentration by 0.47 ppmv if all the CO2 remained in the atmosphere, BUT carbon sinks nearly balance out the sources
  • There was a CO2 increase of 2.5 ± 0.1 ppmv between 2017 and 2018
  • The lifetime of CO2 is 5 to 100 years

Don’t forget:

  • The mass of one mole of pure Carbon is 12 g and the mass of one mole of CO2 is 12 + (2×16) = 44 g (to convert from CO2eq to C multiply by 12/44)

Effects of the Covid-19 on the economy and thus CO2 emissions

  • Between 2019 and 2020 global CO2 emissions decreased due to the COVID-19 Pandemic (in the region of 4 Gt CO2 and the CO2 emissions fell by 7 % in 2020, the largest ever decrease since the Second World War!) 
  • A Carbon brief article suggests that in 2020 we reduced the annual increase in CO2 concentrations by 0.32ppmv, putting it at 2.48ppm.
  • Note the difference between emissions of CO2 and actual concentrations. The CO2 already in the atmosphere from previous year´s emissions (it lasts up to one hundred years).

3. Steps towards carbon neutrality

UK Fuel Source Mix


This Figure shows the latest (calculated every 3 months) fuel source mix for the UK electricity supply. Go to: OFGEM. Note the elimination of coal and the increase in wind and solar energy.

The UK electricity supply now has well over 20 % from renewables. The UK is trying to get to below 100 g CO2/ kWh by 2030 and we might achieve 5 % renewables by 2025. In late 2019 the electricity from British windfarms, solar panels and renewable biomass plants surpassed fossil fuels for the first time since the UK’s first power plant fired up in 1882.

We saw in section 1 that at RENSmart you can get the latest value for how many kg CO2 are produced per kWh of electricity. Let´s compare other countries from the table at the bottom of this website. Sweden currently has an emission of 0.013 kg CO2/ kWh (21 times lower CO2 emissions per kWh!). In Sweden 80 % of electricity comes from nuclear and renewables (with 66 % from renewables). By the way, renewables do have an embedded energy (of up to 50 g CO2/ kWh).

And look what these natural Carbon Sinks can do:

  • Between 1994 and 2007, the oceans absorbed 34 Gt CO2 (31 % of what humans put into the atmosphere during that time)
  • One acre of new forest can sequester about 2.5 tons of carbon annually. Young trees absorb CO2 at a rate of 6 kg per tree each year and after 10 years they absorb 22 kg of CO2 per year. At that rate, they release enough oxygen back into the atmosphere to support two human beings.
MetLink - Royal Meteorological Society
We use cookies on this site to enhance your user experienceBy clicking any link on this page you are giving your consent for us to set cookies. More info

By clicking any link on this page you are giving your consent for us to set cookies. More info