We have created a new worksheet which allows students to collect information and create a case study of a named UK storm. As part of the worksheet, students collect and annotate weather chart and other information about the storm including weather warnings.
Storm Eunice is given as a worked example.

We have made two new explainer films which can be seen on YouTube:
All About the InterTropical Convergence Zone (ITCZ)


We are delighted that our “Weather and Climate: a Teacher’s Guide” resource has been awarded a Highly Commended in the Book Category for this year’s Scottish Association of Geography Teachers (SAGT) Publishers’ Awards.
In this article we explore air masses – the idea that, by looking at where our wind is blowing from, and what has happened to the air in the wind on its way to us, we can begin to understand why we’re getting some particular weather.
We live on an island, and the weather can come at us from any direction, although in practice, it comes from some directions more than others – this wind rose shows the direction the wind was recorded coming from at Heathrow airport, near London. The longer the bar, the more often the wind came from that direction, so you can see that our wind comes from between southwest and west most often.

Lets take a step back and remember that warm air rises – whether that’s the air being heated in a hot air balloon or the air above a radiator (watch a simple demonstration).
What happens to the rising air? As it rises it cools. Cloud and rain are caused by warm air rising, warm air rising is called convection (watch a simple demonstration).
You can often see convection going on in the atmosphere – you get puffy cumulus clouds, with flattish bases and puffy tops where the cloud is bubbling up.

More generally, Clouds form when there is more condensation going on than evaporation in the atmosphere.
The colder it is, the less evaporation happens – so cloud forms when the air cools.
This isn’t just when warm air rises.

Now we can think about air masses, they are classified according to where they have come from, and what they have passed over:
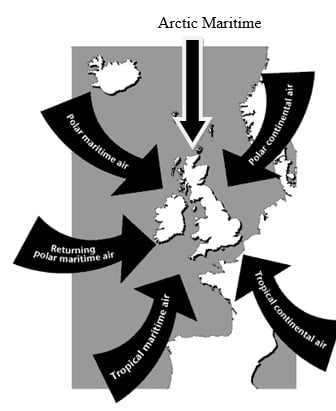
One air mass generally covers the whole country.
However, it can bring different weather conditions to different places. For example, Tropical continental air can carry Saharan dust, but it mostly falls on the south of the UK – there isn’t much left in the air by the time it reaches Scotland.
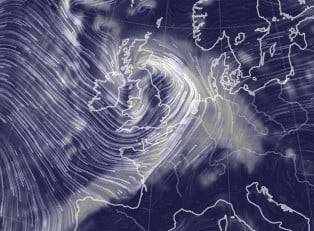
Lets consider Polar maritime (Pm) air first (click on the map to start the animation):
Polar maritime air comes towards us from further North in the Atlantic. It starts cold, but is slowly warmed by the ocean below as it travels over progressively warmer water. It also picks up moisture from the ocean.
As it is warmed, it becomes more unstable and inclined to rise, leading to convection and puffy Cumulus clouds, mainly over the ocean. As the air hits land (the western coast of Ireland, Wales, Scotland and England) the air, which was already inclined to rise, is forced up a bit more – forming more cloud, and giving rise to rainfall.
Polar maritime air, our dominant air mass, brings cloud and rain to the west of the UK and relatively dry air to the east.
This satellite image is typical of Pm air – you can see the puffy cumulus clouds over the ocean, and the belt of cloud over the western side of the country.

Returning Polar maritime air (rPm) is air which is Polar in origin but which swings round to hit the UK from the west or even slightly south of west – but if you were to follow its path back, you would see that it was Polar.
Arctic maritime (Am) air is extreme Polar maritime air, coming down to the UK straight from the north, over the Arctic ocean. It tends to bring wintry weather to Scotland and isolated snowy showers further south, triggered by air rising over the local orography.
An Am case study.
Polar continental (Pc) air will also be cold to start with and get progressively warmer as it moves south, so you would also expect convection. However, the air will be very dry as it passes over continental Europe, so little cloud will form. The UK is a set of islands though and to reach us, the air must pass over the North Sea, picking up water vapour as it does so. The cloud and precipitation (typically snow in winter) it brings therefore primarily affect the east coast. The longer the path it takes over the North Sea, the more precipitation there will be.
This satellite image is typical for Pc air – you can see the cloud free areas immediately to the west of the land masses, with cloud forming further east (ignore the front to the west of the UK and Ireland).
Another Pc case study.

Of course, the characteristics of the air masses can be very different in the summer and the winter. Siberia, for example, is extremely cold in winter but relatively warm in summer – so a polar continental air mass can bring us bitterly cold weather and heavy snowfall (for eastern counties) in the winter, but much warmer weather in the summer.
The processes at work in Tropical maritime (Tm) air are a bit different. This is warm air, which is being cooled from below as it moves north. You therefore wouldn’t expect any convection with air rising, cooling and forming cloud. However, the air is being cooled just by moving north and so eventually may reach the temperature at which cloud forms – flat, featureless sheets of stratus cloud because, on the whole, the air is staying at the same level.
As it is maritime air, there is plenty of water vapour available to form cloud droplets. The processes which give us big, fat raindrops are mainly associated with the vertical air motion and circulations in cumulus clouds. So Tm air at best gives a persistent drizzle.
The satellite image below shows the extensive sheet of stratus cloud over the Atlantic associated with Tm air.

We rarely experience Tropical continental (Tc) air – air that flows up from the Sahara over continental Europe. This is the warmest and driest air we can get – any moisture picked up over the Mediterranean will be rained out before it reaches us.
Tc air gives clear skies, as you can see in the satellite image below – again ignore the front to the west of the UK. In the summer, this can mean that some areas get particularly warm – maybe because of their colour (dark) or aspect (facing the Sun) – giving rise to late afternoon localised thunderstorms

A front is where two air masses meet. In the UK, the weather fronts associated with depressions usually separate polar and tropical maritime air.
If there is a front, then different parts of the UK can be experiencing different air masses. The weather on the fronts themselves is more extreme.
Look out of the window now – what cloud types can you see? Does that tell you anything about where the air is coming from? You can have a look at earth.nullschool to see if you are right.
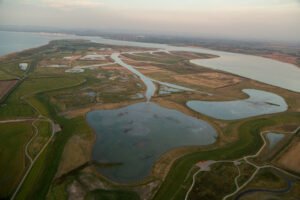
We have just added a new resource to our Weather and Climate: a Teachers’ Guide collection in the Changing UK Climate section.
The resource provides students with source material, graphs and maps to allow them to make a poster explaining how salt marshes can protect coastal areas from the impact of rising sea levels.
Steart Marshes – designed for adaptation to climate change.
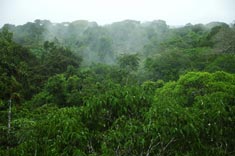

We are delighted to have worked together with the RGS to produce a resource for A Level geography students, using key data skills to investigate the impact of Amazon deforestation on rainfall.
The worksheet is designed to highlight the importance of meteorology understanding in physical geography. There are activities on the statistical tests of Mann Whitney U-Test and Spearman’s Rank Correlation Coefficient.
 In this teachers’ guide and the accompanying online teaching resources, we aim to give UK geography teachers all that they need to deliver relevant, engaging and thorough weather and climate lessons to 11–14+ year old students. They are not linked to any specific curriculum but should be easily adaptable to all.
The book is accompanied by high quality online background information/professional development resources for teachers.
The Royal Meteorological Society believes that:
To this end, we have embedded a climate change thread throughout the online resources, showing its relevance to both weather and climate. An understanding of weather and climate is fundamental to an understanding of climate change.
There is a progression of knowledge through the topics, supported by review and assessment activities. The resources also progressively develop key geographical skills such as data, mapwork, GIS, fieldwork and critical thinking.
In this guide, we include common misconceptions which should be challenged in the classroom.
There are 20 topics or chapters. Across these, there are three threads or paths which can be taken through the online resources, depending on the teaching time available:
Basic weather: Weather in our lives, weather measurements, weather and climate, global atmospheric circulation, global climate zones, air masses, pressure and wind and water in the atmosphere
Climate: Weather and climate, global atmospheric circulation, global climate zones, past climate change, polar climate, hot deserts, changing global climate, UK climate, changing UK climate, the climate crisis
Extending weather: Anticyclones, depressions, microclimates, urban weather, tropical cyclones.
Many of the online teaching resources are available with standard or easier versions, as well as extension or alternative activities.
Find the scheme of work, teaching resources, background information for teachers, as well as the Teachers’ Guide (copies of which may be printed on request), here.
All the online resources will be updated and revised regularly.
Last week, Sylvia Knight from the Royal Meteorological Society gave a talk for Geography education online on the Weather of 2020.
This year it felt like we had summer weather in Spring and Autumn weather in Summer. In this session, we examine the global processes that determine the weather in the UK, as well as the impact of COVID-19 on weather and climate around the world.
The talk is aimed at A Level students, but would also be useful CPD for geography teachers or for younger students who have already covered a weather topic.
In a paper that came out in the journal Nature Communications, Self-amplified Amazon forest loss due to vegetation-atmosphere feedbacks, scientists revealed that deforestation can intensify droughts, compounding climate change linked changes in rainfall patterns.
Using data collected by scientists in the School of Earth and the Environment at the University of Leeds, we have created a data skills exercise for A Level geography which allows students to explore leaf area, evapotranspiration and temperature data using various statistical techniques to explore the relationship between deforestation and weather.
With clear links to both the carbon and water cycles, you can find the resources here.

Several recent research papers have investigated the impact of rainforest deforestation on local rainfall and temperature.
Find some teaching resources linked to the animation above here.
© 2024 Royal Meteorological Society
RMetS is a registered charity No. 208222
By clicking any link on this page you are giving your consent for us to set cookies. More info
Strictly Necessary Cookie should be enabled at all times so that we can save your preferences for cookie settings.
If you disable this cookie, we will not be able to save your preferences. This means that every time you visit this website you will need to enable or disable cookies again.