Secondary Maths Lessons

Developed in Partnership with Dr Frost Learning, these resources are suitable to 11-16 maths teaching (KS3 and KS4 in England), unless otherwise indicated.

Each lesson features a lesson PowerPoint as well as printable exercise and investigation sheets.

Substitution with the Four Operations and Integers

Substitution is the process of replacing the variables in an algebraic expression, usually with a numerical value. We can then work out the total value of the expression.

Climate change context

Calculating household carbon dioxide emissions

Prior Learning:

  • Negative numbers and arithmetic
  • Decimals and arithmetic
  • Fractions and arithmetic
  • Powers and roots
  • Basic algebraic notation
  • Using function machines & their inverses

Lesson ppt

Exercise pdf

Integer Substitution with Powers and Roots

Climate change contexts:

Substitution and the Sahara

Rainforest deforestation

Prior Learning

  • Substitution with four operations and integers
  • Using notation for powers and roots
  • Knowing powers and roots with base 2, 3, 4, 5 and 10

Lesson ppt

Exercise pdf

Substitution with Fractions and Decimals

Prior Learning

  • Decimals and arithmetic
  • Fractions and arithmetic
  • Powers and roots
  • Basic algebraic notation
  • Substitution using integers with the four operations
  • Substitution using integers with powers and roots

Lesson ppt

Exercise pdf

Investigation Sheet 1 – Wind Turbine

Investigation Sheet 2 – Wind Turbine

Form Simple Expressions

Climate Change Contexts

Arctic warming

Building insulation

Carbon footprint of social media

Emissions reductions

Prior Learning

  • Use and interpret algebraic notation, including:

–ab in place of a×b,

–3y in place of y+y+y and 3×y,

–a/b in place of a÷b,

–coefficients written as fractions rather than as decimals.

–brackets

  • Simplify expressions with sums, products and powers including index laws
  • Distinguish between expressions, equations, inequalities, terms and factors
  • Algebraic substitution
  • Recognise & create equivalent expressions
  • Order of operations

Lesson ppt

Exercise pdf

Form and Use Simple Formulae

Climate Change Contexts

Tree planting

Vehicle emission reductions

Solar panel output

Prior Knowledge

  • Use and interpret algebraic notation, including:

–ab in place of a×b,

–3y in place of y+y+y and 3×y,

–a/b in place of a÷b,

–coefficients written as fractions rather than as decimals.

–brackets

  • Simplify expressions with sums, products and powers including index laws
  • Distinguish between expressions, equations, inequalities, terms and factors
  • Algebraic substitution
  • Recognise & create equivalent expressions
  • Order of operations
  • Form simple expressions

Lesson ppt

Exercise pdf

Form and Solve Linear Equations from Simple Contexts

Climate Change Context

Emission reductions and net zero

Prior Knowledge

  • Solve simple linear equations.
  • Solve linear equations with brackets.
  • Solve linear equations where the variable appears on both sides of the equation.
  • Solve linear equations involving brackets.
  • Expanding single brackets.
  • Form simple expressions & formulae.
  • Use and interpret algebraic notation, including:

–ab in place of a×b,

–3y in place of y+y+y and 3×y,

–a/b in place of a÷b,

–coefficients written as fractions rather than as decimals.

–Brackets.

Lesson ppt

Exercise pdf

Form and Solve Linear Equations for Problems Involving Perimeter and Area

Climate Change Context

Carbon footprint/ growing food

Tree planting

Prior Knowledge

  • Find the area and perimeter of simple shapes.
  • Solve simple linear equations.
  • Solve linear equations where the variable appears on both sides of the equation.
  • Expanding single brackets.
  • Form simple expressions & formulae
  • Use and interpret algebraic notation, including:

–ab in place of a×b,

–3y in place of y+y+y and 3×y,

–a/b in place of a÷b,

–coefficients written as fractions rather than as decimals.

–Brackets

  • Simplify expressions with sums, products and powers including index laws
  • Distinguish between expressions, equations, inequalities, terms and factors
  • Algebraic substitution
  • Recognise & create equivalent expressions
  • Order of operations

Lesson

Exercise 1

Exercise 2

Mixed Exercise

Changing the Subject – One Step

Climate Change Context

Ocean Warming

Prior Knowledge

    • Solve simple linear equations.
    • Expanding single brackets.
    • Form simple expressions & formulae
    • Use and interpret algebraic notation, including:

    –ab in place of a×b,

    –3y in place of y+y+y and 3×y,

    –a/b in place of a÷b,

    –coefficients written as fractions rather than as decimals.

    –Brackets

    • Simplify expressions with sums, products and powers including index laws
    • Distinguish between expressions, equations, inequalities, terms and factors
    • Algebraic substitution
    • Order of operations

Lesson

Exercise 1

Dr Frost Learning is a UK registered charity with goal of delivering high quality education for all individuals and institutions regardless of income, centred around the philosophy that education is a fundamental right of all and central to addressing social inequality on a global level. The charity was founded by Dr Jamie Frost and he received the Covid Hero Award in the Global Teacher Prize 2020.

Dr Frost Learning
Climate Change Quality Mark Content

Climate Change Concept Association Tool

This tool is best used on a laptop or other larger screen and may not function correctly on a phone.

Carbon Dioxide – Seasonal Cycles

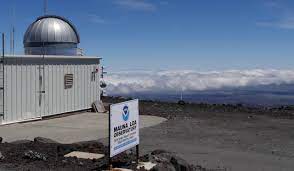
Mauna Loa Observatory NOAA

An exam style question suitable for GCSE science.

Notes for Teachers

The units for the data are in fact ppmv which we have simplified to ‘parts per million’ for this question. 

This is a nice visualisation of what 420ppmv looks like.

The questions explore the fact that there is a seasonal cycle in carbon dioxide in the atmosphere because plants take up carbon dioxide during photosynthesis in the spring and summer, which is then released back into the atmosphere when plants die and leaves rot in the autumn and winter. 

Carbon dioxide is a well mixed gas, meaning that the data recorded at Mauna Loa is representative of the Northern Hemisphere, and that at the South Pole is representative of the Southern Hemisphere. 

The seasons are out of phase with each other – when it is summer in the Southern Hemisphere, it is winter in the Northern Hemisphere. 

As there is far less vegetation in the Southern Hemisphere than in the Northern Hemisphere, the seasonal cycle is much smaller. 

Students may notice that there could also be a human element to the cycle – we burn more fossil fuels in the winter than in the summer (and there are also fewer people in the Southern Hemisphere).

The correct answer for the mean is 416.1 parts per million.

As well as the seasonal cycle, the graph provided shows the increase in atmospheric carbon dioxide since 1958. This increase is because of the emissions of carbon dioxide by human activities including land use change including deforestation, burning fossil fuels and cement production. 

carbon dioxide at mauna loa
Climate Change Quality Mark Content

Climate Change Glossary and Resources

Select a letter to see a definition of the terms in the climate change association tool. Alternatively, to find a teaching resource associated with any of the terms, use the ‘all climate change’ drop-down menu on the right. Not all the terms have associated resources yet, but we are adding new ones all the time.

Scotland’s Curriculum – EVolution of vehicle sales

Resource produced in collaboration with MEI

Brief overview of session ‘logic’

  • Explore the infographic – what can be worked out from this information and what questions does it raise?
  • Look at trends in vehicle registrations
  • Look at proportions of types of newly registered vehicles over time – why has the percentage of petrol cars being registered increased from 2015 to 2020?
  • Do some calculations to show that the number of petrol cars being registered has decreased from 2015 to 2020.
  • Reflect upon the implications for misleading representations of data
  • Consider the implications of the ban on new petrol and diesel cars by 2035 – what affect will this ban have on the proportions of car types being registered?
  •  What questions does the increase in electric vehicles raise?

Mathematical opportunities offered

  • Interpretation of data, statistics, graphs, infographics in context
  • Critiquing graphs
  • Reading scales
  • Calculating percentages
  • Exploring proportions of quantities over time
  • Making conjectures about future proportions given available data
  • Analysing and comparing data in order to develop and present a conclusion.
Climate Change Quality Mark Content

Scotland’s Curriculum- EVolution of vehicle sales

Resource produced in collaboration with MEI

Brief overview of session ‘logic’

  • Explore the infographic – what can be worked out from this information and what questions does it raise?
  • Look at trends in vehicle registrations
  • Look at proportions of types of newly registered vehicles over time – why has the percentage of petrol cars being registered increased from 2015 to 2020?
  • Do some calculations to show that the number of petrol cars being registered has decreased from 2015 to 2020.
  • Reflect upon the implications for misleading representations of data
  • Consider the implications of the ban on new petrol and diesel cars by 2035 – what affect will this ban have on the proportions of car types being registered?
  • What questions does the increase in electric vehicles raise?

Mathematical opportunities offered

  • Interpretation of data, statistics, graphs, infographics in context
  • Critiquing graphs
  • Reading scales
  • Calculating percentages
  • Exploring proportions of quantities over time
  • Making conjectures about future proportions given available data
  • Analysing and comparing data in order to develop and present a conclusion.
Climate Change Quality Mark Content

Scotland’s Curriculum – Trees for Net Zero

Resource produced in collaboration with MEI

This resource comprises several stand-alone activities which may be used separately.

Brief overview of session ‘logic’

  • Why trees are good
  • People are planting trees – estimates around what the numbers look like in terms of land use
  • Some companies encourage you to offset flights by planting trees – how many trees for one flight?
  • How much carbon do trees capture and store?
  • How does the amount of carbon captured and stored by a tree change during its lifecycle?
  • What happens to that carbon when a tree dies?
  • Can you plant a tree to offset a flight?
  • What is Net Zero?

Mathematical opportunities offered

  • Estimation and proportional reasoning
  • Developing a sense of scale of large numbers
  • Interpretation of data, statistics, graphs, infographics in context
  • Critiquing graphs
  • Analysing and comparing data in order to develop and present a conclusion
  • Making assumptions
  • Making predictions
  • Reading scales
Climate Change Quality Mark Content

Scotland’s Curriculum Trees for Net Zero

Resource produced in collaboration with MEI

Note that this session is made up of separate activities which may be used independently.

Brief overview of session ‘logic’

  • Why trees are good
  • People are planting trees – estimates around what the numbers look like in terms of land use
  • Some companies encourage you to offset flights by planting trees – how many trees for one flight?
  • How much carbon do trees sequester?
  • How does the amount of carbon sequestered by a tree change during its lifecycle?
  • What happens to that carbon when a tree dies?
  • Can you plant a tree to offset a flight?
  • What is Net Zero?
  • Can trees be used to achieve Net Zero?

Mathematical opportunities offered

  • Estimation and proportional reasoning
  • Developing a sense of scale of large numbers
  • Converting between m2 and km2
  • Interpretation of data, statistics, graphs, infographics in context
  • Critiquing graphs
  • Analysing and comparing data in order to develop and present a conclusion
  • Making assumptions
  • Making predictions
  • Reading scales
Climate Change Quality Mark Content

Scotland’s Curriculum – Extreme Weather

Resource produced in collaboration with MEI

Brief overview of session ‘logic’

  • Do reports of extreme cold weather provide evidence that global warming is not happening?
  • Show the New York Times graphs of summer temperature distributions for the Northern Hemisphere for different periods.
  • Interrogate/critique these graphs
  • The distributions of temperatures are approximately Normal distributions and the mean and standard deviation both increase as the time period becomes more recent.
  • Use the dynamic bell curve to calculate probabilities of different temperatures in different time periods.
  • Despite the mean temperature increasing, the standard deviation also increasing means that the probability of extreme low temperatures increases.
  • Normal distributions and bell curves can explain a higher frequency of extreme cold weather despite global warming.

Mathematical opportunities offered

  • Interpretation of data, statistics, graphs, infographics in context
  • Critiquing graphs
  • Reading scales
  • Using standard form to write very large or very small numbers
  • Fitting a Normal distribution or bell curve to a graph
  • Exploring the effect of adjusting mean and standard deviation on a bell curve
  • Understanding that probabilities can be represented and calculated using areas
  • Analysing and comparing data in order to develop and present a conclusion.
Climate Change Quality Mark Content

Scotland’s Curriculum Fourth Level Maths – Egypt’s Road Problem

In this resource linked to COP27 in Egypt, maths students apply pythagoras’ theorem to solving Egypt’s road building conundrum. 

Introduction/Motivation

The 2022 United Nations climate change conference (27th session of the Conference of Parties – COP27) will be held in Sharm El-Sheikh in Egypt, starting on the 7th of November.

In the introduction video screened at the end of COP26 in Glasgow, Egypt celebrates its road-building project. This resource explores efficient road designs and the climate impacts of car travel.

Resources:

PowerPoint

4 City square template

Created with support from MEI 

Section 1: Lesson Introduction

Show the Egypt introduction video from COP26 and show them the pictures of new Egyptian roads.

Road-building clip only:

Or the full Egypt introductory clip: from 09:21-12:26 in https://unfccc-cop26.streamworld.de/webcast/closing-plenary-of-the-cop-followed-by-cmp-and-c-2

Ask students what comments or questions they have on the video: What do they wonder?

They could discuss in pairs or groups before giving feedback to the class.
You could steer the discussion towards some of the following points:

  • What are the advantages and disadvantages of building new roads?
  • What do you thing about building new roads compared to the other climate mitigation and adaptation projects mentioned in the video?
  • Roads for sustainable development: connecting cities and industry
  • Will a new road reduce traffic?
  • Building roads versus building railways/airports
  • How will building new roads impact greenhouse gas emissions?
  • Should houses be demolished to make way for new roads? https://www.reuters.com/world/middle-east/egypts-road-building-drive-eases-jams-leaves-some-unhappy-2021-05-14/
  • How should governments decide which new roads to build? How can we reduce travel time for the most people, reduce the length of the new road or reduce the greenhouse gas emissions from people travelling on the road?

The remainder of the lesson uses maths to explore the last point.

Section 2: Scenario motivation for the Steiner problem

This could be introduced as motivation for the Steiner problem, or as a real world application once the problem has been solved (after section 3).

One of the new roads connects Beni Suef and Zaafarana. https://scoopempire.com/where-to-%EF%BB%BFegypt-launches-a-series-of-road-and-construction-projects-to-link-up-cities-far-and-wide/

Together with the important cities of Cairo and Suez, this can be simplified and framed as an example of the famous ‘Steiner Problem’: 

Source: Google maps

Which looks a bit like:


Steiner problem

Section 3: Steiner Problem using a Square


To simplify the problem, start by investigating 4 cities in a square. What is the most efficient way to connect all the cities (using the shortest distance of road)? You need to be able to visit all the cities on the road network, but you can go via other cities.

This problem is also described here: https://nrich.maths.org/14937

Students can use the sheet of squares (or squared paper) to draw as many different designs as they can think of, using curves and straight lines, or just straight lines.

Collect some ideas and ask students to calculate the total road distance required. For the square side length, you could use realistic road-distance numbers (eg 100km), simple numbers (eg 10, 1) or a symbol such as x. Students could first measure the distances using a ruler, then calculate them using Pythagoras’ theorem.

Help students to arrive at the optimal solution by considering the two designs below: Is there an intermediate design that would be even better?

Once students have arrived at the optimal solution, this video gives a good demonstration using soap bubbles: https://www.youtube.com/watch?v=dAyDi1aa40E

Section 4: Context Calculations

At this point you could choose to start using realistic road distances or the fact that the cities are not in a square but are closer to a rectangle (see the first extension point below).

  • What is the total distance of the optimal network? How long would it take to travel between each city whilst travelling at the Egyptian motorway speed limit of 100km/hr? (https://www.autoeurope.ie/driving-information-egypt)
  • Assume that the roads connecting Beni Suef to Cario, Cairo to Suez and Suez to Zaafarana already exist. Which one new road should be built to reduce the travel time from Beni Suef to Zaafarana? What is the reduction in travel time?
  • Cars emit around 120 gCO2/km (https://www.eea.europa.eu/data-and-maps/indicators/average-co2-emissions-from-motor-vehicles/assessment-1)
    By how much does the new road reduce the CO2 emissions of a journey from Beni Suef to Zaafarana?
  • Due to the shorter travel time, the new road might increases the number of journeys between Beni Suef and Zaafarana. How many extra journeys are needed to outweigh the decrease in emissions from the reduced distance?

Extension Ideas

  • Return to the introduction video at the end of the lesson. What do students think about building roads and climate change after completing the activity?
    • The 4 cities in Egypt are not in a perfect square, but are close to being in a rectangle. Does this change the optimal road network? This is discussed at https://thatsmaths.com/2015/01/29/the-steiner-minimal-tree/
  • Students could use google maps to look at the real travel time between the 4 cities using different routes.
  • What happens when we consider more cities?
  • Can students think of other situations where this problem could apply? (gas pipelines, rail networks, broadband cables)
  • Think about the real-world practicalities that the Steiner solution doesn’t address. Is it the best solution if most journeys are between Cairo and Suez? Should existing roads be removed in order to build the most efficient network? Which journey times would be increased by this?
Climate Change Quality Mark Content