A Weather Station for your School

Why you need one; what to buy; where to put it; what to do with the data.

Geoff Jenkins 2014

Why does our school need a weather station?

There are lots of reasons why a weather station will be welcomed as a valuable new resource to the school. Some of those given below are more suited to primary schools, others to secondary ones.

  • The National Curriculum requires weather to be measured. Weather and climate feature several times in the new (2014) English National Curriculum for geography. In science, the Year 1 PoS requires that “pupils should be taught to observe changes across the four seasons, and observe and describe weather associated with the seasons”. Guidance suggests that “Pupils should observe and talk about changes in the weather, and work scientifically by making tables and charts about the weather.”  And in Years 3 and 4 they should “make systematic observations using … thermometers and data loggers”.   
  • Weather also links naturally into many other subjects such as History (weather affecting the outcome of battles, eg D-day), ICT (make your own instruments, weather blog/website, linking to the internet), Maths (analysing and plotting real-world data), English (write stories about unusual weather – maybe even get the local paper interested in printing a routine report), Art (Turner, Constable, etc) and even Sport (performance in different conditions).
  • Having a display of current weather, perhaps in the school’s main foyer, is a great general resource and talking point, especially at times of unusual weather – hot days, cold mornings, torrential rain and so on. In primary schools this can get pupils used to thinking scientifically, using units (ºC, mm of rain, etc.) and decimals.  They will also learn to associate measurements of weather with their personal comfort, for example outside at break time. It can also help with practical decisions, eg has there been too much rain today to allow the playing field to be used?
  • Even a cheap weather station can be linked to a computer, so that readings from the weather station can be shown on the school’s website; this will impress parents and prospective parents. If the school is in a village or small town that is unlikely to have any other weather station, then this information can be useful for others in the community and help build links.
  • You can add many other features to the website weather display, such as satellite photographs, weather maps and even your own webcam looking at the sky. You could add pupils’ own photographs of weather events, such as frost or snow.
  • With the right (free) software, your weather readings can be sent automatically to the Met Office, where they are shown hour-by-hour on a website (called WOW) alongside thousands of others from all over the world – a great resource when teaching about UK and world climate.
  • A weather station can be used as an integral part of a school Weather Club, Environment Club or Science Club.
  • Extreme weather seems to make the TV news headlines very frequently. So what was the weather like at our school yesterday when there was heavy flooding in Somerset or damaging winds in Wales?

What type of weather station should we buy?

The first choice you need to make is between a traditional manual weather station and a wireless automatic station. These are described below together with some discussion of pros and cons in each case.  If you have already decided you want an automatic type then skip the next section.

A traditional manual weather station

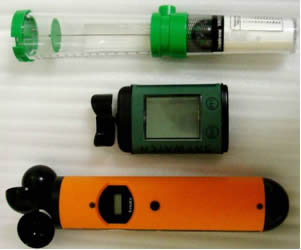
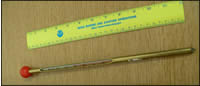
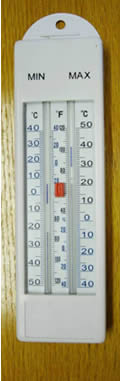
This type uses instruments to measure temperature, including maximum and minimum, and humidity, kept in a white louvred screen (“Stevenson screen”) to keep sunshine from warming up the instruments. Alongside this will be a rain gauge on the ground. The photos below show such an arrangement using glass thermometers, but mechanical (dial-type) ones can be used just as well. Wind measurements can be made with a hand-held anemometer, and pressure using a barometer on the classroom wall. More about setting up this type of weather station, and the instruments that could be used, can be found at:

Simple Weather Instruments.pdf

http://www.weatherforschools.me.uk/html/clouds.html

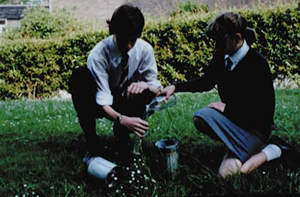
Typically, a couple of pupils will be assigned to go outside in the morning and at lunch time, and jot down readings, and display them in the classroom or foyer. If you want to keep long term records then they can be entered into a log book or (more commonly these days) a spreadsheet. One big advantage of using manual instruments is that they have to be read, which gives lots of practice with scales and units

weather station

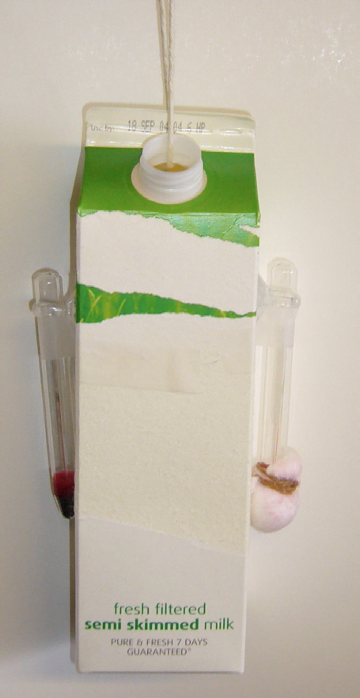
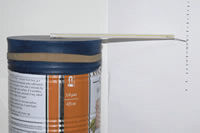
(Left) A traditional manual weather station, with thermometers for measuring humidity (left) and maximum and minimum temperature (right), in a small louvered screen.  (Right) A simple plastic rain gauge with, alongside, a cylinder to measure the rainfall collected.

How much does it all cost? The collection of instruments illustrated above can be bought separately for a total of about £100 (including a self-assembly screen).   Anemometers will be around £60, and a barometer about £20. Although the Royal Meteorological Society does not recommend specific instruments, suppliers such as MetCheck and Brannan carry a wide range and can be found easily online.

What about using instruments we make ourselves? There are plenty of examples shown at: https://www.metlink.org/experiments/  and while these are great for teaching principles, they are generally not accurate or robust enough to be used outside for long periods.

A wireless automatic weather station

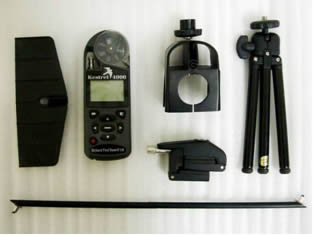
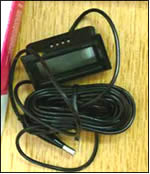
Wireless automatic weather stations (AWS) send all the information you need right into your classroom. They have two separate parts, outdoor and indoor, as illustrated below. A number of sensors are mounted outside on a mast attached to a building, with electronics that transmits data to a receiver console inside the school. Most AWS will measure temperature, humidity, rainfall, wind speed and wind direction. The indoor console will display these measurements (plus pressure), and in many cases also store them for a few weeks; they can then be downloaded into a PC using a USB cable. The weather station can be taken out of the box and set up by someone without a detailed technical knowledge of either weather or computing, using the instruction book provided.

weather station

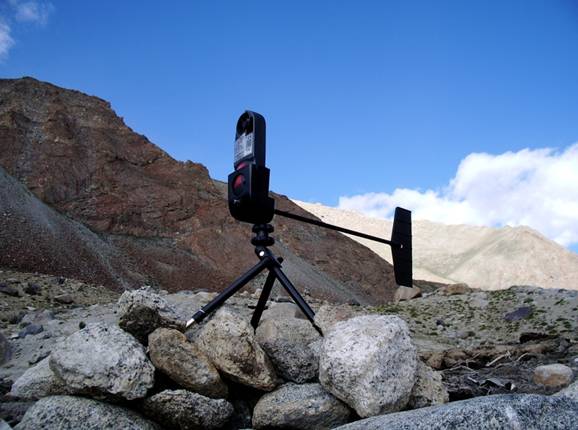
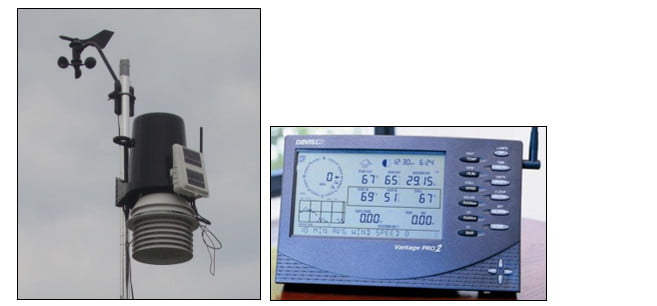
A typical wireless automatic weather station costing around £60, with the sensor array outdoors (left) and the console which displays and records the data (right). But don’t put too much faith in the forecast shown.

weather station

A wireless automatic weather station and indoor console at the other end of the price range, costing around £900.

The price of such a weather station can be anywhere from £60 up to £900. In general, you get what you pay for, and pricier stations will generally be more accurate and reliable, and measure more things (solar radiation, for example).  In many cases, the main problem with budget weather stations is that the temperature and humidity sensors aren’t very well screened from sunshine, so they can often read a few degrees too high.  But even if you cannot afford to spend a few hundred pounds, quite a lot can be got from stations at the lower end of the market, so lack of massive funds should not stop you buying something.   

Although the Royal Meteorological Society does not recommend specific instruments, suppliers such as Maplin, Oregon, ProData and Weathershop carry a wide range of products and can be found easily online.

Where should we put it?

The good news is: you are not trying to be an official Met Office station!  Many schools and enthusiasts are deterred from setting up a weather station because they think that observations can only be made if you have a large expanse of open area away from buildings. This just isn’t true – perfectly good readings can be taken in pretty much any situation – many schools and amateurs attach their stations to the top of a building wall. It all comes down to what the readings represent – most Met Office stations are needed to represent weather that occurs in open, unsheltered, conditions, so there are strict rules about proximity to buildings and trees.  In addition, measurements of different weather elements have to be at set heights above the ground: temperature and humidity at 1.2m, rainfall at 0.3m and wind speed and direction at 10m. But your weather station doesn’t have to do all this, it just has to represent what the weather is like around your school – which may be similar to that around many other schools and back gardens, but will probably be nothing like that at a Met Office station. So do not let a lack of perfect exposure to weather put you off setting up a station.

Having said that, if you are lucky enough to have an area at ground level which is as open to the weather, and can provide a pole for the anemometer and some fencing to protect the station, then your data will look more like that at official stations.   

As noted above, one common method for mounting a wireless automatic weather station is on the side of a wall, poking above a roof, perhaps on an outbuilding (see photos below). If possible, put the anemometer and wind vane up higher than the other instruments so that the speed and direction of the wind is less affected by buildings. You could even attach it to an existing lamppost or tall fence.

The transmitter part of the weather station has to be reasonably close to the receiver console, somewhere between 50m and 300m depending on the type, or even closer if the radio signal has to penetrate walls. Always check that you have good reception before you finally decide on a spot.              

Vandalism can be a problem, so mount it out of reach, or use fencing (which can be expensive). On the other hand, someone in charge will need to access it from time to time (see next section), so think about the safety issues too.

Two videos (Location Part 1 and Location Part 2) from the London Grid for Learning (LGfL) discuss some of the issues:

http://weatherstations.lgfl.org.uk/maintenance.html

You can also Google “school weather station” images, to see examples of what other schools have decided to do – these show both automatic weather stations and traditional manual ones.

The final decision is always going to be a trade-off between several factors: as open to the weather as possible, accessibility for maintenance, security from damage and distance from the receiver. Quite often, you can get a position which isn’t too bad for temperature and humidity, is just about OK for rainfall, but isn’t very good at all for wind speed and direction. Remember, do the best you can, but a less-than-perfect exposure is better than nothing.  But bear in mind the deficiencies of location when comparing with other schools etc.

school weather station

(Left) A well exposed station at Sutton, part of the LGfL network, although quite difficult to access. (Centre)The weather station at Maiden Erlegh school. (Right)A typical home weather station on the side of a garage.


What maintenance is needed?

Like most things, a weather station will perform better if it is looked after, but this doesn’t need to be very onerous.

Batteries. Even if the weather station has solar panels, batteries are needed to help the station run at night and during the depths of winter, so need changing periodically. The indoor receiver and console will also need batteries replacing, unless it has a mains adaptor.  

Make a visual check from time to time to make sure the mounting pole is still vertical and hasn’t been bent over by high winds – this could affect wind and rainfall observations.

Rain gauges are prone to a couple of common problems that can be easily cured. Firstly, remove any leaves that may have gathered in the collecting funnel as eventually these can block any rain from getting to the measuring mechanism below. Secondly, lift off the funnel and check that there aren’t any spiders’ webs stopping the bucket from tipping – this is more common than you might think. 

Keep an eye on your data, and in particular compare it with the nearest station (this is easy to do using the WOW network – see below).  There are sometimes tell-tale signs of problems, for example lack of rainfall over a few days compared to a neighbour indicating a blocked gauge, or straight line traces invariably indicating a battery problem. Usually the pressure sensor is inside the receiver console, so if this is still working and the other readings aren’t, this may indicate a problem with the wireless link.


How do we store or disseminate the data?

Of course you don’t have to store any data, you can simply read the console (or the instruments) when you want to and leave it at that, or just note down the weather conditions, for example every morning. 

The consoles of many automatic weather stations (even cheap ones) can be plugged into a PC with a USB lead and readings can be displayed on the screen using a programme supplied with the station. The console also usually acts as a logger, to store weather data, typically at 10 min intervals. The same programme also allows you to download the data (maybe every two or three weeks) and keep it as an Excel spreadsheet on the PC.  This means you can plot the data on a graph later, or use it for investigations (see later paragraph).  An alternative to the manufacturer supplied software is a programme called Cumulus, which is available as donation-ware from www.sandaysoft.com

 Cumulus also makes it very straightforward to put your observations on the web, using the Weather Observations Website (WOW) developed by the Met Office and the Royal Meteorological Society.  This network shows observations from all over the world and has the following advantages for schools:

  • Forecasters at the Met Office HQ at Exeter use WOW maps to help them see if their forecast is evolving accurately, so contributing your school’s data will be helping to improve the forecast.
  • If you zoom in on your own area on the map, you can see how your school’s weather compares with other nearby stations. You can also select the nearest Met Office station to compare with – but remember, that will generally have a perfect open exposure so any differences will be partly due to this.
  • By clicking on your station, you can show graphs of weather over the past day or month or even longer – and, again, compare your station with a nearby one .
  • You can see your data as a table, and cut and paste it into an Excel spreadsheet. As this is always available from WOW, you may decide you don’t need to download and save your data yourself.
  • You can look back at maps of observations hour by hour, even months or years ago. So you can look at a special weather event such as thick fog, a baking hot day or some heavy rainfall. Or perhaps a special event such as Sports Day or a town carnival.
  • If you zoom out, you can see how your weather compares with that being collected at the same time by schools in Australia or Alaska – an instant geography lesson!
  • If there is an exciting weather event in some other country, such as a hurricane in Florida or a heatwave in Australia, you might be able to find evidence of it on WOW

Your WOW page allows you to add photographs of your station; this is particularly useful in showing to others how well your station is exposed.  Details of how to link your weather station to WOW.

weather graph

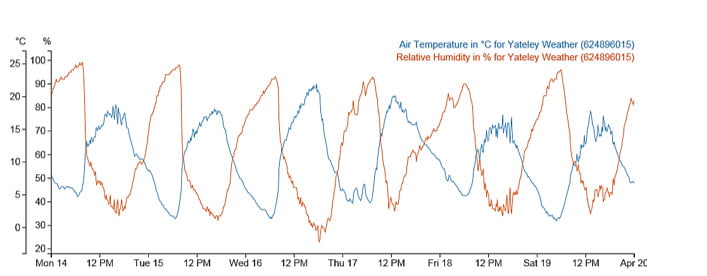
WOW can display your weather station data over any time period in the past, in this case a week with warm and dry days and cool and humid nights.

UK weather data

(Left) Using WOW it is easy to compare your readings with other schools or amateurs in the same area. This shows relative humidity in the Reading – Farnham area reported by 17 stations. (Right) Temperatures across the UK at the time of the 2014 London Marathon; cool areas are green, warm areas are orange.

global weather data

Using WOW for an instant view of world weather (January 2014); on this day the temperature ranged from -20ºC in Alaska to +38ºC in Australia.

How can we use the weather station for teaching activities?

  • Plot on a graph (using a spreadsheet or manually) pairs of weather elements, to see if there is any correlation between them. These could include rainfall and temperature, rainfall and pressure, temperature and wind speed, or wind speed and time of day. If there does appear to be a correlation, why should this be?
  • How does weather vary each season? Each month? What has the weather been like over the past week?
  • Produce a weather report for the day and present it as if you were a TV weather presenter.
  • Compare your readings with those from a nearby school or schools (you could use WOW for this) and explain the differences. You could forge links with the other school(s) to make this a joint project.
  • Host visits from other local schools that don’t have a weather station, to tell them what they are missing and help them set up their own.
  • Invite the Maths department to make full use of your data to teach statistics and graphs or as the basis of projects. This could include the correlations idea, above. Once you have a few years’ data, you can ask questions such as “What is the probability of getting frost at our school”, “How likely am I to get wet if I am playing football outside for an hour” or “Does it rain more at weekends than during the week?”
  • Once the school has collected, say, 5 years of data, this can be used to look at average conditions, and published (eg on the website) as “The climate of Meldrew School”.
  • Keep a log (either online or on the PC or even in a book) of “Weather extremes for Meldrew School”. Add the date and time of new extremes of temperature, wind speed etc. New extremes get more exciting as time goes on.
  • Add in visual observations of clouds (amount and type) and visibility, thunder and lightning, snow, sleet, hail, etc.
  • Use your school weather station to lead into the topic of climate change by pointing out that it is an affordable version of the sort of weather stations which are deployed in their tens of thousands all over the world. A careful examination of the data from those that have been operating for several decades allows us to say if climate is changing.
  • The weather station is a natural way to introduce many concepts in science – water vapour as a gas, evaporation and condensation, atmospheric pressure, solar radiation, etc
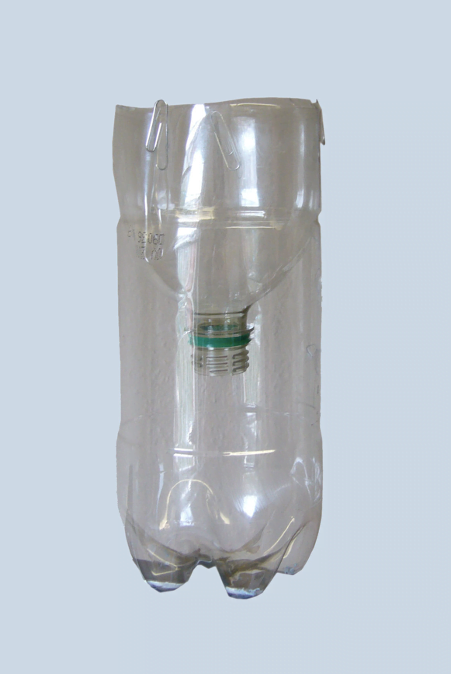
  • Link it to simple experiments such as making a cloud in a plastic bottle or making a tornado, which can be found at: https://www.metlink.org/experiments/ or demonstration videos at http://www.youtube.com/playlist?list=PL4D17D18D91FA431E&feature=plpp
  • Use the weather station to test the accuracy of home-made instruments such as a barometer, hygrometer, anemometer or rain gauge given at https://www.metlink.org/experimentsdemonstrations/
  • Compare the weather station data with measurements in different parts of the school using handheld instruments such as anemometers, simple rain gauges and thermometers, to build up a picture of the school’s microclimate
  • Use the microclimate data collected in the project above to make practical decisions about where would be the best place to put a wind generator, a rainwater collector or a solar panel.

(See in addition some of the points made in the opening page of this note).

Further information

Try Googling “running a school weather station” to see what others have done, and what they get out of it.

There is a wealth of forums on the web, run by both education and weather enthusiasts, where answers to many questions can be found.

Some of the ideas in this paper have come from online articles by Martin Sutton, who runs a weather station at Maiden Erlegh School near Reading.  You can read more of his excellent advice at: http://www.weatherstations.co.uk/maiden-erlegh.htm

If you want to read a bit deeper, but still in an understandable way, about weather stations, get hold of a copy of the Weather Observers Handbook by Stephen Burt.  http://www.cambridge.org/gb/academic/subjects/earth-and-environmental-science/atmospheric-science-and-meteorology/weather-observers-handbook?format=PB

Projects

Weather Instrument Projects

Weather Station
Automatic Weather Station
Barometer
Temperature
Wind
Rain and Evaporation
Humidity

Ideas and lesson plans to enhance the learning and teaching of weather studies in schools.

By Dr Geoff Jenkins

Project Ideas

Introduction

These pages give practical advice for pupils and teachers on weather-related projects that could be undertaken. In addition, there is general guidance and advice on equipment that pupils can use at home, at school or out in the field.

It goes without saying that projects based on the weather must teach the student something about the weather. Otherwise, they are not worth doing. Weather happens out of doors, so it is obvious that weather projects must involve some outdoor activity, and preferably quite a lot. Weather projects should not be done from textbooks only, unless there are good reasons (e.g. disability). Similarly, crunching through a pile of weather statistics that have been obtained elsewhere or not by the student personally may be a good way to learn about statistics but gives little real insight into the weather.


General points for teachers when giving advice on weather-related projects

It is always a good idea to encourage more able pupils by adding in the variables of seasonal change or different pressure patterns. Even the simplest project, such as Project 1 on weather forecasts, can be extended to see if the forecasts become more accurate under high pressure.

Practice runs beforehand are ideal and strongly recommended – they give pupils valuable practice with unfamiliar equipment and can help to both identify and iron out potential problems at certain sites. From experience, this gives pupils scope for making extremely good points in the evaluation section of their project.

A 10- to 14-day collection period is advised for many of these projects. Less than 10 days can cause problems with abnormal readings. If the pupils are prepared to take readings for up to 21 days, then let them do so.

The use of maximum-minimum thermometers is the one area where erroneous data can be produced. In theory, their use should be straightforward, but in practice, pupils may not read from the right place, or reset the thermometers. These points should be stressed, especially if their friends or family are making the readings – do not assume that parents know how to use the maximum-minimum thermometer either.

Measuring precipitation using a manufactured rain gauge is no problem, but these can be expensive. In any case, many pupils prefer to make their own, but their design can lead to difficulties. Refer the pupils to Met Office guidelines on the correct size and conversion formulae (they are also in good textbooks). Pupils frequently use large plastic bottles, but both these and milk bottles may not be wide enough, so suggest a funnel is placed inside to make a wider opening – ideally it should be at least 125 mm in diameter. The collecting vessels should be designed to allow regular emptying and should be robust enough to withstand regular handling. If they split, leakage will occur and ruin the results. Pupils should be made aware of all these points and that even family pets can cause damage to the vessels.

With some of these projects, especially numbers 2, 4, 5, 6 and 8, pupils might want to consider the use of a control station. This can be used to spot sources of irregularities, and faulty equipment can be recalibrated. The school’s weather station or Stevenson screen is ideal for this. Having such a control will allow pupils to comment on their evaluation about having a real scientific method, and checking for sources of error in their observations.

If a standard household thermometer is being used, remember that it can take up to 15 minutes to settle and record the actual temperature at the site. When measuring wind speed, pupils should remember that gusts and lulls can occur. Holding up the anemometer for up to a minute or two can help to overcome this, and an average speed calculated for that period. If readings are being made alongside a busy road, the pupils should also remember that large vehicles can cause sudden gusts.

If there is no access to a good quality anemometer, you can buy ventimeters from sailing shops. These can give good readings.

Projects based on Weather Station recordings

Kestrel simple weather station

Making routine observations with a school weather station is not just an instructional activity in its own right. Once a set of measurements has accumulated over a period of two or three months (the longer the better), this database can be used for a range of different projects.
Instrumental measurements that can be made with a school weather station include (in order of cheapness): temperature (particularly daily maximum and minimum), rainfall, relative humidity, light level, pressure and wind speed. Simple visual observations include wind direction, visibility and cloud amount/type. See our document on simple weather instruments, which describes some useful instruments and techniques.

Projects that use collected data fall into several categories:

Describing the climate of the location for as many weather elements as possible. This is best done with data for two or more years, so that year to year differences can be explored. In some years, days in December can have higher maximum temperatures than days in June!

Comparison of the school’s collected data with another set of data, taken from another school or a local ‘official’ weather station. This is particularly interesting during a time of unusual weather, e.g. a period of very low temperatures or intense rain.

Comparing the records of two or more elements, to see if any relationships exist. This can be done in general qualitative terms or by using quantitative correlation techniques. Weather elements that might show interesting relationships (at least over certain periods) are:
Pressure and rainfall
Wind direction and rainfall (try using ‘wet’ and ‘dry’ day wind roses)
Wind direction and temperature or humidity
Wind direction and visibility
Wind direction and wind speed
Wind speed and minimum temperature
Cloud cover (early morning) and minimum temperature (or daily range, i.e. difference between maximum and minimum)

The project should not only demonstrate a link but also try to explain possible reasons for it.

Weather records can often be used in association with other measurements or observations, e.g. plant growth, or number of pupils with illnesses.

Project using a barometer

Find out how air pressure changes as you go up in the atmosphere, by taking a barometer up a hill or a tall building. Measure pressure before and after, to correct for any variation of pressure with time.

Projects using temperature measurements

Measurements of temperature out of doors are cheap and easily made using standard liquid-in-glass thermometers, simple bimetallic thermometers or electronic thermometers. The latter use thermistors as sensors and usually have LCD readouts. They are clear and can be read with greater precision than the other types. However, precision must not be confused with accuracy. Indeed, electronic thermometers often have poorer accuracy than other types of thermometer. But in many projects absolute accuracy is not very important.

Measurements are best made away from the influence of buildings. A school playing field is ideal, or even a large playground. Some form of shield is mandatory, to protect the thermometer or thermistor probe from direct sunlight by day. After dusk, a ‘radiation screen’ is not so important but is still useful to reduce the effect of infra-red radiation from the ground.

Suggestions:

Record the way in which outside temperature varies over the course of a day (i.e. 09h to 16h). Is the variation the same on cloudy days as on clear days? Is the variation the same close to the ground as a few metres above the ground?

Record the rapid changes of temperature that occur around sunrise or (probably more conveniently) sunset, by taking measurements every five minutes for an hour or so. Again, look at differences between cloudy and clear nights, and between calm and windy nights.

Look at the temperature difference between two heights, one close to the ground (say 2 to 5 cm) and one at 2 to 3 metres. How does this temperature gradient change between day and night, cloudy or clear, calm or windy? What does this tell us?

Measure the temperature below the ground. Contrast the diurnal variation (on the same day or night) with that in the air. Look at this variation at several depths – say 5 cm, 10 cm or 20 cm – and below different surfaces, e.g. grass or bare earth.

How do buildings influence temperature by day and by night? Make measurements out in the open and gradually nearer to buildings, and make them in courtyards, passages, etc.

As an extension of the above, investigate how whole towns and cities affect air temperature. This can really be done only with staff assistance, by driving through a town or city from one side to the other. An electronic thermometer with the probe mounted on the top of the radio aerial is ideal. A cold, calm, clear night gives the best ‘urban heat island’ effect – but try it on a cloudy, windy night for comparison.

soil thermometer
Soil Thermometer
Digital Thermometer
Digital Thermometer
Minimum Maximum Thermometer

Projects using wind measurements

If you have a suitable instrument, see how the wind speed varies from one averaging period (say, 10 seconds) to the next. How does this variability depend upon the averaging period?

Investigate the way in which wind speed depends upon height above the ground. Measure at, say, 30 cm, 1 m and 3 m. Simple flap-type anemometers or ventimeters can be used for this. How does the wind speed profile differ over different surfaces, e.g. smooth grass, rough pasture, heather or bracken?

Find out how the flow of wind is affected by buildings, by measuring wind speed well upwind, around the buildings and downwind of them.

Anemometers and Ventimeters

Cup anemometers (bottom and centre) and ventimeters (top)

Projects using rainfall and evaporation measurements

Investigate the way in which rainfall accumulates during a long period of rain as a warm front moves across the area, by checking the rainfall every 30 minutes or so. Contrast this with rainfall rates in shorter-lived showers.

How big are raindrops? Collect them on coloured blotting paper and quickly measure their sizes. Calibrate the blotting paper by dripping water droplets of known size/volume onto it. How different is the size distribution of raindrops in showers compared to that in drizzle?

Look at the sheltering effect of trees and buildings by putting down a network of simple rain collectors (e.g. jam jars) and measuring the accumulated volume in each after a shower or longer period of rain. Relate the result to wind speed and direction.

By leaving out a dish of water, look at how fast the water evaporates, between, say, 09h and 12h, or between 12h and 15h. Relate the amount of evaporation to weather elements.

Simple 2-part rain gauge with measuring cylinder


Projects using humidity measurements

Contrast the relative humidity measured first thing in the morning with that at midday and in mid-afternoon. Why does relative humidity change on days when there is no change in the weather, e.g. on a clear, fine day?

Why does seaweed change from brittle to flabby?

Constructional Projects

Some types of weather instrument can be constructed by students aged 14-16. However, as with the caution above about statistics-based projects, make sure that constructional projects teach students about some aspect of the weather, not just about electronics or mechanical engineering.

Automatic Weather Stations

Automatic weather stations An automatic weather station usually consists of a number of outdoor weather sensors which communicate with an LCD display unit indoors, which can in turn often be linked into a PC to store and display data. Once the preserve of the professional, or at least the rich amateur, recent advances in technology and production mean that simple (sometimes called “family” or “hobby”) weather stations are well within the reach of most amateurs and schools. The price will depend upon how many weather elements are measured; for example, just outdoor temperature (including maximum and minimum) might be around £15, just rainfall around £30, temperature and humidity around £40. Even a station which displays the six main weather elements (temperature, humidity, wind speed and direction, rainfall and pressure), can now be bought for about £100. In addition to giving the basic measurements, quite often the display unit will also calculate quantities such as wind chill, dew point, etc. Sometimes it will also give a weather forecast, though based as it is on only local conditions, this must be taken with a big pinch of salt!

The link between the instruments outdoors and the display inside may well be by wireless, removing the need to feed a wire into the house or school, athough the range will be 100m at best, and often well below this. At the sort of prices quoted above it is not surprising that the manufacturer does not give details of accuracy, so this might be quite modest, although perfectly adequate for many applications in teaching or for the interested amateur. (Note that precision is often quoted, which is very different; for example, outdoor temperature might be displayed with a precison of 0.1°C whereas its accuracy may be no better than a degree or more). A professional automatic station reading six elements may well cost £500 or more, but you will get the benefits of a known accuracy for all the measurements, and probably higher reliability and longer lifetime.

There are many advantages to an automatic weather station. Weather observations can be made more quickly and conveniently, which might mean they can be taken four times a day in schools instead of just once. The sensors can be placed well out of the way and reduce the chances of vandalism – and (in the case of wind measurements, for example) in a better exposed location than would be possible with hand instruments. If a PC link is available this this opens the door to using the data for all sorts of projects, from simple averaging ones to looking at correlations between different measurements such as wind direction and temperature – although of course manual readings could be entered into a PC and the same sort of projects undertaken. The main disadvantage of an automatic weather station is that it removes the observer from the real elements being measured, and thus the experience of what minus 5°C temperatures or 30 knot winds feel like, is lost. And actually seeing the liquid in a thermometer contracting in cold weather, or pouring rain from a collector to a smaller-diameter measuring cyclinder, for example, naturally leads to discussion of these topics and the maths and physics behind them.There is also some satisfaction in having braved bitter winds or lashing rain to get the results!

The RMetS does not actually recommend specific instruments or manufacturers, but you can find instrument providers amongst our Corporate Members.

1. How accurate are weather forecasts for my local area?

Equipment needed

A simple thermometer, anemometer (and compass?) and cloud recognition chart.

Pupil’s notes

This project involves collecting weather data each day, for a 10- to 14-day period, and comparing your readings with forecasts in the local newspaper or on web sites. Around midday you should record the air temperature, weather conditions, cloud cover, cloud type, wind speed and wind direction. If you have an automatic weather station at your school, you can use these readings and make your own observations on clouds and weather conditions. You should keep the weather forecasts that have been made, compare them each day with your readings, and then work out how accurate the forecasts have been. At the end of the time period, you can work out the overall accuracy level, and then suggest reasons for any differences.

accuracy

Teacher’s notes

In essence, this is a very simple project, but one which able pupils can extend by explaining the discrepancies between observations and forecasts, e.g. fronts moving faster than expected, the impact of local topography and the shelter effect of hills.

2. A survey of how the temperature changes in my back garden

Equipment needed

At least two thermometers – one for ground temperatures, and the other for air temperatures at 1.2 metres above the ground (possibly on a post). An anemometer (and compass?) would also be useful.

Pupil’s notes

This is a detailed survey of how temperature changes in your garden. You need to collect data each day (or even twice a day) for a 10- to 14-day period, recording the air and ground temperatures. You could also make a note of cloud cover and wind speed/direction. Cloud cover will help you explain unusual changes, e.g. temperatures may drop if skies have been clear at night. Similarly, knowing wind speed and especially direction, will help you explain temperature changes in terms of the prevailing air mass. If you are only measuring data at one place, you should take care to avoid shaded areas of your garden. You could set up several measuring points and see how temperature varies around your back garden, and then draw a chloropleth or isoline map to show the differences and patterns. Having more than one collection point would also allow you to calculate a daily average for your garden. Another extension would be collecting data twice a day, e.g. at 8 a.m. and 6 p.m.

Teacher’s notes

Pupils should use maximum-minimum thermometers and a fairly sensitive anemometer, but great care is needed in resetting the thermometers. More able candidates could collect weather maps from a broadsheet newspaper or the images and charts from the Met Office web site, and then relate the temperature changes to the passage of frontal systems across the area. Dramatic temperature changes can also occur under a blocking anticyclone where temperature inversions and ground frosts regularly develop. Pupils should therefore be encouraged to take careful note of the cloud cover and whether a ground frost occurs.

3. An analysis of temperature patterns across a town/city

Equipment needed

A digital thermometer or probe.

Pupil’s notes

Temperature changes across an urban area, and this project involves looking at these subtle changes, caused by different types of buildings or open spaces. You should make a transect across the urban area (from north to south, or east to west) taking readings at regular intervals every 500 metres, or you can choose a variety of locations all over the urban area. Ideally, you should have 10-15 sites which you can visit on foot, by bike or in a parent’s car. At each site, you should record the air temperature, holding your digital thermometer at the same height above the ground at each site. You should also make a description of the site – densely built up, low-density housing with gardens, open space, etc. You should repeat your survey at the same time over the next two or three days. Remember, you are not really after an average for each site, but checking whether the temperature changes in the same way at each site at different times. You can extend this project by visiting each site early in the morning, around noon and in the late afternoon.

Teacher’s notes

Help may be needed in deciding on the choice of observation site and direction of transect. The timing of the transect is also an important consideration, as urban heat islands are often most sharply defined in the early evening. Also remember that strong winds can equalise differences, so suggest that calm days are chosen. A basic household thermometer, or maximum-minimum thermometer should not be used, unless of course it is left at each site – help from school friends and relatives is a possibility. Digital thermometers will be the most accurate. Pupils could also collect weather maps from a broadsheet newspaper or the images and charts from the Met Office web site. Dramatic temperature changes can occur under a high-pressure system with little cloud cover, so that temperature inversions develop. Pupils should therefore be encouraged to take careful note of the cloud cover at the time of their transect. Very interesting patterns can be found if the transect crosses the central business district or a river valley. If the survey is being undertaken in a small town or large village, this project could be extended using data-collection points in the rural areas, so that differences between urban and rural areas are noticeable.

4. How do wind patterns vary around a large building?

Equipment needed

A good anemometer (and compass?).

Pupil’s notes

Wind speeds and directions can vary dramatically around buildings, especially tall tower blocks, large sports stadia or public buildings such as cathedrals. The wind can increase and swirl in unusual eddies as the air passes over and around the obstructions. You should identify a number of sites – 10 or 12 would be ideal – and try to get an even coverage around the building. Visit each site in turn, making a note of the wind direction and speed. You should try to visit the sites on mornings and/or afternoons for several days (possibly for up to a week). Although you can take an average wind speed and average direction for each data collection, it is even more interesting to notice the changes around the building, and you could answer the following questions. Where are wind speeds above average, and below average? Are the strongest winds always in the same place? In addition, the wind direction readings might help you spot where eddies are strongest.

well graph

Teacher’s notes

The key to this project is having a sensitive enough and/or fairly sophisticated anemometer. Some of the basic ones will not adequately measure light breezes. Having said this, very good results can be obtained near tower blocks, and more able pupils might be able to study the venturi effects produced, or the problems these faster winds cause, e.g. blowing litter around and low-level pollution. This project is very effective in winter and spring when low-pressure systems cross the country. It can be less effective under high pressure, so if the pupils are making these surveys in the summer holidays they should be made aware of these difficulties. This will prevent the embarrassment of them returning to school in August or September saying that the project did not work, or that there were never any winds! Speeds should be recorded in metres per second rather than by the Beaufort scale.

5. How do temperatures vary inside and outside a woodland area?

Equipment needed

Several maximum-minimum thermometers. At each site, you will need one for ground temperatures, and another for air temperatures at 1.2 metres above the ground (possibly on a post). You could use a digital thermometer rather than use several maximum-minimum thermometers. You can also use a light meter (see pupil’s notes).

Pupil’s notes

Air and ground temperatures will vary inside and outside a wood because of the vegetation and shade. To see how these change, choose one area inside the wood, and another up to 100 or 200 metres away, well out of shade. You should measure ground and air temperatures at each site over a 10- to 14-day period. If you are using a maximum-minimum thermometer, just one visit a day will be needed, whereas a digital thermometer will need reading each day at about 8 a.m. and at 6 p.m. It would also be useful to record the weather patterns and cloud cover at the time of the readings, as this may help explain unusual patterns, e.g. low temperatures early in the morning under clear skies. If you are using a digital thermometer, you could make a transect across the wood, taking readings every 50 metres or so. The vegetation also filters the solar radiation so that light intensity changes inside a wood. This can be measured using a light intensity meter or the light meter on a camera – if the latter is chosen, set the aperture to f8 and point the camera at the same object each time (a clipboard will suffice). The shutter speed will give a surrogate measure of light intensity, as the faster the shutter speed, the greater the light intensity.

Teacher’s notes

In order to obtain decent results, a fairly large copse or wood should be chosen, and the pupil should check that they can gain access beforehand. Maximum-minimum thermometers are ideal, but if they are not available, a digital thermometer can be used to record ‘real-time’ temperatures. This will entail the pupil visiting the sites at roughly the same time each day over the period – again an important fact that they need to be aware of before starting. From experience, maximum-minimum thermometers give more flexibility. More able candidates could also collect weather maps from a broadsheet newspaper or the images and charts from the Met Office web site. These will help explain any dramatic temperature changes that might occur under a blocking anticyclone, where temperature inversions and ground frosts regularly develop. Pupils should therefore be encouraged to take careful note of the cloud cover and whether there is a ground frost when they make their observations. If the readings are being made in a large wood, it is a good idea to encourage pupils to choose a variety of sites within the wood. Another extension is to compare the measurements from a wooded area with a variety of non-woodland sites, e.g. back garden, at school or in a built-up area. This could also lead to a more detailed project on temperature differences between urban and rural areas.

6. How much precipitation is intercepted in a woodland area?

Equipment needed

A simple rain gauge or collecting device. A simple thermometer might also be used (see pupil’s notes).

Pupil’s notes

Trees intercept rainfall, so this project is a variation on Project 5, whereby you need to place a number of rain gauges in and outside a woodland. You should choose a number of sites inside the wood, and at least one up to 100 or 200 metres away, well out of any shade. You should then measure the amount of rainfall at each site over a 10- to 14-day period. You could make readings several times a day if there is heavy rain. If so, it might be useful to monitor the temperature as well as cloud cover and type – these readings will help you work out if the rain is associated with the passage of a warm or cold front, etc. If your school has an automatic weather station with an electronic rain gauge, you can use this to work out the approximate time of your storm, the intensity and its duration. This will all help you answer questions such as whether more or less interception takes place in longer or heavier storms.

Kids rain gauge

Teacher’s notes

Potentially this can be a very good project, but problems can occur, chiefly with vandalism or the knocking over of the rain gauges. In addition, the summer months should be avoided as, in theory, there should be less rain! This is a good project at Easter or during the late spring when the trees are in leaf and there is a greater potential for interception. More-able pupils might nevertheless want to see how interception varies during the year, or in different seasons, and from experience, some very good projects have been undertaken on this topic. Another practical difficulty is that in very heavy storms, leaves are often battered down by the fast-falling raindrops. The best results are often obtained in steady rain.

7. How does the weather change as a depression/warm front/cold front passes over?

Equipment needed

Thermometers (preferably maximum-minimum), an anemometer (plus compass?), a cloud recognition chart and a barometer.

Pupil’s notes

Subtle changes occur in weather patterns as mature depressions move across Britain, especially with the passage of warm and cold fronts (plus occluded fronts), as well as the warm and cold sectors. You can observe these changes by setting up an observation station in your back garden or by using the school weather station or Stevenson screen. If you are making observations at home, take care to avoid shady areas in your back garden. To do this project effectively you should keep a close eye on weather charts in local or national newspapers, or the images on web sites, in order to see roughly when the depression and fronts will cross your home region. You will then need to carefully monitor the changes in air pressure, air temperatures, cloud cover, cloud type, wind speed, wind direction and weather conditions. Ideally, you should try to make recordings every two hours during a two- or even three-day period as the low-pressure system passes over. Satellite images and synoptic charts on the Met Office web site could be printed off to help explain the changes you observed in the weather patterns.

temp rain chart

Teacher’s notes

This is another project where data collection is quite straightforward, although accurate thermometers are needed, hence the preference for a digital one. Having said this, the regularity of making observations is crucial. Taking readings just twice or three times a day may not be sufficient. It is important that the pupils look at, and keep, the synoptic charts and weather maps from the broadsheets or web sites. More-able pupils should be able to see whether their changes fit the textbook models, and then explain any discrepancies. Another extension would be to add a rain gauge to measure precipitation as the fronts pass over. The regularity of data collection, every two hours, can be a difficulty, especially the night and early morning readings. Therefore, the data from the school’s automatic weather station can be substituted, with the pupils still collecting primary data by noting cloud cover, cloud type and weather conditions.

8. A study of the shelter effect of trees/hedges

Equipment needed

A digital thermometer or several thermometers, preferably maximum-minimum. At each site you will need two thermometers – one for ground temperatures, and the other for air temperatures at 1.2 metres above the ground (possibly on a post).

Pupil’s notes

Trees and hedges can have a shelter effect, causing temperatures, especially close to the ground, to change in a subtle way. For this project you should choose an area with woodland or one with thick, mature hedges. You could use your garden if it is quite large. Set up a line of evenly spaced measuring points where, if you are using maximum-minimum thermometers, you should place your measuring posts. Six or eight posts moving away from the hedge, or if possible on both sides of the hedge will be needed. Remember to ask permission to place these beforehand! If you are using a digital thermometer, place wooden pegs in the ground so you always measure at the same place. Take readings over a 10- to 14-day period at each observation post – if you are using a maximum- minimum thermometer, only one daily reading is needed, but if you are using a digital thermometer, you need to take readings around 8 a.m. and 6 p.m. It is also useful to make a note of cloud cover, as temperatures can fall very low under clear skies. Remember that it is the differences between air and ground temperatures at each site and as you move away from the obstacle, that are important, so take great care to read your thermometers accurately, and do not round up the temperatures on digital displays.

Teacher’s notes

This can be a really good project in a rural area or for pupils who live on farms. The choice of a back garden is adequate, as long as it is a good-sized one. If so, this could be combined with Project 2, to produce an isoline map of temperatures across a back garden, showing the shelter affect. More-able candidates could also collect weather maps from a broadsheet newspaper or the images and charts from the Met Office web site. These will help explain any dramatic temperature changes that might occur under a blocking anticyclone where temperature inversions and ground frosts regularly develop. Pupils should therefore be encouraged to take careful note of the cloud cover and whether there is a ground frost when they make their observations.

9. How do air temperatures change as you move up a hillside?

Equipment needed

A digital thermometer, while an anemometer and hygrometer are optional extras (see pupil’s notes).

Pupil’s notes

Air temperature decreases steadily as altitude increases, therefore a transect up a hillside or upland area can identify these changes. You will need 10-12 sites up the hillside, or along a main road. Ideally they should be at regular height intervals, so plot these beforehand using an Ordnance Survey map. Visit each site on foot, by bike, or in a parent’s car, and at each location accurately measure the air temperature, taking care not to round up the temperatures on the digital displays and trying to hold the digital thermometer at the same height above the ground at each location. You may find it useful to make a note of wind speeds and directions, because these may influence the changes, e.g. a cold down-valley wind. When you have finished, you can draw a scattergraph, showing the temperature changes, or thermal gradient, for your transect. You should repeat your transect several times, so that you can draw a series of thermal gradients, seeing whether the changes are always at the same rate between each site. It would also be worthwhile knowing the relative humidity for the area – this is because the amount of water vapour in the air can influence the rate of temperature change (ask your teacher to explain this!). So if you have access to a hygrometer it would be worth noting the readings. If not, use the information from your school’s automatic weather station or Stevenson screen. Some web sites also carry readings on relative humidity that you could use as well.

Teacher’s notes

This can be a very stimulating and interesting project, and a fruitful extension would be to measure temperatures on both the leeward and windward sides of the upland area. On the leeward slopes, a simple Föhn effect can sometimes be observed. It is essential that pupils do not round up the readings to whole degrees – going to two decimal places is a real bonus! More-able candidates should also be encouraged to gather the weather maps from a broadsheet newspaper or the images and charts from the Met Office web site for the days when they are making their transect. These will help explain any dramatic temperature changes that might occur under a blocking anticyclone where temperature inversions might affect the results, especially at the foot of the slope, so that for a while temperature increases with altitude. More-able pupils will also link humidity data with the lapse rates, and whether the saturated adiabatic lapse rate or the dry adiabatic lapse rate prevails.

10. How do temperatures change as one moves inland from the sea/coast?

Equipment needed

A digital thermometer and an anemometer (plus compass?).

Pupil’s notes

Air temperature changes as you move inland away from the sea, a large lake or reservoir. Water bodies can have a cooling effect in the summer months, and a warming effect in the winter. However, the patterns are influenced by the onshore or offshore breezes. This project requires a transect to be made inland away from the water body or coast. You will need 10-12 sites, possibly along a main road running away from the coast. Ideally they should be at regular height intervals, so plot these beforehand using an Ordnance Survey map. Visit each site on foot, by bike, or in a parent’s car, and at each location accurately measure the air temperature and the wind speed and direction. Take care not to round up the temperatures on the digital displays, and try to hold the digital thermometer and anemometer at the same height above the ground at each location. When you have finished, you can draw a scattergraph, showing the temperature changes, as well as a wind rose, for your transect. You should repeat your transect several times at roughly the same time of day, so that you can draw a series of thermal gradients, seeing whether the changes are always at the same rate between each site, and whether they differ depending on the type of breeze and its strength. Alternatively, you could repeat your transect several times a day to see the daily (diurnal) changes as the land or sea warms up and cools down.

Teacher’s notes

From experience, this is another good project for the summer months, or the mid-winter, and some very interesting patterns can occur under high pressure. Very good results can also be found if the transect is repeated at different times of the day, or year. It is important though for pupils to recognise the subtle differences between local breezes and the more-general prevailing winds – local breezes can create interesting small-scale patterns. Once again, pupils should be encouraged to gather the weather maps from a broadsheet newspaper or the images and charts from the Met Office web site for the days when they are making their transect. These will help to relate the micro-scale changes to the macro-scale patterns.

Web page reproduced with the kind permission of the Met Office

Borrow an Instrument

Schools, teachers and Society members in the UK can borrow instruments such as anemometers, thermometers, rain gauges, infrared thermometers and Kestrel weather stations from the Society for use in schools and with scout/ guide groups.

We are also able to lend Kestrel weather stations to students carrying out independent investigations at A Level.

We are very grateful to PCE instruments and Richard Paul Russell for supporting our instrument loan scheme.

UK schools may apply to the Society for the loan of instrument kits for a period of a term. Please contact the Head of Education at education@rmets.org to arrange to borrow a pack. This scheme is extremely popular and we recommend requesting a pack at least 2 terms in advance to avoid disappointment.

We simply ask borrowers to cover the postage and packaging costs (approximately £13) for returning the instruments and to take responsibility for any accidents or loss whilst the instruments are on loan to you.

We also have a list of suggested investigations which can be carried out with the loaned equipment.

The contents of the instrument packs are something like:

Key Stage 2 Kit

10 Infrared thermometers

1 digital anemometer

1 raingauge

2 USB temperature dataloggers

Key Stage 3/ 4 Kit

10 Infrared thermometers

2 digital anemometers

5 USB temperature dataloggers

A level

We have some Kestrel hand-held weather stations, with tripods, wind vanes and USB download ports available to A level students and school expeditions which are suitable for Independent Investigations (NEA) and  Extended Project Qualifications (EPQ) . Please contact the Society at education@rmets.org to discuss availability.

“I wanted to say personally what a huge difference the kit has made to the Advanced Higher students. It enabled some of the students to focus on their real area of geographical interest when they were thinking they would have to compromise and allowed me as the teacher to give real context to the gathering techniques that we needed them to know for their coursework and exam. It really has been invaluable and I can’t thank you enough for the fantastic service you are providing schools”.

Find out more about using weather measurements in an A Level Independent Investigation or other fieldwork. Our instruments frequently accompany school expeditions to amazing locations.

Kestrel weather station
Kestrel in Ladakh

ki

Experiments with an Infrared Thermometer

Make a Rain Gauge

Make a Hygrometer

Make an Aneroid Barometer

Make a Barometer

Make a Wind Meter

Make an Anemometer