Ocean Acidification Experiment

Why are our oceans turning acidic?

See why our oceans are turning acidic due to climate change.

This is an experiment which is hard to do at home and is best suited to laboratory conditions, where appropriate safety measures can be put in place. If you do not have the correct setting and equipment, we have produced a video of the experiment which you can find below. 

Equipment

◊ 2l graduated cylinder

◊ 2ml potassium hydroxide (1M) or sodium hydroxide (1M) 

◊ 1l water

◊ 25ml universal indicator

◊ ~10g dry ice

Method

  1. Pour the water into the cylinder.
  2. Add the potassium hydroxide(KOH) or sodium hydroxide. (NaOH) to the cylinder to make a dilute base.
  3. Add 25ml of universal indicator to the cylinder. You should see the liquid turn blue/purple to reflect the basic pH. You will need to give the solution a stir.
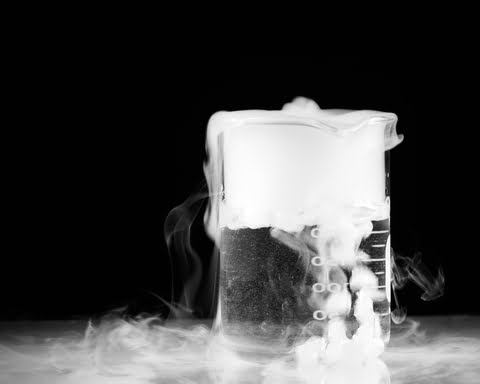
  4. Now gently add the dry ice into the cylinder. You should see gas bubbles rising through the solution, vapour at the top and the solution change colour to an orange/red colour.
Ocean Acidification Experiment

So, what is happening here?

Dry ice is solid CO2.

As the dry ice is dropped in the liquid, it sublimates, going from a solid directly to a gas. This gas bubbles through the liquid, and the vapours you can see at the top.

The CO2 reacts with the water in the solution producing hydrogen, H+, ions.

CO2 (g) + H20(l) → H2CO3 (aq) + 2H+(aq) + CO3 (aq)

The H+ ions produced, react with the hydroxide, OH, ions in the base, producing water and acting to neutralise the solution.

H+(aq) + OH(aq) → H2O(l)

However the universal indicator in solution ends up yellow, indicating the solution is a weak acid. This is because eventually there are no OH ions left, and instead unreacted H+ remain in the solution, turning it acidic.

Optional extra: while the dry ice is still bubbling, you can add more potassium hydroxide or sodium hydroxide to the top of the cylinder, one pipette-full at a time. You should see the liquid temporarily returning to its purple colour, but then changing to yellow again as the carbon dioxide bubbles through.

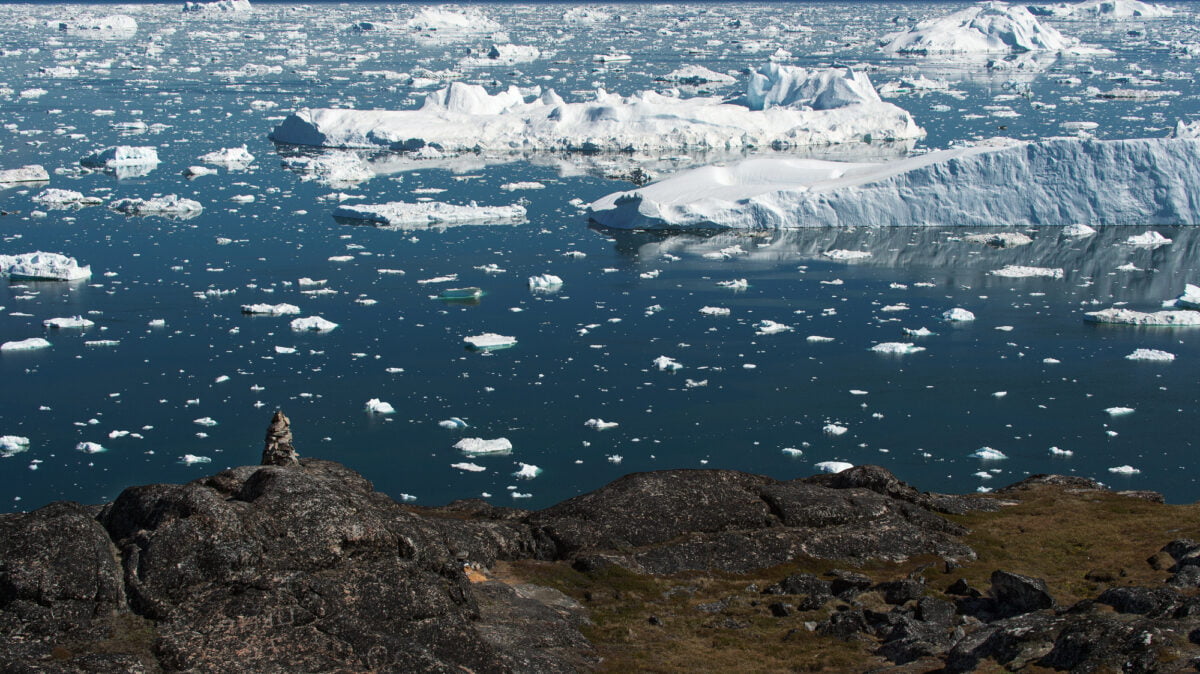
So how does this relate to climate change?

People are rapidly releasing carbon dioxide, CO2, into the atmosphere, mainly through the burning of fossil fuels. This carbon dioxide has and continues to dissolve into the oceans of the world. Approximately 30% of the CO2 released by people since the Industrial Revolution has dissolved into the oceans (IPCC AR6).

The dissolved CO2 produces H+ ions which, as you’ve seen in the experiment, leads to the acidification of the ocean.

The average pH of the oceans has already changed from 8.2 to around 8.1.

The decrease in ocean pH may be having an effect on the distribution and abundance of marine organisms and ecosystems. For example, organisms with shells or skeletons made from calcium carbonate such as oysters, lobsters and shrimp, are seeing a thinning of their shells as they start to dissolve in the more acidic water. The term ‘osteoporosis of the sea’ has been used to describe this impact.

In addition to this, the ability of water to dissolve CO2 decreases with temperature, meaning that global warming is expected to reduce the oceans’ ability to absorb CO2 from the atmosphere. Higher concentrations of CO2 results in higher atmospheric temperatures. Some of this heat is then absorbed by the ocean, increasing ocean temperatures and in turn reducing its ability to dissolve CO2, and so this loop goes on. This is an example of a positive feedback loop.

Ocean Acidification Experiment - Feedback Loop

Watch this experiment from the chemistry labs at Imperial

Special thank you to Imperial, Dr Simon Foster and Dr Adam Davis for help with producing this video.

Where can I find more information?

Take a look at the other ocean acidifcation resources on MetLink:

Ocean Acidification – Worksheet

Increased CO2 levels in the atmosphere are buffered by the oceans, as they absorb roughly 30 % of this CO2. The negative consequences of this are that the oceans become more acidic. The CO2 reacts with water and carbonate to form carbonic acid, reducing the available carbonate that shellfish, crabs and corals combine with calcium to make hard shells and skeletons.

Materials

Chemicals

Apparatus

Bicarbonate of soda (1/2 teaspoon)

2 x 500 ml Beakers

White vinegar (1 teaspoon)

Small plastic or paper cup (100 ml)

Indicator: Bromothymol blue

(Diluted with water: 8 ml bromothymol blue (0.04% aqueous) to 1 litre of water)

Masking tape


2 x Petri dishes or lid for large beakers


Safety glasses and lab coat


Teaspoon or 5 ml measuring cylinder


Two sheets of white paper

Method

  1. Pour 50 ml of the indicator solution into both beakers. 
  2. Add 1/2 teaspoon (2 grams) of bicarbonate of soda to the plastic cup.
  3. Tape one paper cup inside one beaker containing the indicator solution so that the top is about 1 cm below the top of the beaker. Make sure the bottom of the paper cup doesn´t touch the surface of the liquid in the plastic cup. The other beaker will be your control.
  4. Place both clear plastic cups onto a sheet of white paper and arrange another piece of white paper behind the cups as a backdrop (so you can see any colour change).
  5. Carefully add 1 teaspoon (5 ml) of white vinegar to the plastic cup containing the bicarbonate of soda. Be very careful not to spill any vinegar into the indicator solution. Immediately place a Petri dish over the top of each beaker.
  6. Position yourself so you are at eye level with the surface of the indicator solution, ready to see a colour change occurring.

Results

  1. What colour does the solution that contains the plastic cup change to?
  2. Vinegar (acetic acid) and bicarbonate of soda (Sodium bicarbonate) react to produce CO2 that is now present in the atmosphere of the large beaker, in contact with the indicator solution (the ocean). Some of the CO2 starts to absorb into the ocean, changing its pH.
  3.  A colour change from blue to yellow represents a reduction in pH. Is the solution (the ocean) becoming more acidic or more basic?

Application to the World’s Oceans

Corals and shellfish can be affected by ocean acidification, making it harder to create their shells, which will affect other fish up through the food web.

Corals and fish can be affected by slight changes in the temperature of the water and the next experiment also shows the effect of temperature increase on CO2 absorption, creating a positive feedback, a knock-on effect. 

Ocean CO2 Absorption – Worksheet

Does warm or cold water absorb CO2  better?

If the oceans are absorbing large quantities of carbon, and if we know the oceans are warming due to global warming, what is the effect of warmer oceans on CO2 absorption? Let´s check with this experiment that shows how much CO2 will dissolve in the water and how much will be in its gaseous form above the water.cr

Materials

Chemicals

Apparatus

Water

2 x 500 ml measuring cylinders

Effervescent fizz tablets (e.g. Alka Seltzer)

2 x Petri dishes that fit over the cylinders

Ice (optional)

Bowl or container of at least 5 litres


Stand and clamp to hold cylinders


Water heater


Funnel (optional)

Method

  1. Fill the basin half-full with cold  (or iced) water. Place the stand beside the basin.
  2. Fill the graduated cylinder to the brim with cold water and cover the top of the cylinder with the petri dish. Turn it upside down in the basin, making sure that no water spills out of the cylinder (so no air bubble forms). Remove the Petri dish when the cylinder is already underwater.
  3. Secure the graduated cylinder with the clamp to the stand and place the funnel in the mouth of the cylinder.
  4. Place an effervescent tablet carefully under the funnel. (Be sure your hands are dry so as to not set off the reaction prematurely).
  5. Observe the air space that develops at the top of the upside-down cylinder. Record the volume of the air space formed.
  6. Repeat the same procedure with warm water and record your results in the table. What happens to the air space when warm water is used? Is more or less air released than with cold water?
  7. Repeat the same experiment two or three times more with both cold and warm water.

Results table


Experiment number

WARM water (volume of air/ml)

Experiment number

COLD water (volume of air/ml)

1


1


2


2


3


3


4


4


AVERAGE volume


AVERAGE volume


Question: Does more CO2 escape from warm or cold water?


If more has escaped from the liquid, the water cannot absorb as much CO2.

Extension Question: With global warming and warmer oceans, will the oceans be able to absorb more or less CO2 than before?

What is the perfect pH of the oceans? Is it different depending on which ocean and whether it is in the deep ocean or the shallower coastal areas?

Ocean Acidification and CO2 Absorption – Teacher’s Notes

Increased CO2 levels in the atmosphere are buffered by the oceans, as they absorb roughly 30 % of this CO2. The negative consequences of this are that the oceans become more acidic. The CO2 reacts with water and carbonate to form carbonic acid, reducing the available carbonate that shellfish, crabs and corals combine with calcium to make hard shells and skeletons.

Curriculum Links: Core chemistry AQA GCSE

4.2.4 The pH scale

9.1.2 The Earth´s early atmosphere

9.2.3. Global climate change

Chemistry in the activity

Na2CO3 + 2 CH3COOH → 2 CH3COONa + CO2 + H2O (Bicarbonate of soda reacts with vinegar to form carbon dioxide)

In this experiment the students will initiate a reaction that produces CO2 in an enclosed water-air environment. The CO2 formed will be absorbed into the water, making it more acidic and changing the colour of the indicator. The experiment can be carried out in pairs and takes about 15 minutes. An additional experiment to test the solubility of CO2 in warm and cold water can be carried out afterwards, explaining how global warming can affect marine CO2 absorption.

Materials

  • Bicarbonate of soda (baking soda)
  • White vinegar
  • Bromothymol blue Indicator (diluted with water: 8 ml bromothymol blue (0.04% aqueous) to 1 litre of water)
  • 2 x 500 ml Beakers
  • Small plastic or paper cup (100 ml)
  • Masking tape
  • 2 x Petri dishes or lid for large beakers
  • Teaspoon or 5 ml measuring cylinder
  • Two sheets of white paper
  • Safety glasses and lab coat

See the student worksheets for the detailed preparation: Ocean acidification and CO2 Absorption

Application to the  World’s Oceans

The beaker is like an enclosed ocean-atmosphere and the CO2 from the reaction will equilibrate between the water and the air. Our oceans absorb more CO2 when the concentration in the atmosphere increases. But how much CO2 can they keep absorbing? Will they reach a saturation point?

Corals and shellfish are affected by ocean acidification, making it harder to create their shells, which will affect other fish up through the food web. Global warming caused by the increased CO2 effects the corals and fish as only slight changes in the temperature of the water can have effects throughout the ocean´s food chain. So there is a knock-on effect or a positive-feedback from the ocean heating and the ocean acidification.

If you want to illustrate more about the feedbacks and this double impact, the next experiment demonstrates the effect of a temperature increase on CO2 absorption, thus limiting the water´s capacity to absorb as much CO2.

CO2 Absorption in Water class practical

This experiment allows  students to determine how much CO2 dissolves in warm or cold water.

See the student worksheet for the detailed preparation.

Materials

  • Water
  • Effervescent fizz tablets
  • Ice (optional)
  • 2 x 500 ml measuring cylinders
  • 2 x Petri dishes that fit over the cylinders
  • Bowl or container (at least 5 litres)
  • Stand and clamp to hold cylinders
  • Water heater
  • Funnel

Application to the World’s Oceans:

More CO2 has escaped from the warm water, showing that it cannot absorb as much CO2. Warmer oceans will not be as effective buffers at removing CO2 from the atmosphere. However, this phenomenon does prevent these warmer oceans from being as acidic.

References

MetLink - Royal Meteorological Society
We use cookies on this site to enhance your user experienceBy clicking any link on this page you are giving your consent for us to set cookies. More info

By clicking any link on this page you are giving your consent for us to set cookies. More info