Arctic Ice Melting

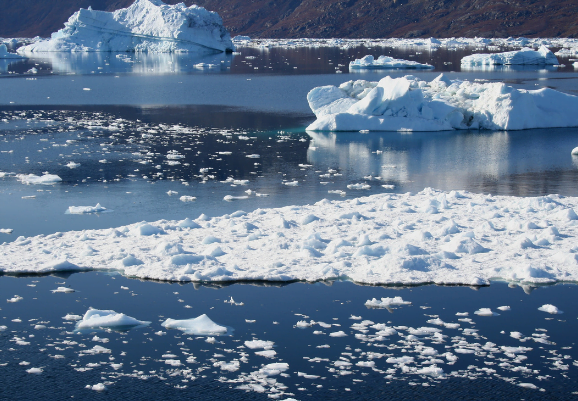
The increasing global temperature due to human-induced climate change is causing ice in the Arctic to melt, particularly over the summer season, July to September.

Arctic Ice Melting Diagram

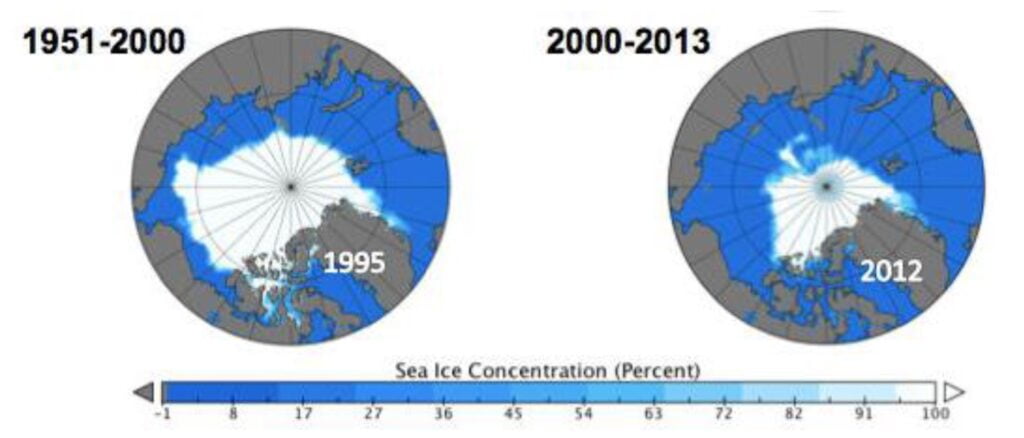
In September 1999, there was 6.2 million km2 of Arctic sea ice.

In September 2015, there was 4.6 million km2 of Arctic sea ice.

Work out the percentage decrease in Arctic sea ice from September 1999 to September 2015. 

[3 marks]

Extinct Species Per Degree

Climate change can lead to species extinction through changing habitats rapidly, not leaving the species time to adapt. Warming at the moment is at 1°C.

A study of 105000 species suggests that for each extra 1°C of warming above pre-industrial temperatures, 9% of species will become extinct.

For example, at a warming of 3°C, 9% of species still in existence at a warming of 2°C will have gone extinct.

Work out the number of species that have not gone extinct at a warming of 4°C.

Give your answer to 2 significant figures.

[4 marks]

A Cocoa Catastrophe

Chocolate is made from a crop called cocoa, which grows on a tree. Cocoa trees are vulnerable to extreme weather events such as floods and droughts, which means that more and more cocoa trees do not successfully produce cocoa each year. 

The number of cocoa trees in a plantation that are still producing cocoa is given by

\[C = 16500\ \times {0.82}^{n}\]

where \(n\) is the number of years after the cocoa trees are first planted.

a) Write down the number of cocoa trees first planted.

[1 mark]

b) Write down the annual percentage decrease of cocoa trees.

[2 marks]

c) Show that the number of successful cocoa trees after 4 years is less than half the number of trees first planted.

[2 marks]

Rainforest Reforestation

One way of reducing carbon dioxide in the atmosphere and slowing global warming is to plant trees which absorb carbon dioxide from the atmosphere.

A scientist plants some trees in the Amazon rainforest and the Tongass rainforest.

The scientist compares the carbon dioxide absorbed from the atmosphere by the trees she planted in the Amazon rainforest with the trees she planted in the Tongass rainforest.

Amazon

Carbon absorbed per tree

\(\frac{1}{5}\) more than in the Tongass

Number of trees planted

\(\frac{1}{4}\) less than in the Tongass

By what fraction is the total carbon dioxide absorbed by the trees planted in the Amazon compared with the total carbon dioxide absorbed by the trees planted in the Tongass rainforest? 
[3 marks]

Losing Coral Reefs

don't use calculatorGlobal warming will affect the world’s coral reefs.

In a world heated by a global warming of 2°C, we will lose 99% of coral reefs.

In a world heated by a global warming of 1.5°C, we will lose 81% of coral reefs.

Express the percentage of coral reefs lost in a world warmed by 2°C  as a fraction of the amount of coral reefs lost in a world warmed by 1.5°C. Give your answer in its simplest form.

[2 marks]

Calculating Sea Level Rise

The table shows information about sea level rise due to human-induced climate change.

(mm = millimetres).

Sea level rise in 2006 (mm)

Sea level rise in 2016 (mm)

40

80

Liam claims, “From 2016 to 2026 the sea level rise will increase by the same percentage as from 2006 to 2016.” He works out, 

Increase in sea level rise from 2006 to 2016 = 80 – 40

= 40

Sea level rise in 2026 = 80 + 40

= 120

Does the sea level rise of 120mm match his claim? Show your working.

[3 marks]

A Desert Area Increase

Climate change (or global warming) can cause the areas of deserts (very dry land) to increase, affecting the surrounding wildlife and ecosystems.

Before global warming began, the area of the Sahara Desert was 9,200,000 square kilometres.

1°C of warming has caused the area of the Sahara Desert to increase by \(x\%\).

After 1°C of warming, the area of the Sahara Desert is 9,936,000.

A further warming from 1°C to 2°C causes an added increase in the area of the Sahara Desert of\(\ 2x\%\).

What is the area of the Sahara Desert after a total of 2°C of warming?

[4 marks]

Graphing Global Sea Level Rise

The graph shows satellite measurements of global sea level rise since 2000 plotted relative to 1993. (sea level rise measured in mm = millimetres)

a) Draw a line of best fit through the data and write an equation for your line in the form y = mx + c, to show how sea level is rising through time.
[3 marks]

b) What are the units of your value for mx, and c?
[1 mark]

c) Using your equation, work out how much higher sea level will be in 50 and 100 years’ time.
[2 marks]

graphing global sea level rise

Some scientists think that sea level isn’t rising with a constant rate, but is in fact accelerating. 

Fitting a quadratic curve to this data gives the equation, y = 0.05x 2 + 2.6x  + 21.3.

d) What are the units of the value for 0.05x2? 
[1 mark]

e) Use this equation to calculate how high sea level will be in 50 and 100 years’ time. 
[2 marks]

f) What is the difference between your answers in (c) and (e)? 
[1 mark]