Climate change has increased heat waves (high confidence) and drought (medium confidence) on land, and doubled the probability of marine heatwaves around most of Africa.
Heat waves on land, in lakes and in the ocean will increase considerably in magnitude and duration with increasing global warming.
Most African countries will enter unprecedented high temperature climates earlier in this century than generally wealthier, higher latitude countries, emphasising the urgency of adaptation measures in Africa.
energy for a change of state = mass × specific latent heat
energy transferred = power × time
to a real world situation.
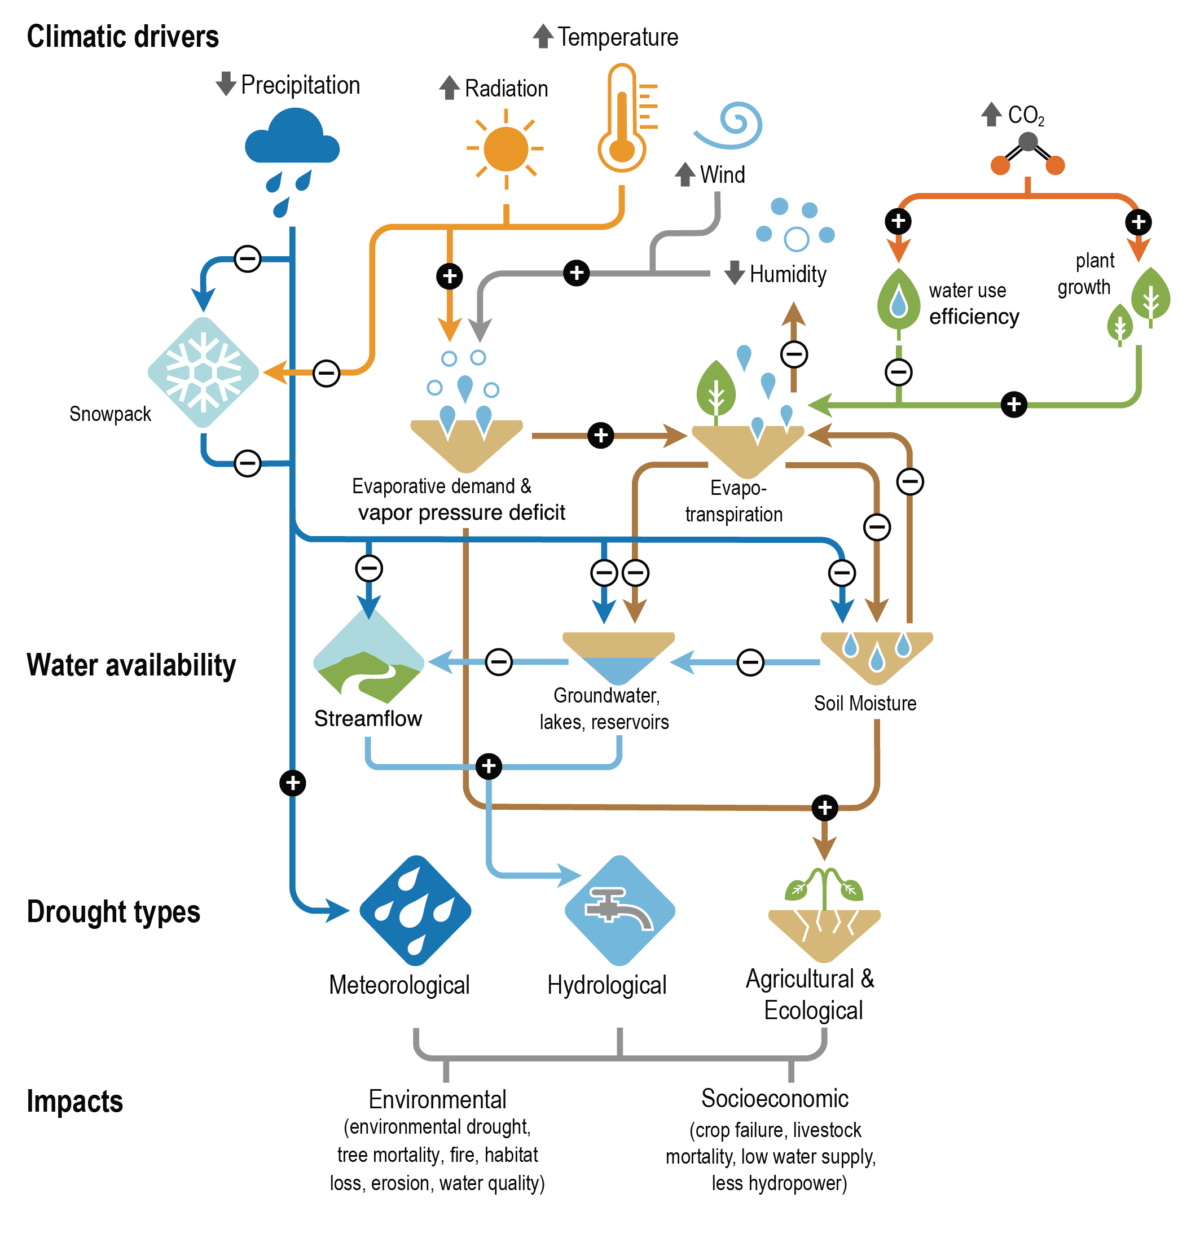
When water evaporates from the leaves of trees, is it called evapotranspiration. The latent heat required for this comes from the thermal store of energy in the surroundings. This question compares the cooling power of evapotranspiration from an oak tree to air conditioning.
An oak tree can lose up to 400 kg of water through evaporation from its leaves in one day (24 hours). Assuming that the energy for evaporation comes from the tree’s surroundings, calculate the average cooling power of the tree. The specific latent heat of vaporisation of water is 2700 kJ/kg.
energy for a change of state = mass × specific latent heat
400 kg * 2700 kJ/kg
power = energy transferred / time
time = 24*3600
power = 10 kW
An air conditioning unit has a power of 2.5 kW. How many air conditioning units would be required to provide the same cooling power as the evapotranspiration of one oak tree?
10 kW / 2.5 kW = 4 units
Describe: Trees as Reflectors
Aim: Students should be able to describe the effects of reflection, transmission and absorption of waves at material interfaces.
This activity would work well as a think/ pair/ share activity, and could also be displayed as a poster or other presentation.
The chlorophyll in green leaves of a tree absorbs the red and blue light in the visible Electromagnetic radiation from the Sun. The green light is reflected.
A green umbrella would do the same.
Both cast a shadow on the ground, implying that less visible light reaches the ground.
The ground also reflects some of the sunlight and absorbs the rest.
Absorbed sunlight increases the thermal store of energy.
The greater the thermal energy stored in an object, the more infrared radiation, heat, it emits.
Would you feel cooler walking along a road that is shaded by trees than you would if you carried a green umbrella?
Both the umbrella and the trees will reduce the amount of sunlight reaching you and warming you up.
They will also reduce the amount of sunlight reaching the ground. However, the trees are permanent and will have been shading the ground all day, so the ground in the shadow of the trees will be cooler than the ground in the shadow of a moving umbrella.
The heat, infrared radiation, reaching you from the ground will be lower in the shadow of the trees.
Extended ideas
These could include:
evaporative cooling as described above,
the fact that the trees will also be a barrier to convection so heat could be trapped near the ground,
the fact that trees will be a barrier to the wind and so air will be trapped below them. This will also reduce the conduction of heat from the ground,
in the long term, trees remove carbon from the atmosphere and so reduce the greenhouse effect,
trees can also reduce air pollution,
trees can reduce flooding by slowing the flow of water.
C.2.6 Cities intensify human-induced warming locally, and further urbanization together with more frequent hot extremes will increase the severity of heatwaves. Urbanization also increases mean and heavy precipitation over and/or downwind of cities and resulting runoff intensity.1
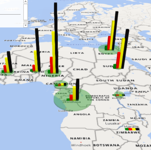
The table below shows the efficiency of various factors at warming up or cooling down neighbourhoods of 3 urban areas. Overall, cities tend to be warmer than their surroundings. This is called the ‘urban heat island’ effect. Cities and urban areas tend to be warmer due to extra warming caused by human activities such as industrial processes, but also because urban surfaces tend to be darker coloured and drier than rural surfaces.
Recall that a positive figure represents a temperature rise and a negative figure represents a temperature decrease.
Calculate the difference between the worst- and best-case scenarios.
Which factor has the greatest variability between the best and worst case scenarios?
Which factor has the smallest variability between the best and worst case scenarios?
Using the average change data, how much additional temperature change could there be in cities that have no sources of water & no vegetation?
Complete the graph by adding the average change to city areas temperature for each of the five factors shown in the table.
Which of the five factors shown has the biggest warming impact in cities?
Which of the five factors shown has the biggest cooling impact on a city?
Image source: Google maps
Which of the following locations would be most likely to….
Feel cooler during a summer heatwave?
Feel too hot in a summer heatwave?
Have people wearing shorts and a t-shirt in summer?
Observe the tarmac on the roads melt in a summer heatwave?
According to the IPCC in the future:
Further urbanization will amplifythe projected air temperature change in cities regardless of the characteristics of the background climate, resulting in a warming on minimum temperatures that could be as large as the global warming itself.
Compared to present day, large implications are expected from the combination of future urban development and more frequent occurrence of extreme climate events, such as heatwaves, with more hot days and warm nights adding to heat stress in cities.
Using these statements, what are the two factors that will cause temperatures to rise in urban areas?
Imagine that you could redesign the city to limit the effects of climate change. Make a list of all of the things that you could do to reduce the impact of climate change on your chosen city. Next, consider the strengths and weaknesses of all of those options. You might want to consider using a table like the one below;
Using the urban areas fact sheet
Read very carefully through the fact sheet from the IPCC, about the impact of climate change on urban areas. You can access it here – Urban Areas fact sheet (ipcc.ch)
Explain why urban areas can influence the temperatures locally:
Suggest how urbanisation might affect the water cycle within urban areas. Make a list below;
Source: IPCC, 20212
Using the map above, identify;
The city with the greatest increase in temperatures
The city with the smallest increase in temperatures
A city where the temperature has not changed
The city where urban effects have caused the largest relative share of total warming
The city where urban effects have caused the smallest relative share of total warming
The areas of the world but have heated the most between 1950 and 2018
An area of the world which has experienced cooling in the same time period
Considering what you have already learned, suggest reasons why some cities have warmed more than others
Source: IPCC, 2021 2
Using the graph from Japan answer the following questions;
In 1900 which area was the warmest?
In the year 2000 which area was the warmest?
Calculate the temperature difference between the urban and rural areas of Japan in 1900.
Calculate the temperature difference between the urban and rural areas of Japan in the year 2000.
In which year did urban temperatures surpass rural temperatures for the first time?
Suggest reasons why Tokyo is now significantly warmer than Choshi
Describe the general patterns on the graph.
According to the IPCC:
The difference in observed warming trends between cities and their surroundings can partly be attributed to urbanisation
Urbanisation has exacerbated changes in temperature extremes in cities, in particular for night time extremes.
One study examining the 2003 heat wave in Europe that killed upward of 70,000 people found that night-time temperatures were a key indicator of the health risk from high temperatures. There’s also research that shows high night-time temperatures disrupt sleep. Without relief from the heat, the stresses on the body mount.
While it may cool off after the sun sets during a heat wave, it may not cool off enough for people who have been exposed to high temperatures all day. That leads to a higher cumulative exposure to heat.
Extreme heat is one of the deadliest weather phenomena in the world. There are direct health effects like heat stroke, (when body temperature rises above 40C, leading to organ failure) and heat exhaustion.
Prolonged periods of high temperatures cause cardiac and respiratory disease leading to excess deaths, particularly in older people.
Simplify the information above into the flow chart below:
Explain why the fact that urbanisation has increased night time extremes of temperature could pose health problems for people who live in cities.
Sources
IPCC, 2021: Climate Change 2021: The Physical Science Basis. Contribution of Working Group I to the Sixth Assessment Report of the Intergovernmental Panel on Climate Change [Masson-Delmotte, V., P. Zhai, A. Pirani, S.L. Connors, C. Péan, S. Berger, N. Caud, Y. Chen, L. Goldfarb, M.I. Gomis, M. Huang, K. Leitzell, E. Lonnoy, J.B.R. Matthews, T.K. Maycock, T. Waterfield, O. Yelekçi, R. Yu, and B. Zhou (eds.)]. Cambridge University Press. In Press. P.34. Accessed 28th November 2021 at Sixth Assessment Report (ipcc.ch)
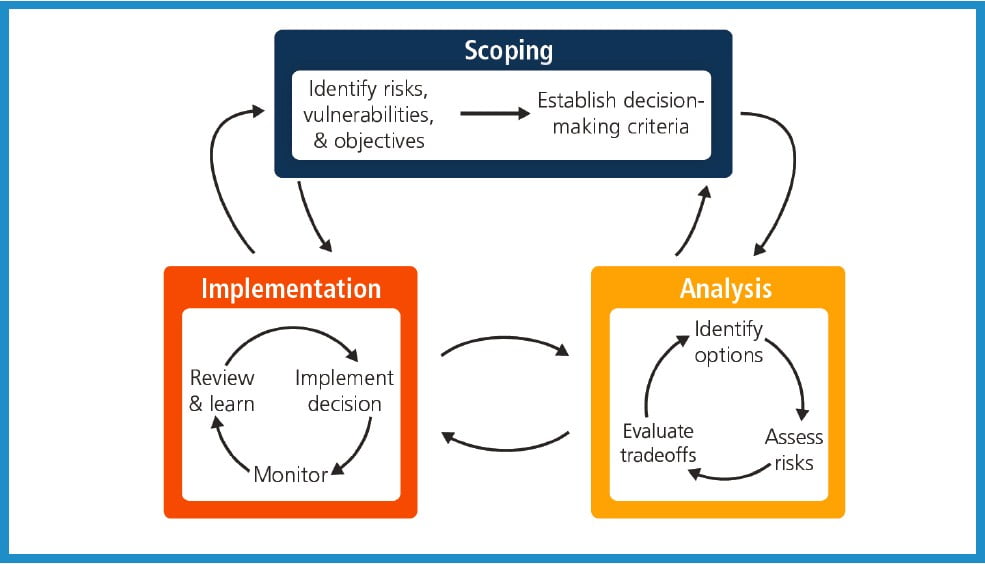
Climate change adaptation as an iterative risk management process with multiple feedbacks. People and knowledge shape the process and its outcomes. Assessment of the widest possible range of potential impacts, including low probability risks with major consequences, is central to understanding risk management strategies. Monitoring and learning are important components of effective adaptation.WG2 Summary for Policy Makers Figure 3.
Summary:
Adaptation is the process of adjustment to actual or expected climate change and its effects. In human systems, adaptation seeks to moderate or avoid harm or exploit beneficial opportunities. In some natural systems, human intervention may facilitate adjustment to expected climate and its effects.
Throughout history, people and societies have adjusted to and coped with climate, climate variability and extremes with varying degrees of success.
For many indigenous and rural communities, lay knowledge is critical to adapting to environmental changes including climate change as livelihood activities such as herding, hunting, fishing and farming are connected to and dependent on weather and climate.
Adaptation is becoming embedded in some planning processes, with a focus on incremental adjustments and co-benefits. In particular, Governments are starting to develop adaptation plans and policies and to integrate climate change considerations into broader development plans.
Responding to climate related risks involves decision making in a changing world, where the timing and severity of climate change impacts are uncertain and there are limits to the effectiveness of adaptation.
Adaptation choices now will affect the risk of climate change throughout the 21st century.
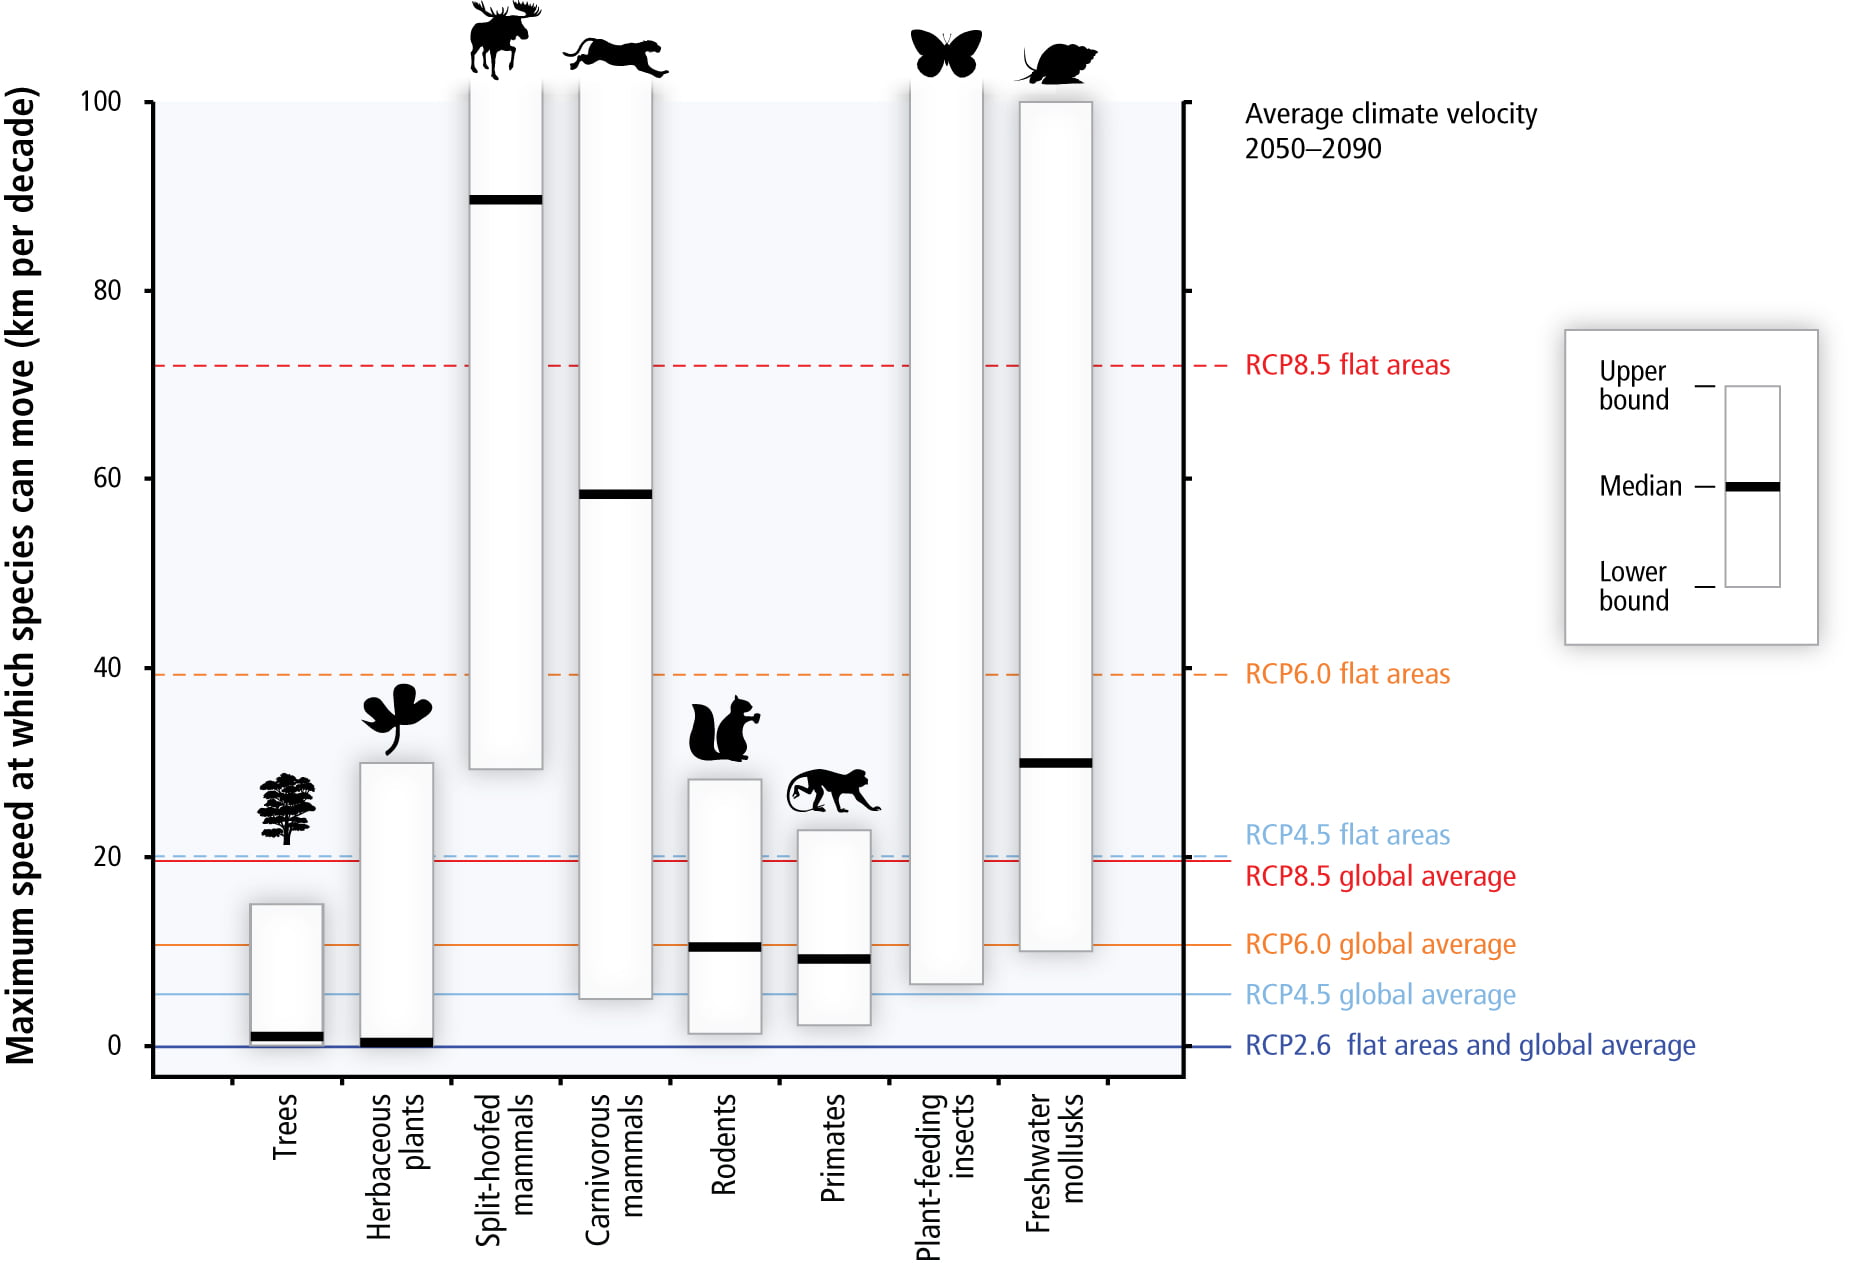
Maximum speeds at which species can move across landscapes. Human interventions, such as habitat fragmentation, can change the speeds of movement. The coloured horizontal lines show the speeds at which temperatures are expected to move across landscapes according to different projected warmings – RCP8.5 being a scenario where greenhouse emissions are high and the world warms most quickly. Species with maximum speeds below each line are expected to be unable to track warming in the absence of human intervention (such as assisted migration). They may still be able to adapt to new climates. The numbers of those which can neither move nor adapt will fall.WG2 Summary for Policy Makers, Figure 5.
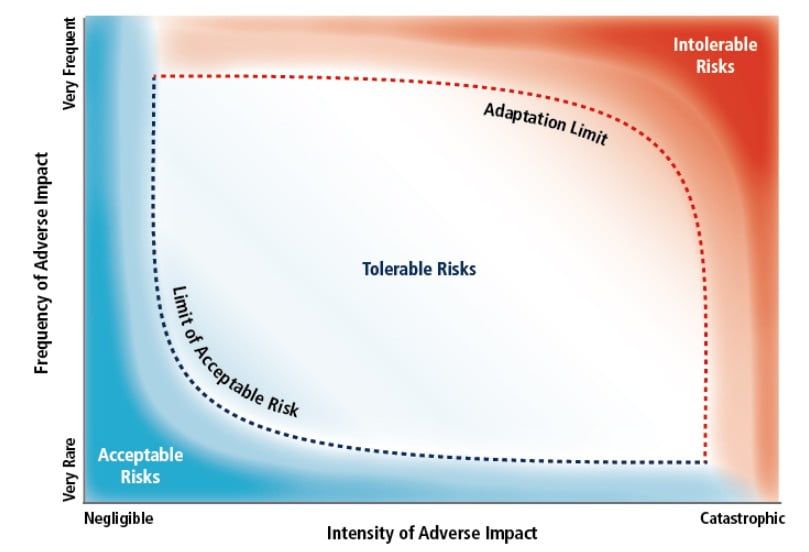
A conceptual model of the determinants of acceptable, tolerable and intolerable risks – according to an individual or a society. Adaptation efforts try to keep impacts within the tolerable risk space, although these may be limited by opportunities and constraints. The shape of the shaded regions and dotted lines can change over time as attitudes and capacities change. WG2 Chapter 16, Figure 1.
Acceptable risks are those deemed so low that additional efforts at risk reduction, in this case climate adaptation efforts, are not justified. Tolerable risks relate to situations where adaptive, risk management efforts are required and effective for risks to be kept within reasonable levels. The scope of risks that fall within the tolerable area is influenced by adaptation opportunities and constraints. Therefore, the categorization of risks varies across spatial, jurisdictional, and temporal. Opportunities and constraints may be physical, technological, economic, institutional, legal, cultural, or environmental in nature.
Intolerable risks may be related to threats to core social objectives associated with health, welfare, security or sustainability. Risks become intolerable when practicable or affordable adaptation options to avoid escalating risks become unavailable. Therefore, a limit is a point when an intolerable risk must be accepted; the objective itself must be relinquished; or some adaptive transformation must take place to avoid intolerable risk. Such a discontinuity may take several forms such as individual’s decision to relocate, an insurance company’s decision to withdraw coverage, or a species’ extinction. The alternative to such discontinuities is an escalating and unmediated risk of losses. While individuals have their own perspectives about what are acceptable, tolerable or intolerable risks, collective judgements about risk are also codified through mechanisms such as engineering design standards, air and water quality standards, and legislation that establishes goals for regulatory action. There are also international agreements that establish norms and rights relevant to climate change risks, such as the Universal Declaration of Human Rights, the International Covenant on Civil and Political Rights, and the International Covenant on Economic, Social and Cultural Rights. Further, these high level responses often shape the constraints and opportunities to adaptation and responses to risk at lower levels through the distribution of resources, institutional design, and support of capacity development. If these risks and discontinuities have global-scale consequences, they can be linked to ‘key vulnerabilities’ to climate change. Consistent with our framing of adaptation limits, such key vulnerabilities would need to be assessed in terms of the limits they imply for specific social actors, species and ecosystems.
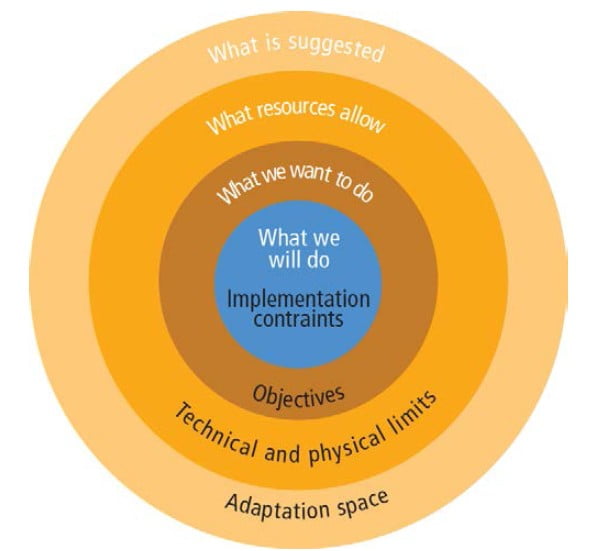
The narrowing of adaptation from the space of all possible adaptations (pale yellow) to what will be done (blue). The factors written in black show the constraints on the size of the circle, i.e. the factors preventing the blue circle being as large as the pale yellow one. WG2 Chapter 17, Figure 1.
A number of factors will limit strategy adoption and preclude elimination of all climate change effects. The first outside circle represents the “adaptation needs”, i.e. the set of adaptation actions that would be required to avoid any negative effect (and capture all positive effects) from climate change. It can be reduced by climate change mitigation, i.e. by limiting the magnitude of climate change.
The second circle represents the subset of adaptation actions that are possible considering technical and physical limits. Improving what can be done, for instance through research and development, can expand this circle. The area between the first and second circles is the area of “unavoidable impacts” that one cannot adapt to (for instance, it is impossible to restore outdoor comfort under high temperature). The third circle represents the subset of adaptation actions that are desirable considering limited resources and competing priorities: some adaptation actions will be technically possible, but undesirable because they are too expensive and there are better alternative ways of improving welfare (e.g., investing in health or education). This circle can be expanded through economic growth, which increases resources that can be dedicated to adaptation. Finally, the last circle represents what will be done, taking into account the fact that market failures or practical, political, or institutional constraints will make it impossible to implement some desirable actions. The area between the first and the last circles represents residual impacts (i.e. the impacts that will remain after adaptation, because adapting to them is impossible, too expensive, or impossible due to some barriers).
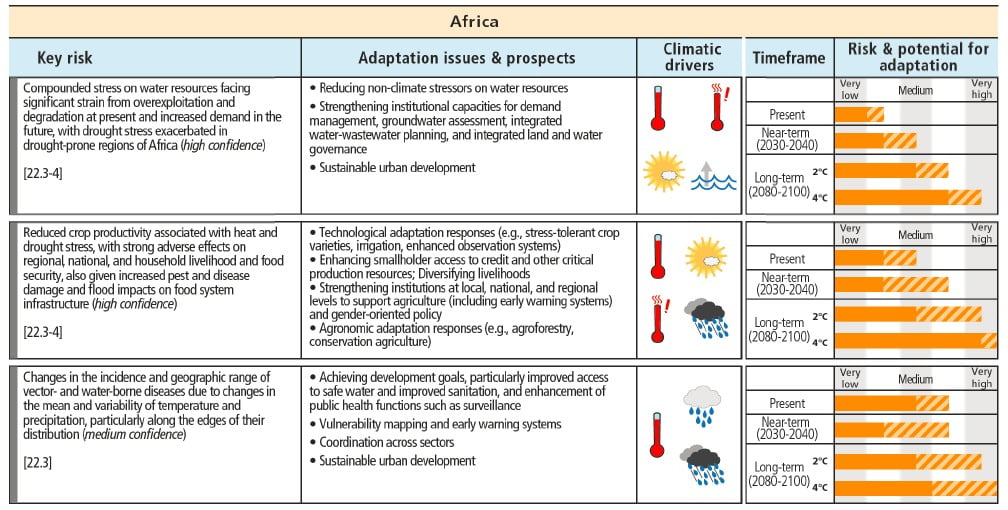
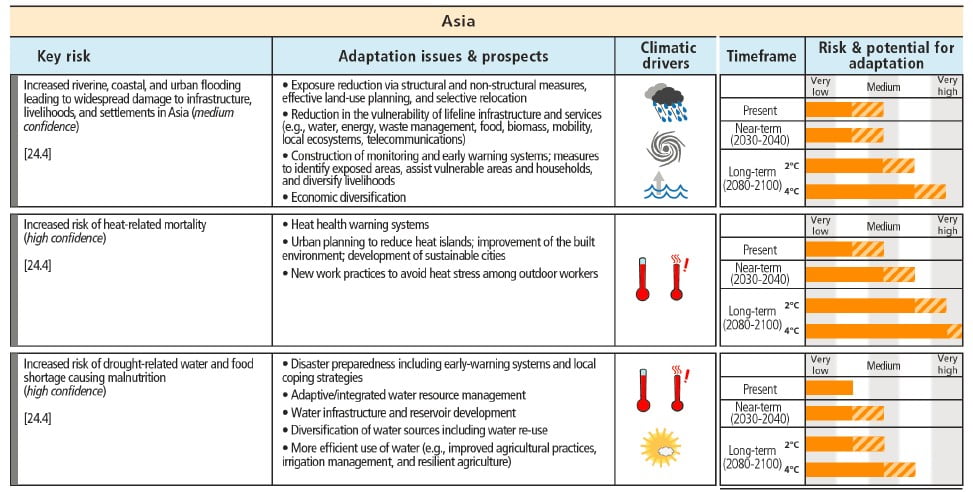
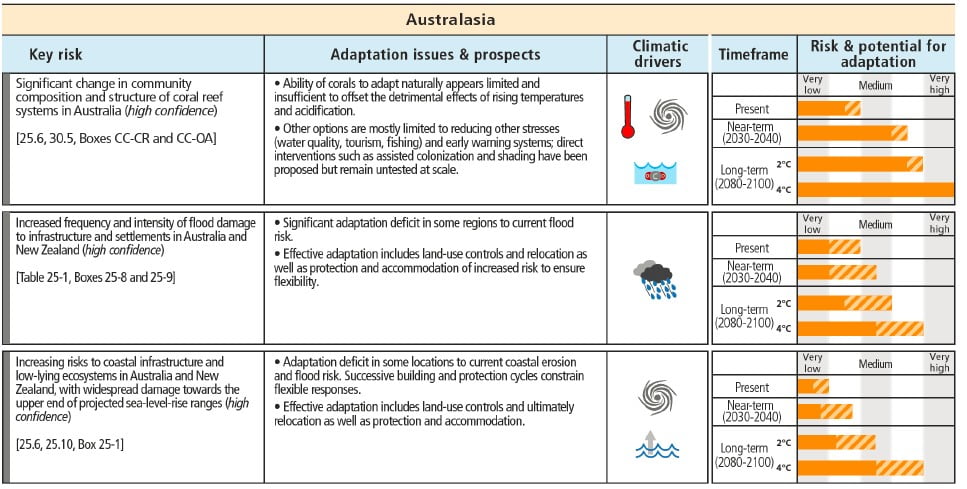
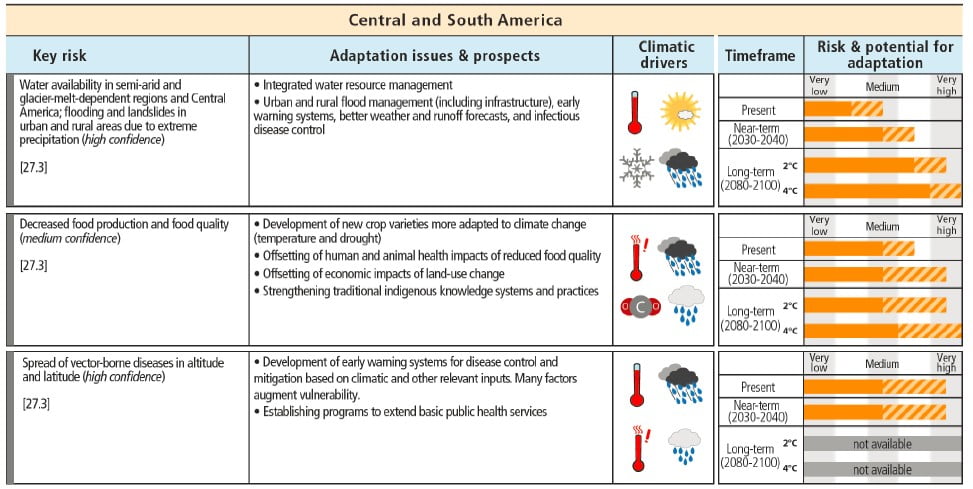
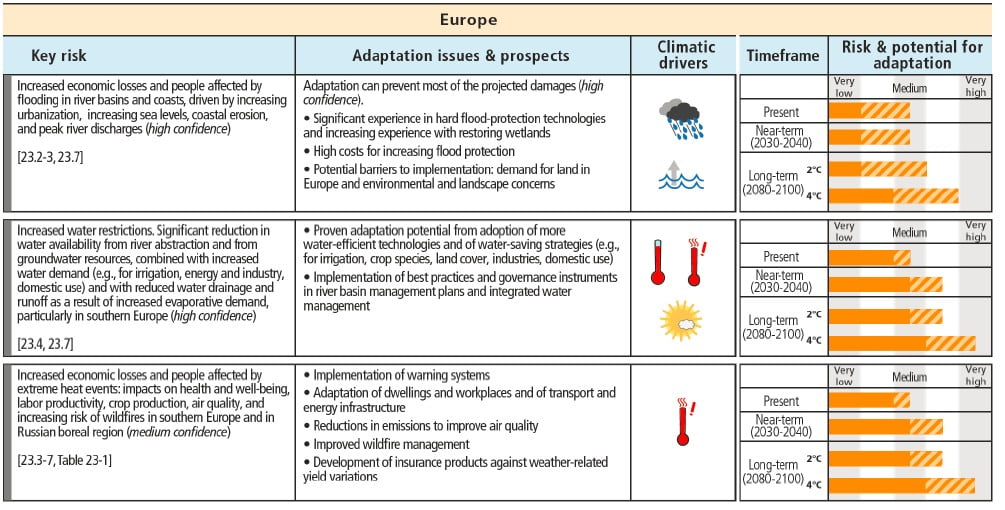
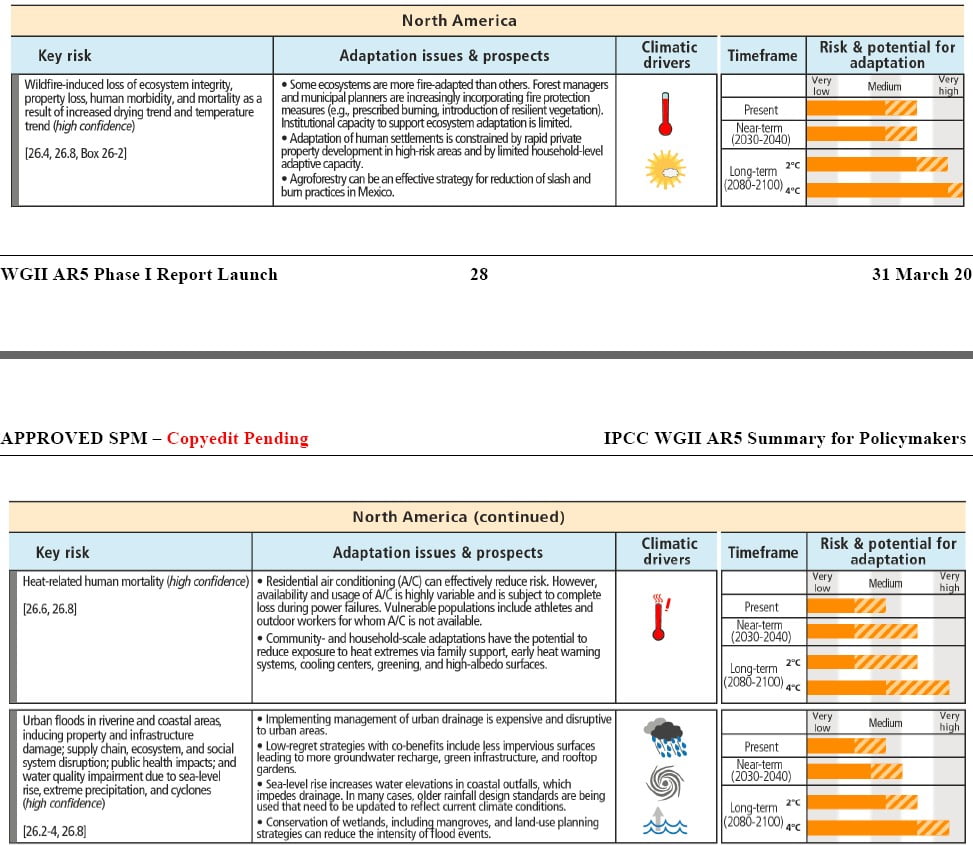
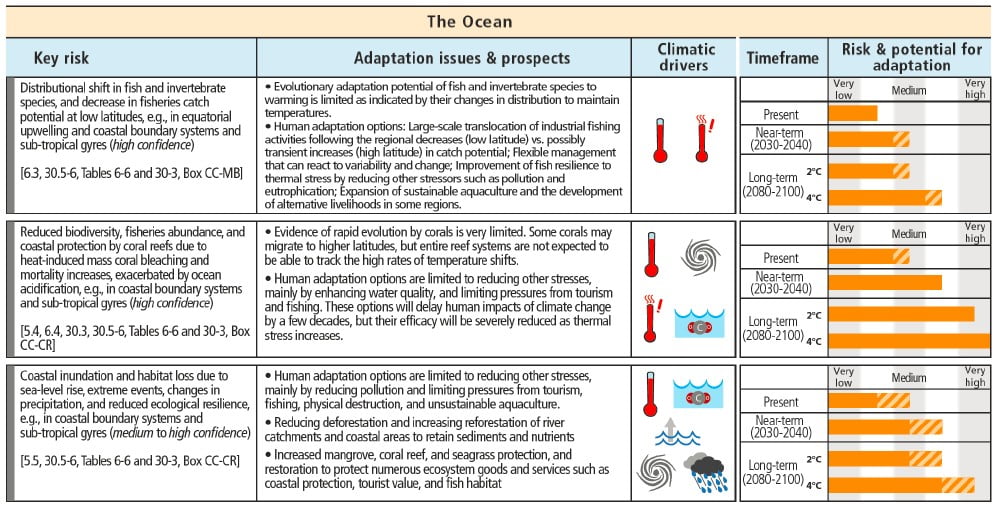
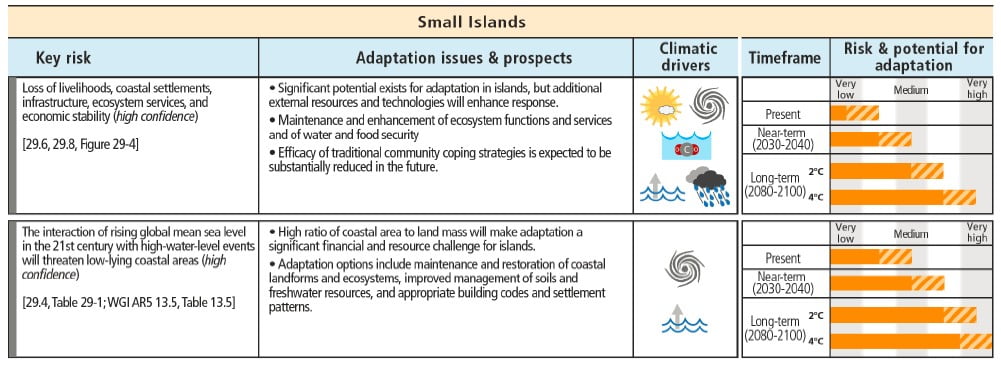
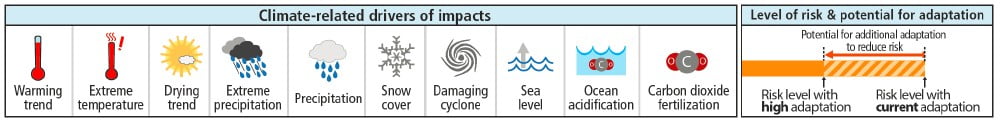
Key regional risks from climate change and the potential for reducing risks through adaptation and mitigation
Could economic approaches bias adaptation policy and decisions against the interests of the poor, vulnerable populations, or ecosystems?
(WG2 FAQ 17.2)
A narrow economic approach can fail to account adequately for such items as ecosystem services and community value systems, which are sometimes not considered in economic analysis or undervalued by market prices, or for which data is insufficient. This can bias decisions against the poor, vulnerable populations, or the maintenance of important ecosystems. For example, the market value of timber does not reflect the ecological and hydrological functions of trees nor the forest products whose values arise from economic sectors outside the timber industry, like medicines. Furthermore some communities value certain assets (historic buildings, religious sites) differently than others. Broader economic approaches, however, can attach monetary values to non-market impacts, referred to as externalities, placing an economic value on ecosystem services like breathable air, carbon capture and storage (in forests and oceans) and usable water. The values for these factors may be less certain than those attached to market impacts, which can be quantified with market data, but they are still useful to provide economic assessments that are less biased against ecosystems. But economic analysis, which focuses on the monetary costs and benefits of an option, is just one important component of decision making relating to adaptation alternatives, and final decisions about such measures are almost never based on this information alone. Societal decision making also accounts for equity – who gains and who loses – and for the impacts of the measures on other factors that are not represented in monetary terms. In other words, communities make decisions in a larger context, taking into account other socioeconomic and political factors. What is crucial is that the overall decision-framework is broad, with both economic and non-economic factors being taken into consideration. A frequently used decision-making framework that provides for the inclusion of economic and non-economic indicators to measure the impacts of a policy, including impacts on vulnerable groups and ecosystems, is multicriteria analysis (MCA). But as with all decision making approaches, the a challenge for MCA and methods like it is the subjective choices that have to be made about what weights to attach to all the relevant criteria that go into the analysis, including how the adaptation measure being studied impacts poor or vulnerable populations, or how fair it is in the distribution of who pays compared to who benefits.
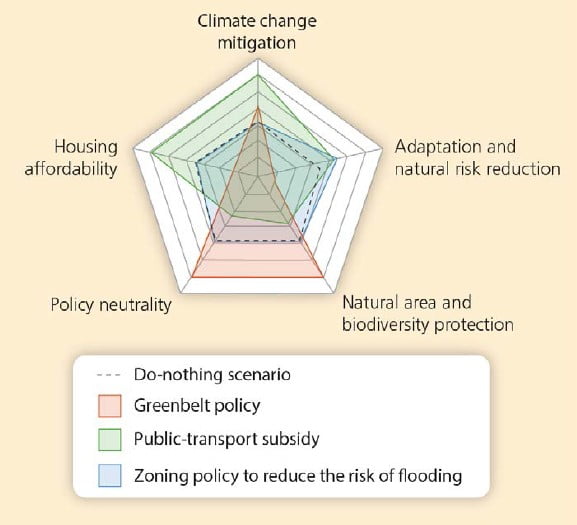
The impact of 3 urban policies in Paris on climate change adaptation and mitigation
Urban policies have many goals, such as enhancing the quality of life and the city’s economic competitiveness by means of affordable housing and office space, amenities and efficient public services.
They also have social objectives aimed at poverty and social segregation issues, safety and security, and public health and environmental goals, such as reducing air and water pollution and preserving natural areas. Urban policies now also face new challenges from climate change, including adaptation and mitigation needs.
Five possible policy goals:
Climate change mitigation: reducing greenhouse gas emissions (from transport, heating and air conditioning).
Adaptation and natural risk reduction: reducing the number of people living in flood prone areas.
Natural area and biodiversity protection: minimising the total urbanised area.
Housing affordability: access to affordable housing has impacts on the quality of life and competitiveness of a city.
Policy neutrality: all geographical areas benefit equally from policies.
The graph below shows the effectiveness of 3 policies in Paris as measured against these policy goals. The three policies are:
1) a greenbelt policy, 2) a public transport subsidy and 3) a zoning policy to reduce the risk of flooding with building prohibited in flood prone areas.
Consequences of three policies in the Paris agglomeration: a greenbelt policy, a public transport subsidy and a zoning policy to reduce the risk of flooding (building prohibited in flood prone areas). The axes are orientated such that moving towards the edge of the plot represents a positive outcome. WG2 Chapter 17, figure 3.
By implementing all three policies, the outcome, considering both positive and negative impacts on the five policy goals, is better than a ‘do nothing scenario’ measured against the five policy goals. Therefore, climate goals can be reached more efficiently and with higher social acceptability, if they are implemented through taking into account existing strategic urban planning, rather than by creating new, independent climate-specific plans.
Additional Source:
Trade-offs and synergies in urban climate policies, V. Viguié & S. Hallegatte, Nature Climate Change 2, 334–337 (2012), doi:10.1038/nclimate1434


