Categories
Blog Climate Climate Change Extreme weather

A Three Dimensional Model of the UK’s Weather and Climate

3D model


The Central England Temperature (CET) dataset is the longest instrumental record of temperature in the world, pre-dating the satellites and radar instruments which we now have to tell us about the state of the atmosphere.

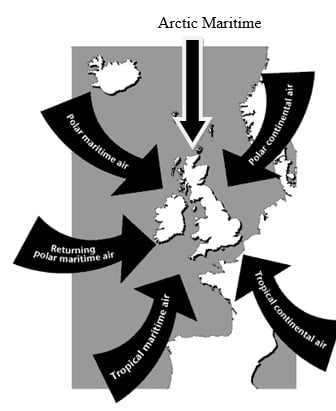
The data represents the temperature in a roughly triangular area of the United Kingdom enclosed by Lancashire, London and Bristol.

The sources of the data include records kept by individuals around the country, all carefully combined and corrected for factors such as changing instruments over time etc. The precision of the data published for each year reflects the number, accuracy, reliability and geographical spread of the temperature records that were available for that year – so early in the record, the data may only have a precision of 1°C or 0.5°C, whereas more recent data has a precision of 0.1°C.

The mean monthly temperature record starts in 1659 (with daily data being available from 1772 and maximum and minimum daily and monthly data beginning in 1878).

The full dataset and references can be found at www.metoffice.gov.uk/hadobs/hadcet

The Royal Meteorological Society is delighted to have collaborated with CREATE Education to develop instructions to allow schools or individuals to 3D print sections of the Central England Temperature Record and use their models to learn about weather, climate, extreme weather and climate change.

These engaging, tactile resources allow students to get a hands-on experience of what climate is and how it can change, and how extreme weather relates to the climate.

Each three dimensional block shows 10 years’ worth of monthly temperature records. Printing off several blocks allows you to compare the changing weather and identify extreme weather events. The models have been designed to interlink, so students can create a series of models to represent larger timeframes.

Climate is usually defined as the average of 30 years’ weather. For easy comparison with the weather in any one year, you can 3D print an additional mini block which shows current (1981-2010) climate.

Once the 3D models have been created and 3D printed, there is a tactile resource that can be used in multiple ways in the classroom to visualise and study past weather and climate, and at how the climate of the UK has been changing over time.

The lesson resources specifically focus on

1. The difference between climate and weather

2. The current climate of the UK

3. The changing climate of the UK

4. Looking at past extreme weather events and researching their impacts on people in the UK.

Categories
Blog Teaching

New Teaching Resources – Tropical Cyclones

We continue to add new teaching resources to Weather and Climate: a Teachers’ Guide. 

Some of the latest are in the Tropical Cyclones section:

– A listening exercise extracting information from a hurricane warning podcast

– Grid reference practice based on the track of a Tropical storm. 

Categories
Blog Geography Secondary Teaching Weather

Air Masses

In this article we explore air masses – the idea that, by looking at where our wind is blowing from, and what has happened to the air in the wind on its way to us, we can begin to understand why we’re getting some particular weather.

We live on an island, and the weather can come at us from any direction, although in practice, it comes from some directions more than others  – this wind rose shows the direction the wind was recorded coming from at Heathrow airport, near London. The longer the bar, the more often the wind came from that direction, so you can see that our wind comes from between southwest and west most often.

Lets take a step back and remember that warm air rises – whether that’s the air being heated in a hot air balloon or the air above a radiator (watch a simple demonstration).

What happens to the rising air? As it rises it cools. Cloud and rain are caused by warm air rising, warm air rising is called convection (watch a simple demonstration).

You can often see convection going on in the atmosphere – you get puffy cumulus clouds, with flattish bases and puffy tops where the cloud is bubbling up.

clouds

More generally, Clouds form when there is more condensation going on than evaporation in the atmosphere.

The colder it is, the less evaporation happens – so cloud forms when the air cools.

This isn’t just when warm air rises.

Now we can think about air masses, they are classified according to where they have come from, and what they have passed over:

UK air masses

One air mass generally covers the whole country.

However, it can bring different weather conditions to different places. For example, Tropical continental air can carry Saharan dust, but it mostly falls on the south of the UK – there isn’t much left in the air by the time it reaches Scotland.

Lets consider Polar maritime (Pm) air first (click on the map to start the animation):

Polar maritime air comes towards us from further North in the Atlantic. It starts cold, but is slowly warmed by the ocean below as it travels over progressively warmer water. It also picks up moisture from the ocean. 

As it is warmed, it becomes more unstable and inclined to rise, leading to convection and puffy Cumulus clouds, mainly over the ocean. As the air hits land (the western coast of Ireland, Wales, Scotland and England) the air, which was already inclined to rise, is forced up a bit more – forming more cloud, and giving rise to rainfall. 

Polar maritime air, our dominant air mass, brings cloud and rain to the west of the UK and relatively dry air to the east. 

This satellite image is typical of Pm air – you can see the puffy cumulus clouds over the ocean, and the belt of cloud over the western side of the country.  

Returning Polar maritime air (rPm) is air which is Polar in origin but which swings round to hit the UK from the west or even slightly south of west – but if you were to follow its path back, you would see that it was Polar. 

Arctic maritime (Am) air is extreme Polar maritime air, coming down to the UK straight from the north, over the Arctic ocean. It tends to bring wintry weather to Scotland and isolated snowy showers further south, triggered by air rising over the local orography. 

An Am case study. 

Polar continental (Pc) air will also be cold to start with and get progressively warmer as it moves south, so you would also expect convection. However, the air will be very dry as it passes over continental Europe, so little cloud will form. The UK is a set of islands though and to reach us, the air must pass over the North Sea, picking up water vapour as it does so. The cloud and precipitation (typically snow in winter) it brings therefore primarily affect the east coast. The longer the path it takes over the North Sea, the more precipitation there will be. 

This satellite image is typical for Pc air – you can see the cloud free areas immediately to the west of the land masses, with cloud forming further east (ignore the front to the west of the UK and Ireland).

Another Pc case study

Of course, the characteristics of the air masses can be very different in the summer and the winter. Siberia, for example, is extremely cold in winter but relatively warm in summer – so a polar continental air mass can bring us bitterly cold weather and heavy snowfall (for eastern counties) in the winter, but much warmer weather in the summer.

The processes at work in Tropical maritime (Tm) air are a bit different. This is warm air, which is being cooled from below as it moves north. You therefore wouldn’t expect any convection with air rising, cooling and forming cloud. However, the air is being cooled just by moving north and so eventually may reach the temperature at which cloud forms – flat, featureless sheets of stratus cloud because, on the whole, the air is staying at the same level.

As it is maritime air, there is plenty of water vapour available to form cloud droplets. The processes which give us big, fat raindrops are mainly associated with the vertical air motion and circulations in cumulus clouds. So Tm air at best gives a persistent drizzle.

The satellite image below shows the extensive sheet of stratus cloud over the Atlantic associated with Tm air.

We rarely experience Tropical continental (Tc) air – air that flows up from the Sahara over continental Europe.  This is the warmest and driest air we can get – any moisture picked up over the Mediterranean will be rained out before it reaches us.

Tc air gives clear skies, as you can see in the satellite image below – again ignore the front to the west of the UK. In the summer, this can mean that some areas get particularly warm – maybe because of their colour (dark) or aspect (facing the Sun) – giving rise to late afternoon localised thunderstorms

A front is where two air masses meet. In the UK, the weather fronts associated with depressions usually separate polar and tropical maritime air.

If there is a front, then different parts of the UK can be experiencing different air masses. The weather on the fronts themselves is more extreme. 

Look out of the window now – what cloud types can you see? Does that tell you anything about where the air is coming from? You can have a look at earth.nullschool to see if you are right.


Categories
Climate Change Extreme weather Geography Secondary

New Teaching Resource – Salt Marsh Evidence

We have just added a new resource to our Weather and Climate: a Teachers’ Guide collection in the Changing UK Climate section. 

The resource provides students with source material, graphs and maps to allow them to make a poster explaining how salt marshes can protect coastal areas from the impact of rising sea levels. 

Steart Marshes – designed for adaptation to climate change.

Categories
CPD Geography Teaching

Welsh Translation of Teachers’ Guide

welsh weather and climate

We are delighted to have been supported by the WJEC/ Eduqas, who have translated our Weather and Climate Teachers’ Guide for 11-14+ geography teaching into Welsh – Tywydd a Hinsawdd: Canllaw i Athrawon and made it available to schools for teaching across Wales. 

The full resource, together with background information for teachers and lesson resources can be found on MetLink

Categories
CPD

Free Online Weather CPD for teachers

rain or shine courseWe are delighted to announce that the 15th run of our very popular, free, online weather and climate subject knowledge course for geography teachers (A  level students and anyone else with an interest in the weather), Come Rain or Shine, starts today, 7th June 2021. The first 3 weeks are supported by mentors – so if you have any questions they will be seen and answered. 

This run of the course will also link to the Reading University Weather Forecasting Game

Access to the course is free for 5 weeks from whenever you start it – plenty of time to download all the resources. The course will now be always available, so if you miss the mentored period in June, you can always look at the comments and answers that others posted. 

The course will take roughly 12 hours in total to complete.

Learning Objectives of the course:

  • Interpret synoptic charts and use them to describe weather details such as wind speed and direction, precipitation and cloud cover.
  • Explore depressions and discover why they are so significant in mid-latitude locations such as the UK
  • Investigate the physical processes behind weather, such as warm air rising, cloud formation and the Coriolis effect with experiments you can do at home.
  • Record your local weather conditions and share your findings.
  • Reflect on the processes that affect the Earth’s atmosphere and therefore climate, both natural (volcanoes, orbit) and man-made (greenhouse gases).
  • Apply your understanding of mid-latitude weather systems to analyse weather data and images.
Categories
Careers Weather

Weather Forecasting Game

Try your hand at weather forecasting – can you beat the experts from University of Reading and beyond?

Calling all weather enthusiasts and wannabe forecasters! Following its successful launch to the public last summer, The Weather Game, run by the University of Reading is returning for another friendly competition round.

The game offers entrants the chance to try and predict the weather around the world and close to home. Points are awarded for correct weekly forecasts over six weeks, allowing people to take on their friends and try to beat the experts to top the league.

This activity gives school pupils and weather fanatics a glimpse at the science used on television forecasts or to monitor impacts of climate change. A number of high-profile TV weather forecasters like Laura Tobin and Tomasz Schafernaker made some of their first forecasts while they were students at Reading.

Forecasts from leading sources like the Met Office and BBC Weather can be used as a basis for predictions, but players are encouraged to follow their own intuition on where weather might differ from what is expected. For example, if changeable weather is certain or there is only a small chance of showers, going against the expert forecasts for sunshine and rain might earn you the points.

Entrants will make predictions on the temperature, precipitation and sunshine hours for three fixed locations: Reading, UK; Toronto, Canada; Hong Kong, China and also for another city that changes weekly. While travel is off the cards for most of us this year, experiencing the weather is something that connects us all.

Registration opens from Monday 7 June with entries due each Friday for six weeks at 19:00 London time.

Categories
Fieldwork

Instrument Loans Restart

We are delighted to announce that, from May half term 2021, we will be able to restart our instrument loan scheme for schools. 

We are not able to take any more bookings for the summer term, but have availability of primary, secondary and sixth form kits for the 2021/ 2022 academic year. 


anemometer in fieldwork
Categories
Climate Change Rain Secondary

Exploring Amazon Rainfall data

deforestation

We are delighted to have worked together with the RGS to produce a resource for A Level geography students, using key data skills to investigate the impact of Amazon deforestation on rainfall. 

The worksheet is designed to highlight the importance of meteorology understanding in physical geography. There are activities on the statistical tests of Mann Whitney U-Test and Spearman’s Rank Correlation Coefficient.

Categories
Blog Books Climate Change Science

Three New Climate Change Books

Climate change books

The Society has been given the chance to review three new climate change books aimed at a very similar audience:

Climate Crisis

Climate Crisis for Beginners
Andy Prentice and Eddie Reynolds
Usborne Publishing Ltd, 2020
Hardback £9.99
128pp
ISBN 978-1-4749-7986-3

Summary: a very comprehensive, engaging and current book for upper primary/ lower secondary aged students

“How important is this crisis? Not everyone agrees about this. This book is here to help you make up your own mind.”

With bright, simple illustrations and a cartoon-like style, it is aimed at young people – the recommended age range is 10+. I suspect that it will appeal most to the 10-14 age range, and then again to slightly older people who will not feel patronised by the style but will have interest in the content. My 14 year-old daughter was put off both by ‘for beginners’ and the appearance of the book. Being much older than that, I struggled a bit with the style – I didn’t know which bit to read next.

Andy Prentice and Eddie Reynolds are authors and editors at Usborne and have consulted with Steve Smith (University of Oxford) and Ajay Ghambir (Imperial College, London) in writing this book.  Ed Hawkins (University of Reading) and Richard Betts (University of Exeter) also contributed. There are 5 chapters – The Basics; How sure are we? What do we do? What’s stopping us? And What can I do?

The book manages to walk the tightrope of accuracy v. oversimplification very well. Of course, that balance will never be perfect – for me, for example, it’s missing a discussion of water vapour in the section about greenhouse gases. However, it introduces an impressively broad range of concepts and vocabulary associated with climate science and climate change more generally.

Climate Crisis for Beginners conveys the significance of climate change together with the many and various political and social issues as well as the viewpoints and priorities of individuals. However, for me, the strength of this book lies in the weight it puts on the solutions and opportunities already available. It is not all doom and gloom.

One concern that I do have is just how quickly the book will become out of date – in one or two places it already has.

I asked my 11 year-old daughter to read it – here are some of her thoughts (I have corrected the spelling): “When I first looked at this book, it looked colourful and full of interesting ideas and visions of the future. The information is presented in a fun way with lots of subtitles and boxes so that you can find what you need easily. I like all the different points of view and the reasoning behind the different answers to questions.”

The book concludes “Now that you’ve read this book, you’ve got the tools to imagine the future that you want and an idea of how to start your journey towards it.”

Climate Action

Climate Action: The Future is in our Hands
Georgina Stevens
Illustrator Katie Rewse
Little Tiger Press, 2021
Hardback £19.99
72pp

Summary: A bright, positive reference book for upper primary aged children, focussing on climate change impacts, mitigation and action

“In this book, we share the facts, but we also share hope.

Learn about the causes of climate change and how it is affecting our world.

Explore the human impact and what it means to have a carbon footprint.

Read about creative ideas for tackling the climate crisis.

Be inspired by positive stories from young changemakers around the globe.

Get tips on how to take action and reduce your carbon footprint.”

The recommended age range for this book is 7-12 and the bright, colourful and relatively simple design and illustrations are geared towards the younger end of that age range. Having said that, my daughters, aged 11 and 14 both really enjoyed it, particularly liking the embossed cover. This is a book which is nice to hold – possibly justifying its price which includes the cost of planting a tree. The layout is as a reference book, making extensive use of subtitles, with each double page spread covering one topic, such as greenhouse gases, tropical storms or our clothes. The ratio of text to images is appealing and the text and images are appropriate to the literacy and numeracy skills of the intended age group.

Georgina Stevens is a sustainability writer, advisor and campaigner. In each topic she features a ‘what can we do’ section with small, achievable changes that young people and their families could make. The book also features a number of ‘changemakers’ and ‘groundbreakers’ – young people from around the world who have already developed sustainability initiatives or got involved in the climate change movement. What the book is missing, though, is the big, complex, economic, social and political developments that could have a really significant global impact on greenhouse gas emissions.

I think that the book probably does have a nice balance of science, technology and positivity for the upper primary age range. The science parts of the book aren’t completely accurate – I cringed when the greenhouse effect was described as a reflection of heat, and water vapour is missing from the discussion of greenhouse gases, but it’s probably appropriate for this age range. 

My 11-year old sagely pointed out that the focus of the book is on now – to this age group, the past may feel slightly irrelevant and the future too unknown and intimidating.

Palm Trees at the North Pole, The Hot Truth about Climate Change
Marc ter Horst
Illustrated by Wendy Panders
Greystone Kids, 2021
Hardback £14.99
192pp

Summary: a science book best suited to early secondary school aged students who like reading. Don’t be put off by the title.

“Once upon a time, there were palm trees at the North Pole. Can you picture that? The most tropical of trees in a place where now there is only snow and ice. In the future, they might reappear. Because the climate is constantly changing.”

Firstly, the title. My 11 year-old daughter’s first comment was about the fact that there isn’t any land at the North Pole. Although the book does touch on continental drift, the author never really explains ‘palm trees at the North Pole’ nor justifies the extension to the future and, for anyone inclined to be sceptical about climate science, this is a very easy target. However, the book does merit passing this first hurdle.

The author, Marc ter Horst, has written several other non-fiction titles for young people. His interests in geology and evolution are apparent in the book, a large section of which focusses on the past. This is a book which is designed to be read from cover to cover rather than dipped in to. It is made up of double page case studies linked together in a  fairly simple, frequently light-hearted story-telling style which will appeal to some readers, particularly those who don’t much like reference book style facts and figures. Inevitably the style means that some processes are over-simplified. However, explaining, say, the Milankovitch cycles in story form is an impressive achievement.

The story starts with the early evolution of the Earth and, passing through Keeling curves and hockey sticks progresses to the impacts of climate change. Adaptation and mitigation strategies don’t really start being mentioned until p. 138 and its only after that – if the reader has got that far – that positive opportunities for preventing climate change start being introduced. This is not a book that will help much with the rise of eco-anxiety in young people.

A unique feature is that the book finishes with ‘climate bingo’ and the instruction to cross off events as they happen – with events covering a questionable choice of climate change impacts and mitigation and adaptation strategies.

My daughter thought the illustrations, which are simple and sometimes add to the text but are mostly just decorative, were her favourite part.  Aimed at readers aged 8-12, it is quite text heavy and I think most 8 year-olds would struggle with it.