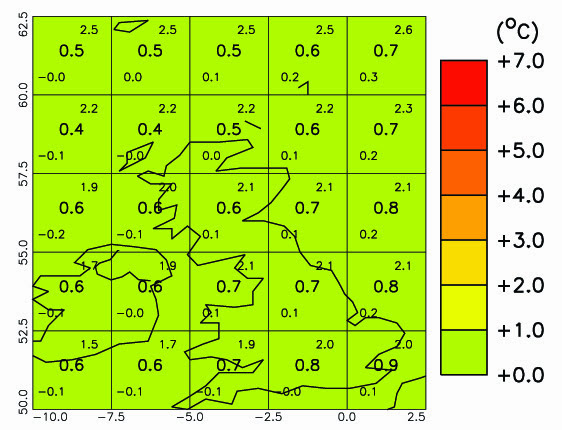
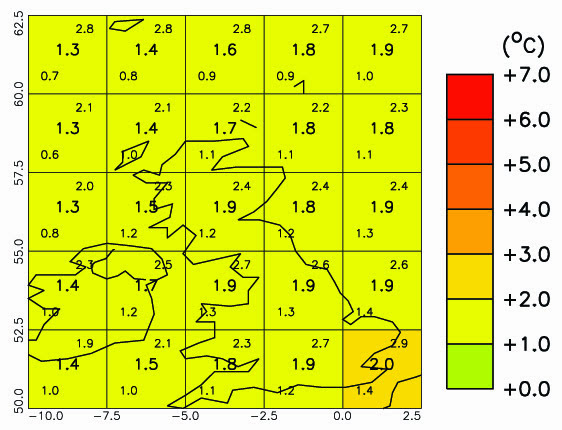
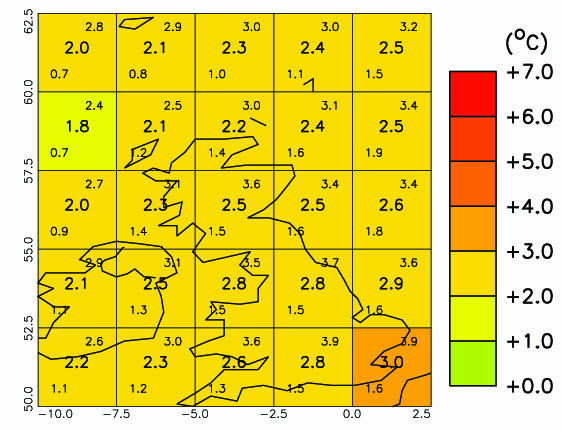
- These 3 maps show projected December, January and February (DJF) temperatures in the 2030s, 60s and 90s (according to a high carbon dioxide emissions scenario, A2).
- All values are anomalies – the difference in temperature to the average of 1970 to 1999 temperatures.
- Areas shaded red will be 6-7°C hotter than average temperatures from 1970 to 1999, whereas areas shaded green will be the same as the 1970-1999 average.
- The number in the centre of each grid box is the average projected temperature; numbers in the upper and lower corners give the highest and lowest possible DJF mean temperature.
McSweeney, C., New, M. and Lizcano, G. (2009) Climate Change Country Profiles – UK. Oxford University School of Geography and Environment and the Tyndall Centre for Climate Change Research. Report commissioned by the British Council, RMetS, RGS-IBG for www.climate4classrooms.org
