Home » Teaching Resources » How will the UK’s Temperature Change Seasonally (Spring)?

How will the UK’s Temperature Change Seasonally (Spring)?

Facebook
Twitter
Pinterest
Print

How will the UK’s Temperature Change During the 2030’s, 60’s and 90’s? Seasonally – March, April and May.

2030
2030
2060
2060
2090
2090
  1. These 3 maps show projected March, April and May (MAM) temperatures in the 2030s, 60s and 90s (according to a high carbon dioxide emission scenario, A2).
  2. All values are anomalies – the difference in temperature to the average of 1970 to 1999 temperatures.
  3. Areas shaded red will be 6-7°C hotter than average temperatures from 1970 to 1999, whereas areas shaded green will be about the same as the 1970-1999 average.
  4. The number in the centre of each grid box is the average MAM temperature anomaly we expect having had high carbon dioxide emissions; the smaller numbers in the upper and lower corners give the range of average temperature anomalies that might occur.
  5. We use the term MAM rather than spring because most climate change maps are for the whole globe and seasons are reversed in the northern and southern hemispheres.

McSweeney, C., New, M. and Lizcano, G. (2009) Climate Change Country Profiles – UK. Oxford University School of Geography and Environment and the Tyndall Centre for Climate Change Research. Report commissioned by the British Council, RMetS, RGS-IBG for www.climate4classrooms.org
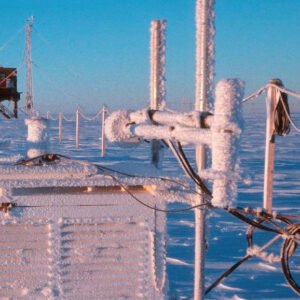
Start exploring

Latest from blog

Related resources …
REPRESENTATION OF FLOW AROUND A LOW PRESSURE AREA.

In Depth – The Coriolis Effect

As air blows from high to low pressure in the atmosphere, the Coriolis force diverts the air so that it follows the pressure contours. In the Northern Hemisphere, this means that air is blown around low pressure in an anticlockwise direction and around high pressure in a clockwise direction.
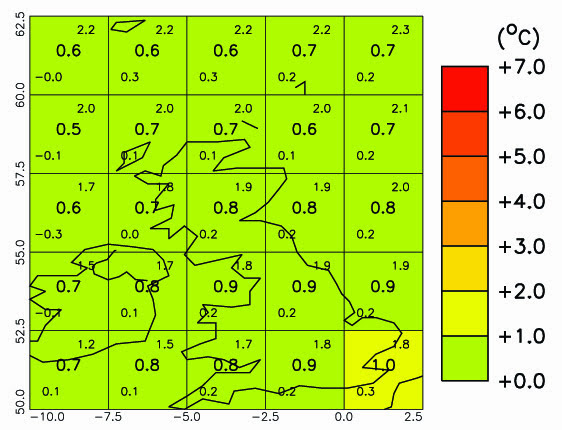
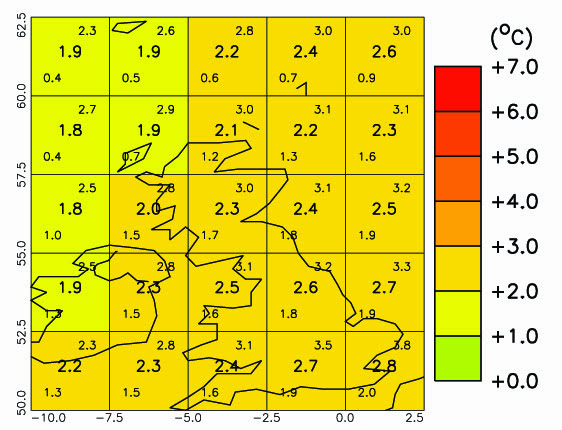
Read More »