What is an urban heat island?
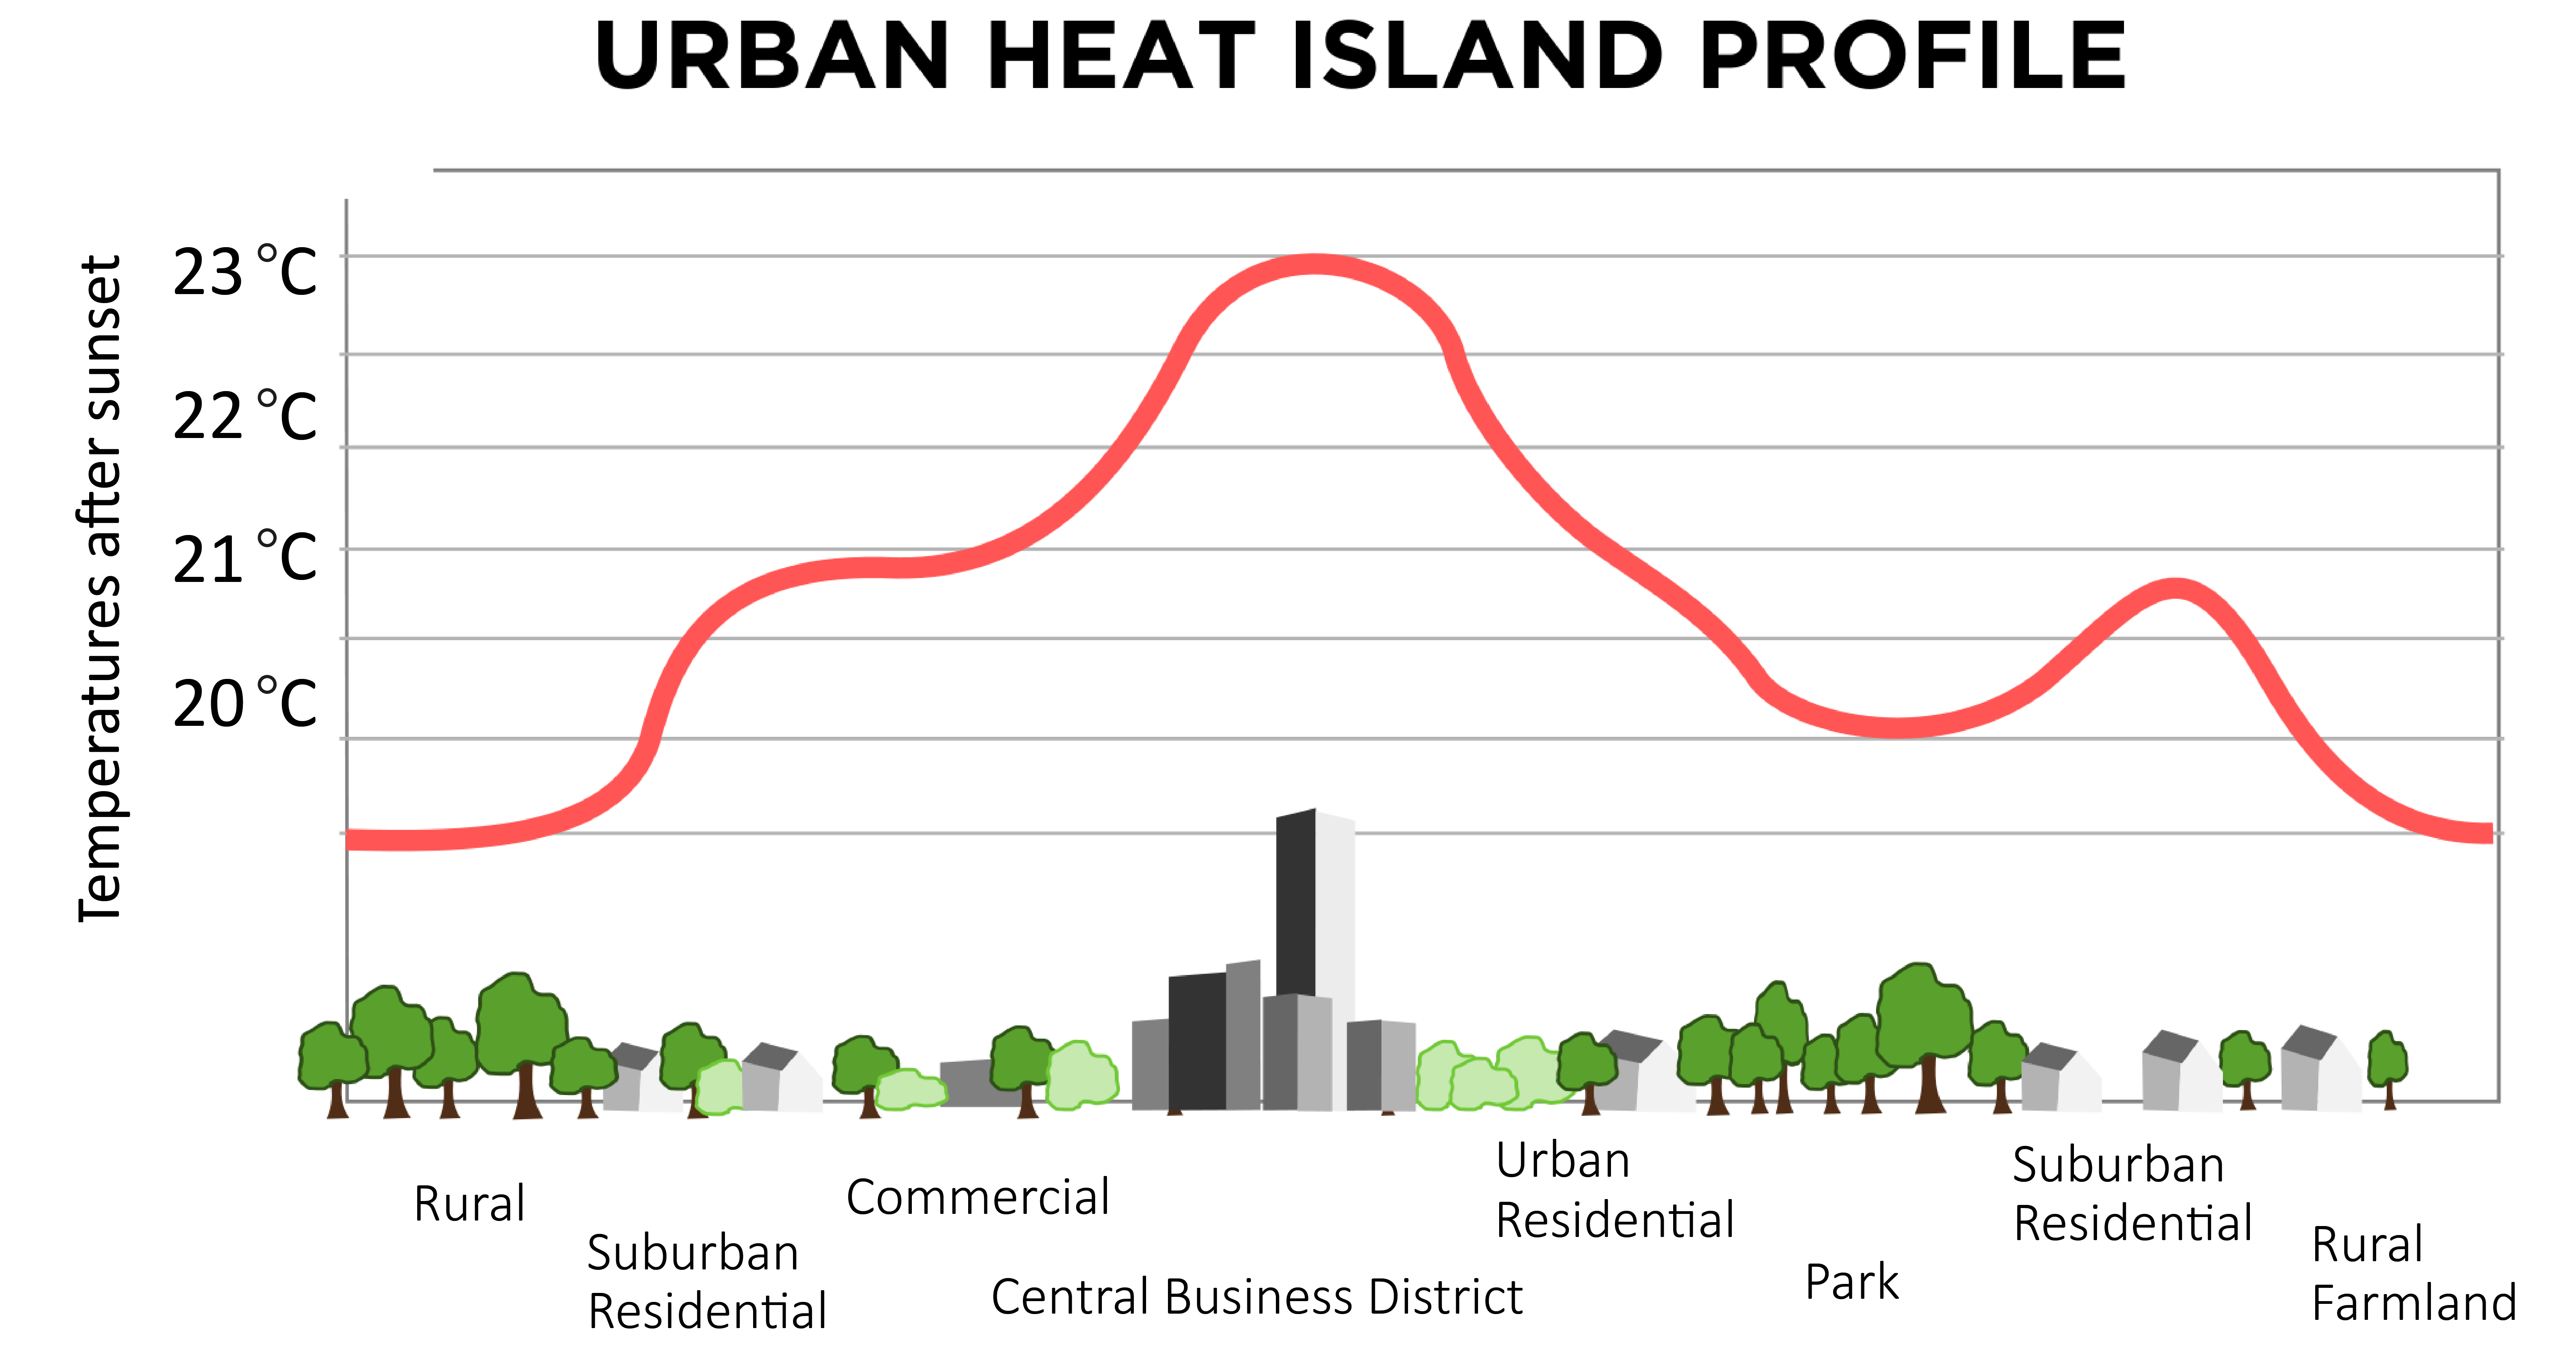
An urban heat island is a metropolitan area which is significantly warmer than its surrounding rural areas. The temperature difference is usually larger at night than during the day, and is most obvious when winds are weak. One of the main causes of the urban heat island is the fact that there is little bare earth and vegetation in urban areas. This means that less energy is used up evaporating water, that less of the Sun’s energy is reflected and that more heat is stored by buildings and the ground in urban than in rural areas. The heat generated by heating, cooling, transport and other energy uses also contributes, particularly in winter, as does the complex three dimensional structure of the urban landscape.
What effects do urban heat islands have on measurements of climate change?
Although most of the really long temperature records available to meteorologists come from in or near urban areas, the weather stations tend to be found in parks and open spaces which are less affected by changes in urbanisation. One study has attempted to see how much the urban heat island effect has affected long temperature records, by comparing the temperatures recorded on calm nights (big urban heat island effect) with those recorded on windy nights (less urban heat island effect) – this suggested that the long temperature records were not affected by the urban heat island effect. In other words, any long term trends in temperature seen in the records were probably the same as if they had been recorded in a rural area. In the last few decades, data from satellites has been added to the records available to meteorologists. The IPCC concluded in their 2007 climate change report:

“Recent studies confirm that effects of urbanisation and land use change on the global temperature record are negligible (less than 0.006°C per decade over land and zero over the ocean) as far as hemispheric and continental-scale averages are concerned. All observations are subject to data quality and consistency checks to correct for potential biases. The real but local effects of urban areas are accounted for in the land temperature data sets used [both by excluding as many of the affected sites as possible from the global temperature data and by increasing the error range]. Urbanisation and land use effects are not relevant to the widespread oceanic warming that has been observed. Increasing evidence suggests that urban heat island effects also affect precipitation, cloud and diurnal temperature range.”
As the climate changes, what impacts will there be on urban areas?
Urban areas are particularly vulnerable to changes in the climate, and, as the world becomes increasingly urbanised, more and more people will become vulnerable to changes in climate and extreme weather events. The 2003 heat wave was considered responsible for 14,802 and 2,045 excess deaths in France and England & Wales respectively. Many of these deaths occurred in urban areas because of the combined effect of the heat wave with the urban micro-climate. Heat waves like this are expected to become more common in the future. The summer of 2003, for example, is expected to become `typical’ by the 2050s. A lot of research is currently going into understanding the urban micro-climate, and into finding ways of designing cities and building to minimise the effect of a changing climate – both by reducing the urban heat island, and by finding ways to cool the insides of buildings.
Conversely, urban heat islands can have important consequences for which areas are most badly affected by fuel poverty.

Teaching Resources
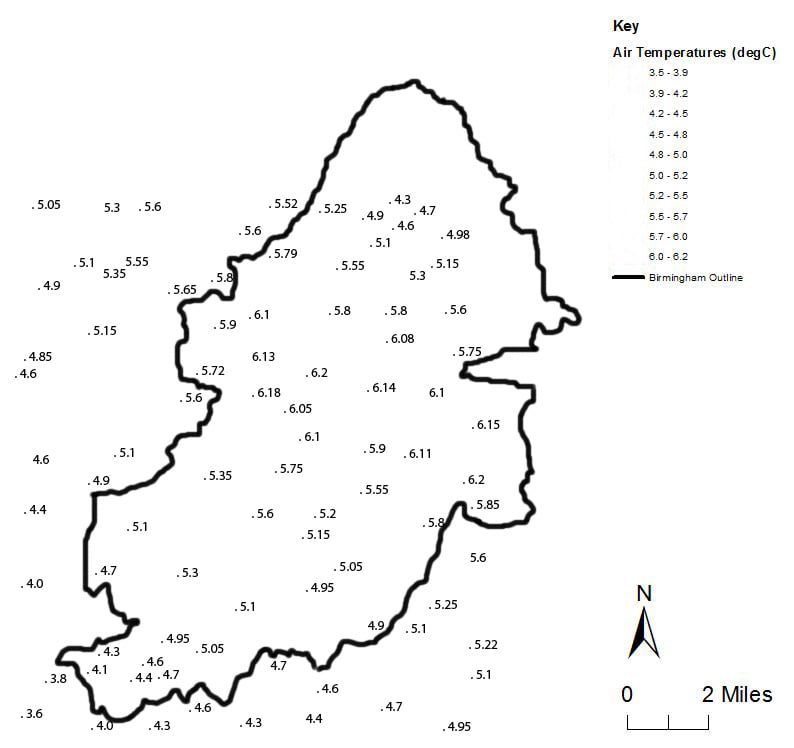
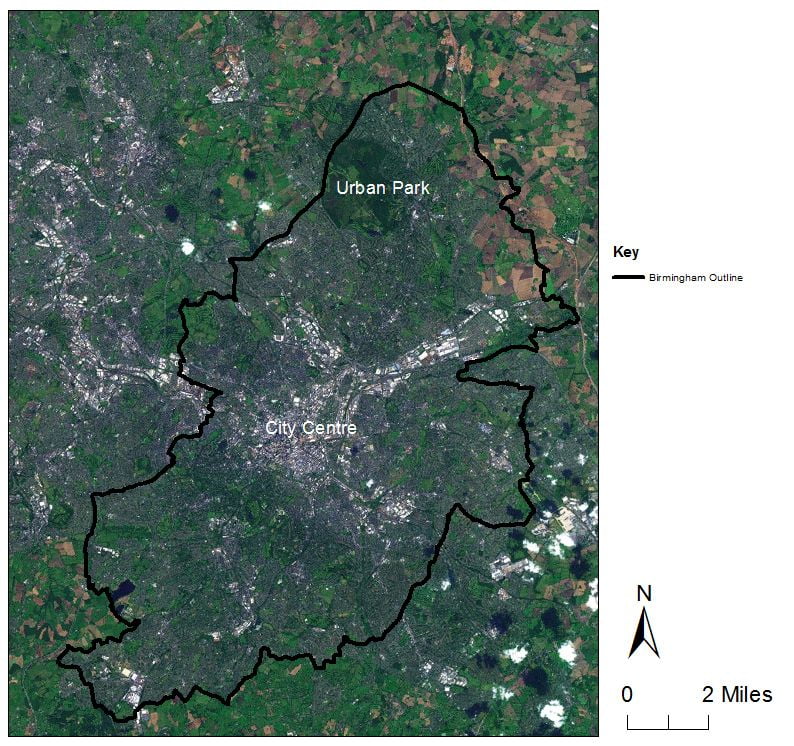
Urban heat island isotherm drawing exercise: notes for teachers, idealised weather station data for isotherm drawing, satellite image of Birmingham and solution for teachers.
UHI Introduction – Teachers Notes
PowerPoint 1 for use with the Teachers Notes
Teachers Notes on using WOW automatic weather station data to look for urban heat islands with corresponding PowerPoint2 for use in the plenary activity.
Urban Heat Island Fieldwork Resource Packs
Borrow instruments and other lesson resources in order to carry out your own class urban heat island fieldwork. More information available here.
Find out more
http://en.wikipedia.org/wiki/Urban_heat_island
the Met Office guide to microclimates, including urban microclimates
Case Studies of Urban Heat Islands
Reading, Berkshire
M. Parry’s 1955 paper on ‘local temperature variations in the Reading area‘
E. Melhuish and M. Pedder’s 1998 paper from Weather on ‘Observing an urban heat island by bicycle‘
Manchester
Mapping Manchester’s Urban Heat Island a 2010 Weather paper by Knight, Smith and Roberts, looking at the results of the Royal Meteorological Society’s urban heat island experiment in Manchester.
Birmingham
Birmingham Urban Heat Island Information a 1980 paper from Weather.
London
2006 London.gov.uk report or as an rtf.
The urban heat island in central London and urban related warming trends in central London since 1900 – a 2010 Weather paper by Jones and Lister.
Past and projected trends in London’s urban heat island a 2003 Weather paper by Wilby.
Urban warming? An analysis of recent trends in London’s heat island a 1992 paper by Lee.
Chicago


