The table below shows information about the annual CO2 emissions from 140 cities.
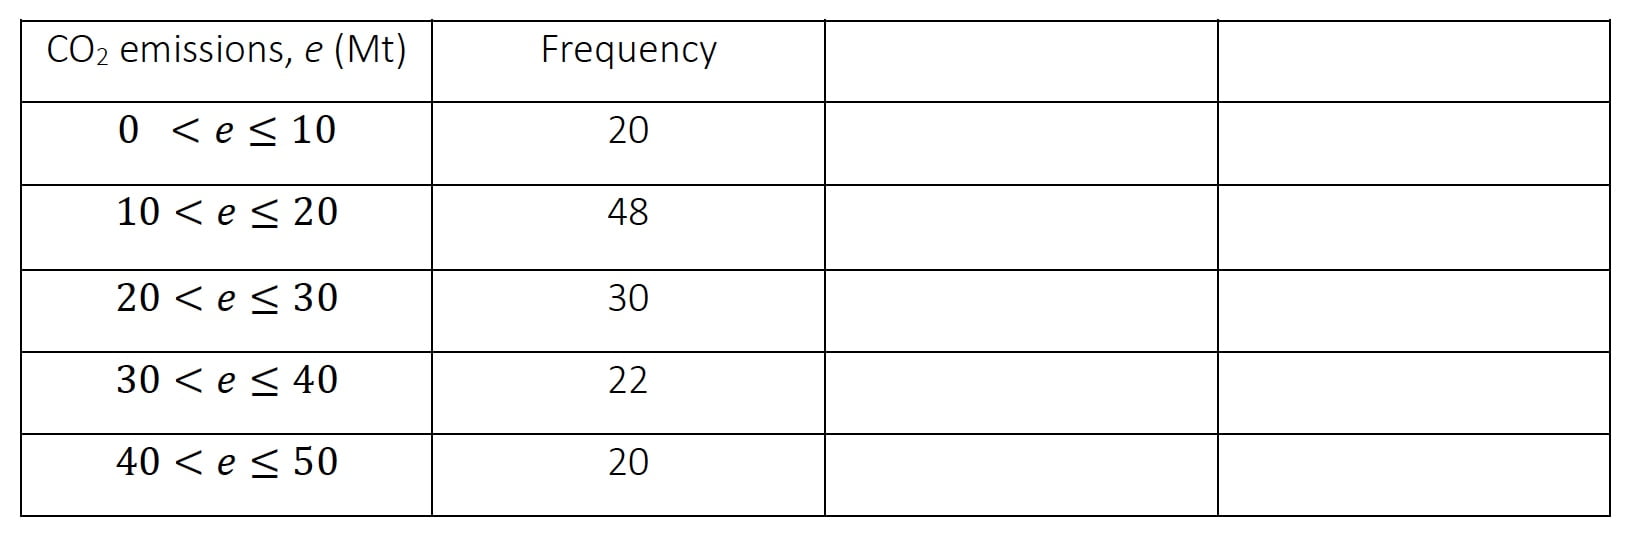
a) Work out an estimate for the mean CO2 emissions across the 140 cities.
[3 marks]
b) Estimate the total amount of CO2 emitted from the 140 cities by using the mean value.
[1 mark]
c) Draw a frequency polygon representing the table.
[3 marks]