As the atmosphere warms, the air holds more water vapour, and this could lead to more intense rainfall events, resulting in an increased flood risk. In this question, assume every year has 365 days.
The graph shows how the average rainfall (in mm/day) on a rain day at Falmer, Sussex, England has varied with time.
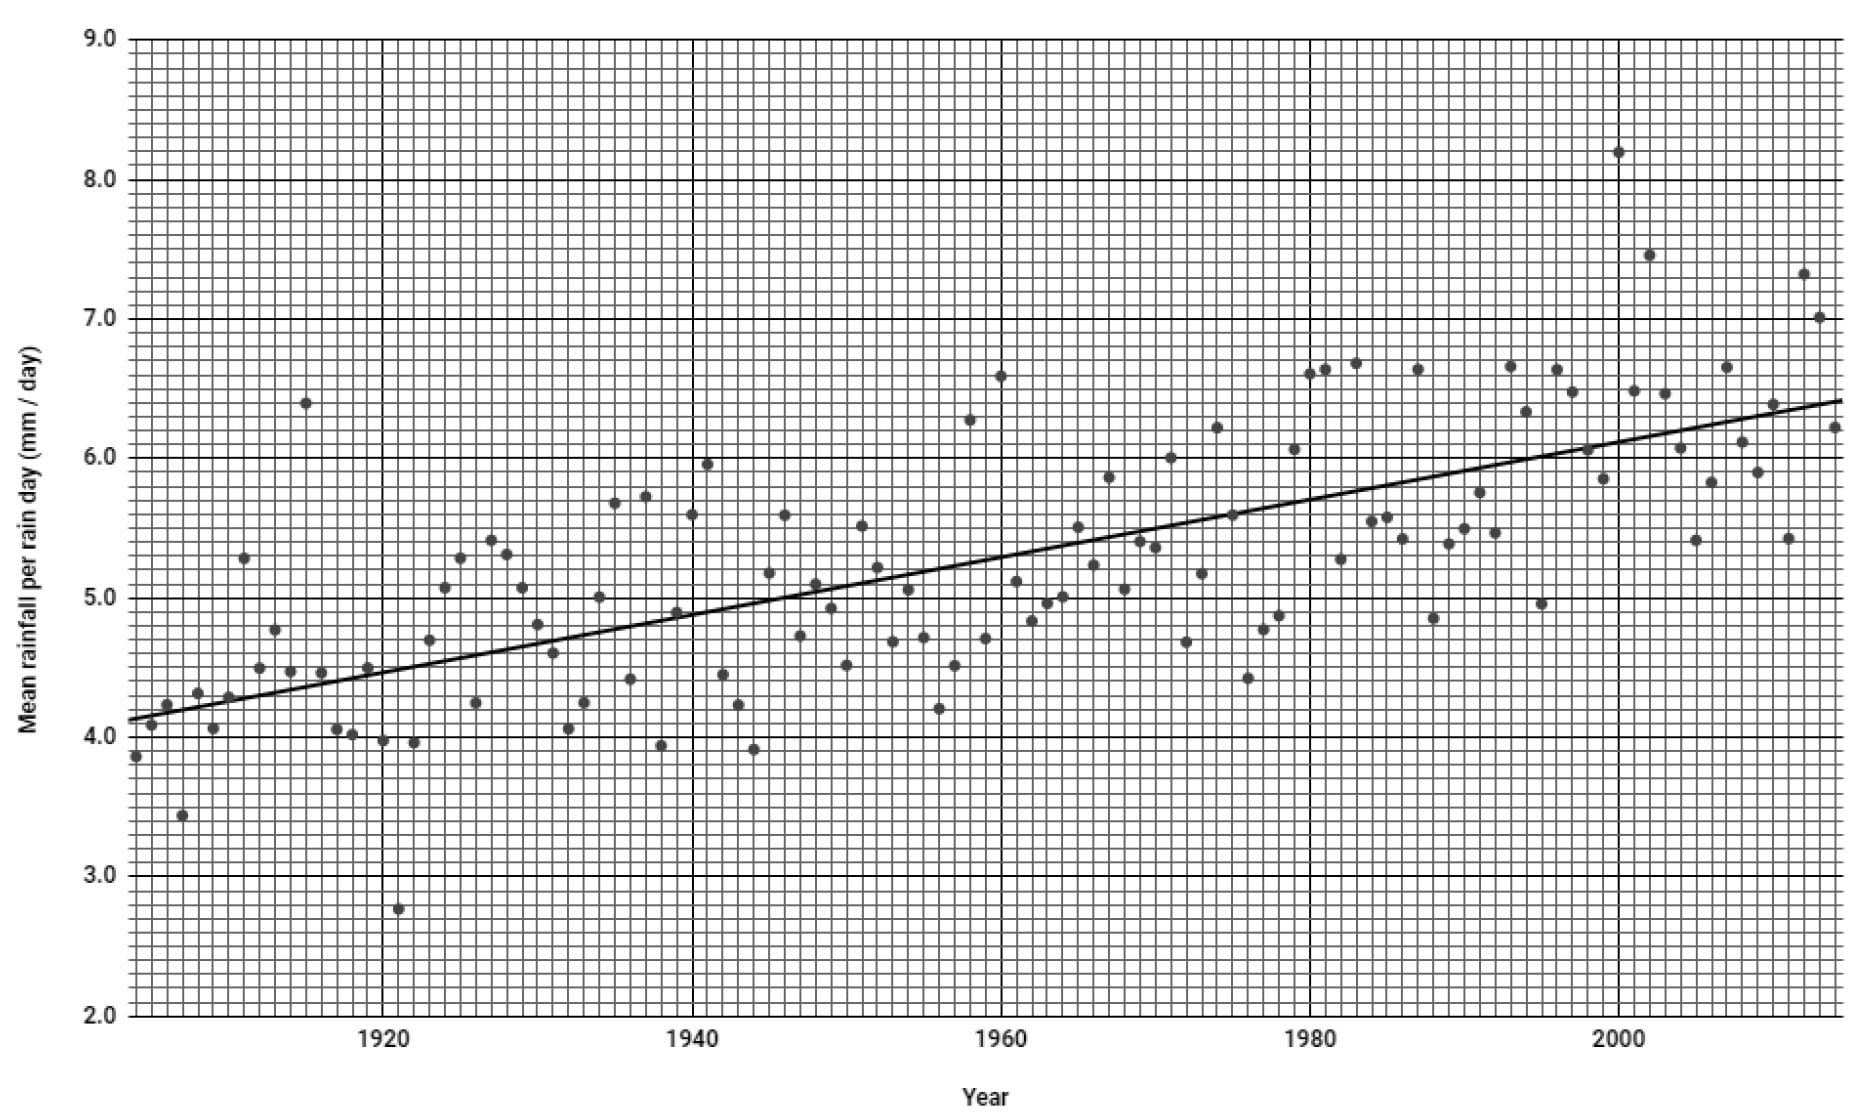
The individual points on the graph show the observed average rainfall in mm/day.
a) What was the observed average rainfall on a rain day in 2000? Give your answer in mm/day.
[1 mark]
b) In an unrealistic model, a student presumes that every day that year was a rain day. Using this information and your answer to (a) find the total amount of rain that fell in that year. Give your answer in metres, to 2 significant figures.
[2 marks]
For the next questions refer to the line of best fit.
c) Calculate the percentage increase in average rainfall between the years 1939 and 1998.
[3 marks]
d) Calculate the percentage increase in the amount of rainfall between the years 1910 and 1920, and the years 2000 and 2010.
[4 Marks]