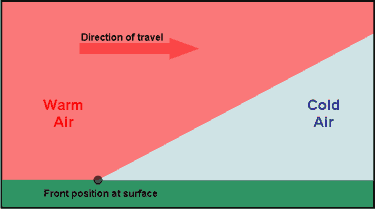
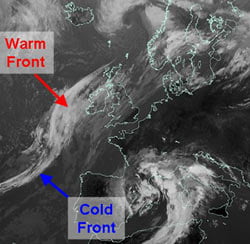
Pressure begins to fall increasingly rapidly as the front approaches and rain usually starts not long before it arrives, becoming heavy for a short time. This is often accompanied by an increase in and a backing of the wind. In some cases, there may also be hail and thunder.
The passage of the front is usually marked by a sharp change from falling to rising pressure and a veer in the wind.
As the rain dies away, the cloud lifts and breaks and, although there is sunshine, the air temperature falls.
After a time, cumulus clouds begin to form, often bringing showers. Sometimes the showers may become heavy, perhaps even accompanied by hail and thunder. On the other hand, in some cases, pressure will rise rapidly after a cold front has passed and this causes there to be few, if any, showers.
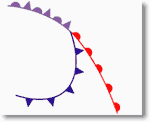
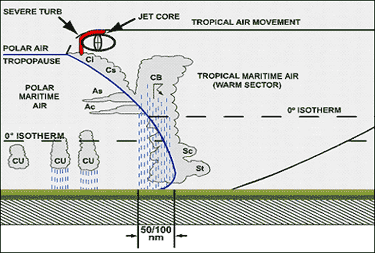
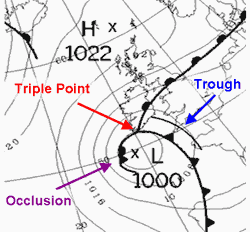
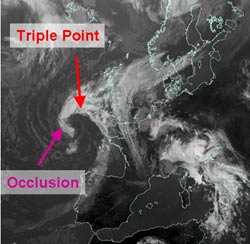
Occluded front or occlusion
Occlusions are slightly more complex than warm or cold fronts. They occur because cold fronts travel more quickly than warm fronts and eventually this results in the cold front ‘catching up’ with the warm front.
This causes the warm air to be undercut and lifted up from the surface.
The characteristics of an occlusion are similar to those of a cold front in that the rain belt is narrow.
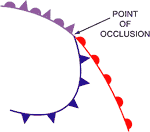
Cloud lifts and breaks after the front has moved through and there may be a change in temperature and a veer in the wind, though these tend to be small.
Stage 4 – Death
Eventually the frontal system dies as all the warm air has been pushed up from the surface and all that remains is cold air. The occlusion dies out as temperatures are similar on both sides of the front.
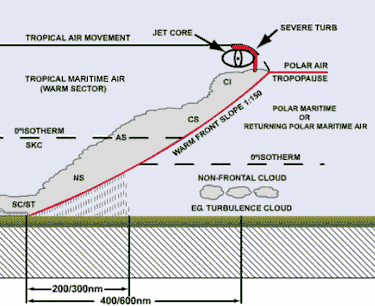
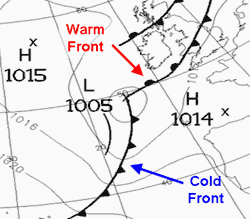
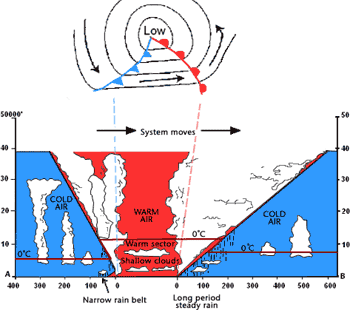
Weather associated with a classic depression
Every depression is different and hence the weather associated with each depression is also unique. However the weather associated with the passage of a classic depression does follow some general trends. Table 1 details the changes associated with the passage of both warm and cold fronts, whilst Figure 14 shows a cross section through a mature depression.
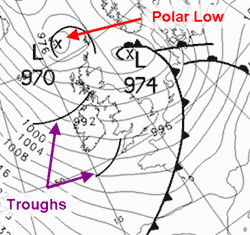
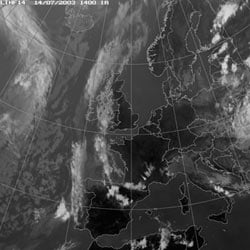
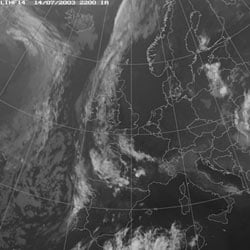
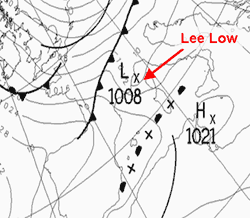
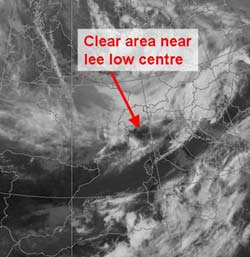
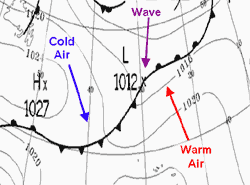
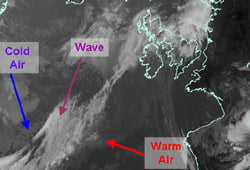
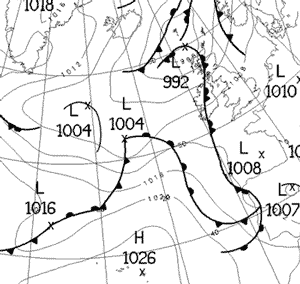
Thundery lows
Thundery lows form over hot land in summer and can produce a large number of thunderstorms. These thunderstorms can also become aligned into troughs, giving spells of particularly intense downpours with hail, occasionally accompanied by tornadoes or waterspouts.
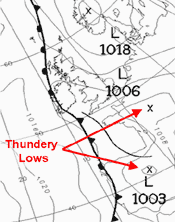
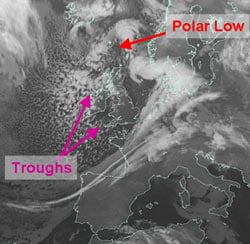
Figure 17 shows an example of thundery lows over France and Spain on a synoptic chart. Figures 18 and 19 show satellite images for the same day, showing the development of thunderstorms during the day.