From January – June 2025 the Royal Meteorological Society (RMetS) again collected data to evidence the climate literacy of school leavers (S4 in Scotland, year 11 in England/ Wales, year 12 in N. Ireland) across the UK. This built on the data collected by the DfE in 2024 (https://www.gov.uk/government/publications/climate-literacy-amongst-school-leavers), which in turn built on the surveys run by the RMetS in 2022 and 2023.
This survey is a very important piece of evidence about the state of climate awareness amongst our young people, as well as the key gaps in the climate education they are currently receiving, at a time when the curriculum is being reviewed, refreshed or developed in all 4 Nations of the UK.
Key differences from the 2024 data were that
- The full set of 55 questions were used in all 4 Nations of the UK. Last year, only the ‘core’ set of 5 questions were used in Scotland and Wales.
- Instead of working with Ipsos to collect data, we recruited schools through our own communication channels as well as those of our partner organisations. As a result, the data was less well sampled and particularly biased towards Independent girls’ schools in England.
The differences in the results we obtained may therefore be because of the greater representation of students particularly from Scotland, less representative data or changes over time. However, we would not yet expect to see curriculum changes (e.g. in Wales) over the last few years to be reflected in the data we have collected.
Unfortunately, no usable data was collected from Northern Ireland.
National differences may reflect differences in curricula but can also be influenced by local issues, priorities and communication.
Students in England are more likely to remember having learned about climate change in the previous two years of education (65%), than those in Scotland or Wales (45%), who may not have learned about climate change since primary school.

We saw a dramatic increase in the number of students correctly identifying the meaning of ‘Net Zero’ from 10% in 2024 to 46% in 2025, albeit with national differences – although 54% of respondents in England could select the correct answer, only 33% could in Wales. This is a phrase which is in widespread use, by politicians, schools and employers, and an improvement in understanding may be due to improved coverage by the media.
We found an increase in the number of students reporting concern about climate change with 23% of respondents said they are ‘very’ concerned this year, compared to 12% in 2024 and similar values in England, Scotland and Wales. In contrast to last year, more students report being concerned about climate change than not concerned. As in other studies, we see a larger number of girls reporting that they are ‘very’ or ‘fairly’ concerned about climate change.
Unsurprisingly, there remains a correlation between those school leavers who think that climate change will affect them directly and those who are concerned about climate change.
In designing climate education and communication strategies, we rightly consider the need to avoid developing climate anxiety but we should make sure that our focus is on making young people ‘concerned and hopeful’ as only this will lead to effective individual and collective climate action.

One important way to do this is through demonstrating the relevance of climate change to young people, their communities and careers. However, the data collected in the survey shows continuing very low awareness of climate change in the UK, including projected impacts as well as adaptation and mitigation strategies already in place or needed.
Related to this, there was low awareness of the extent of existing renewable energy production in the UK. This will be directly relevant to school leavers’ awareness of the green careers and wider climate action available to them. Students in Scotland, which has the highest number of on-shore wind turbines in the UK, are more likely to recognise that wind power is being used to generate a lot of electricity than in England, whereas students in England are more likely to recognise solar power.
Over 75% of students still do not appreciate that future global warming can still be limited or avoided, highlighting an opportunity for increasing ‘hope’ in climate action amongst young people, again missing messages about hope and green careers.
Some specific issues related to current curricula and the siloing of climate change in geography were highlighted by the survey. For example, respondents had poor awareness of the fact that the expansion of water as it warms has contributed roughly as much to sea level rise as the melting of ice. This argues for the need for a curriculum which encourages the application of knowledge and understanding (in this case, learning in science that liquids expand when they are heated) to real world contexts (sea level rise). Another example relates to the fact that only 55% of students recognised that respiration was a source of carbon dioxide, suggesting that many could not relate learning about organisms to the wider global carbon cycle.
Another example relates to the current KS3/ 4 geography curriculum in England where the disproportionate amount of time devoted to teaching past climate change and in particular the Milankovitch cycles seems to have led to respondents overestimating the impact of natural forcing mechanisms on recent climate change. For the first time, we have enough data to compare responses between Nations. Students in England were least likely to recognise that over 80% of warming since the Industrial Revolution has been caused by humans (24% in England, 28% in Scotland, 33% in Wales). Students in England were also most likely to say that sunspots could affect the temperature of the Earth ‘a lot’ (24% in England, 11% in Scotland) and that changes in the Earth’s orbit around the Sun could affect the temperature of the Earth ‘a lot’ (58% in England, 37% in Scotland).

The number of students correctly identifying that the vast majority (over 97%) of scientists agree about the causes of climate has increased substantially from last year (37% from 22%), although most respondents still think scientific consensus is significantly lower than it actually is. This potentially relates to the use of the ‘evaluate’ command word in geography assessments (most frequently seen in N Ireland and England), which necessitates students to present arguments from both sides even if, in reality, the debate is essentially one sided. Students in Wales were least likely to recognise scientific consensus.

However, reassuringly, the responses indicated that students place a relatively high level of trust in their science and geography teachers as sources of climate change information. This reinforces the need for teachers to have the time and support to keep their own subject knowledge up to date and relevant.

There remains poor understanding and awareness of adaptation and mitigation strategies generally, and in particular of effective ways to reduce climate change. The impacts of keeping pets and eating meat on greenhouse gas emissions are generally underestimated whereas the impact of switching lights off and recycling (from the point of view of greenhouse gas emissions) is overestimated. This potentially reflects the impact of decades of teaching the ‘easier to handle’ aspects of sustainability, particularly in primary schools and highlights misconceptions about the efficacy of personal actions and their contribution to GHG emissions. This relates to the common focus in schools on personal carbon footprints rather than those of goods, services and organisations. A focus on personal carbon footprints can generate feelings of guilt, lack of agency, or disengagement whilst, as we have highlighted, focussing on actions which in practice have little impact on greenhouse gas emissions. There was particularly low awareness of nature-based solutions to climate change.
Climate justice recognises the fact that the people and countries most vulnerable to climate change are often not the ones who have done the most to cause it. Respondents indicated a good awareness of which countries are currently emitting most greenhouse gas, but less awareness of per capita or historical emissions. Similarly, there was limited understanding of regional variations in future temperature changes and their impacts. This may be evidence of a ‘case study’ approach to teaching in geography, with focus on one or two countries without putting them in context with our own country, or the global whole. Knowledge rich understanding should develop learning which can be applied beyond the specific case studies or examples considered in assessment specifications.
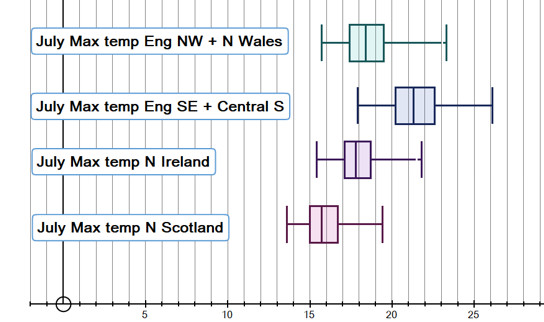
One clear message that has emerged from the survey every year, is how poorly the 1.5°C/ 2°C key climate goals are understood. This year, only 15% of students could correctly identify the meaning of the goal (a similar proportion to last year). When asked how much the Earth has warmed since the pre-industrial period, although very few (17%) selected the correct answer, 1.1-1.4°C, we saw a shift in the mode from 2.7°C -2.8°C in 2024, to 1.5°C-1.6°C in 2025 with also far fewer students selecting that they did not know the answer. Students in Scotland were more likely to overestimate current global warming or responded that they did not know the answer.