Broad General Education (BGE)
Fourth Level: People, Place and the Environment
I can demonstrate an understanding of weather and climate by explaining the relationship between weather and air pressure.
- Explains links between weather and air pressure
A data based resource looking at rainfall and pressure: Worksheet below and Teachers Notes.
Alternative resource: Red sky at Night, Shepherd’s Delight worksheet and Teacher’s Notes – a resource looking at how our prevailing wind direction means this saying is largely true.
Name: Date:
Investigating the Link Between Between Pressure and Rainfall
Here is some data collected by a weather station on the outskirts of Edinburgh, at the start of 2019.
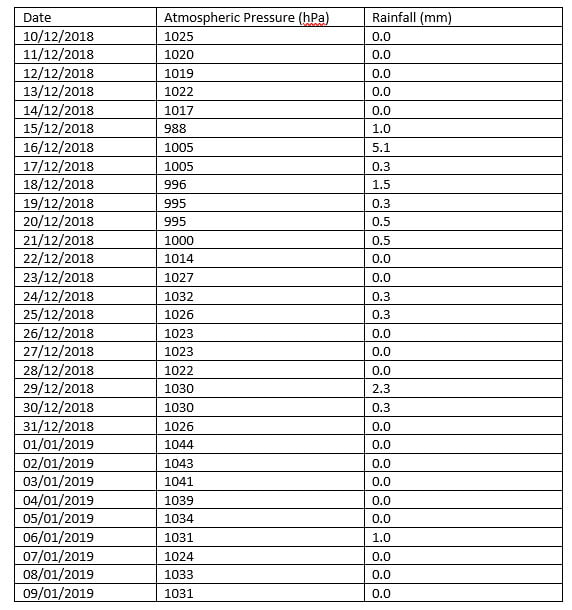
Using this data, draw a graph of rainfall against pressure.
Now use this information to complete the following sentences:
The most it rained in one day was _______________mm.
It didn’t rain at all on ____________ days.
The highest pressure recorded was ______________hPa (a hPa is the same as a millibar).
The lowest pressure recorded was _______________hPa.
Does it always rain when the pressure is low? Use figures to justify your answer.
____________________________________________________________________________________________________________________________________________________________________________________________________________________________________________________________________________________________________________________________________________________________________________________________
Does it ever rain when the pressure is high? Use figures to justify your answer.
____________________________________________________________________________________________________________________________________________________________________________________________________________________________________________________________________________________________________________________________________________________________________________________________
Many weather apps assume that if the pressure is low, it will rain. Does your graph justify this assumption?
_____________________________________________________________________________________________________________________________________________________________________________________________________________________________________________________________________________________________
Extension:
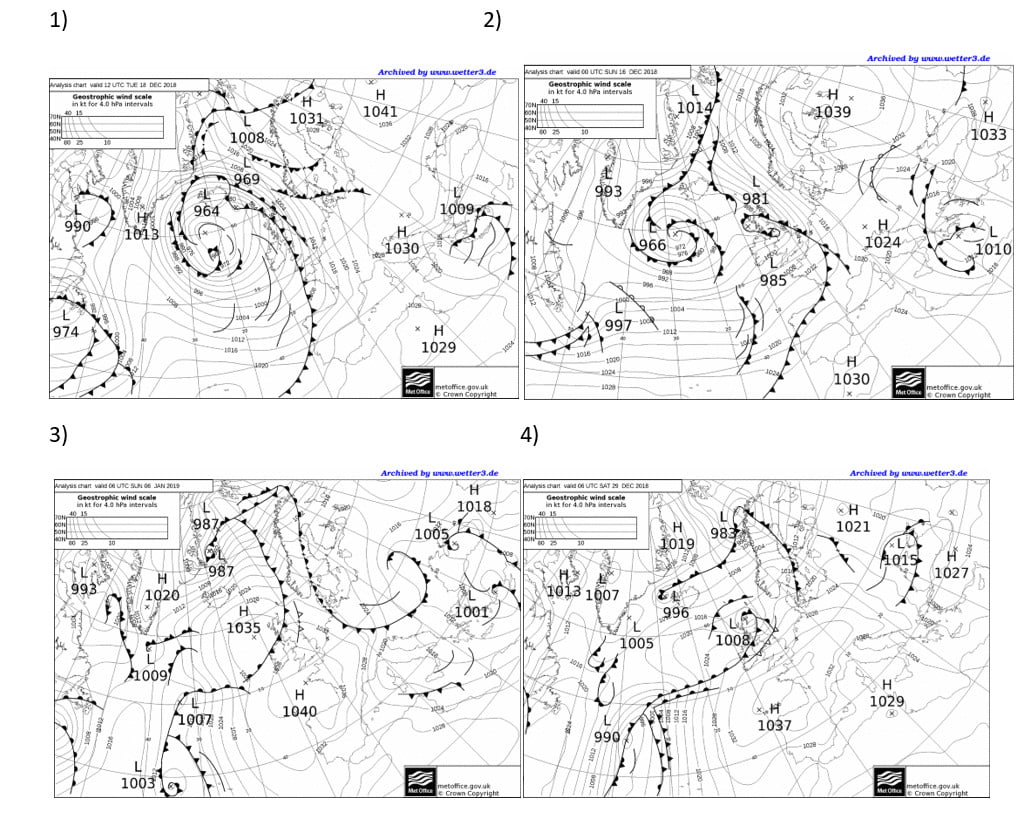
Here are the weather maps for 4 of the days when it rained: the first 3 show when the pressure was low and the 4th shows when the pressure was high and it rained.