
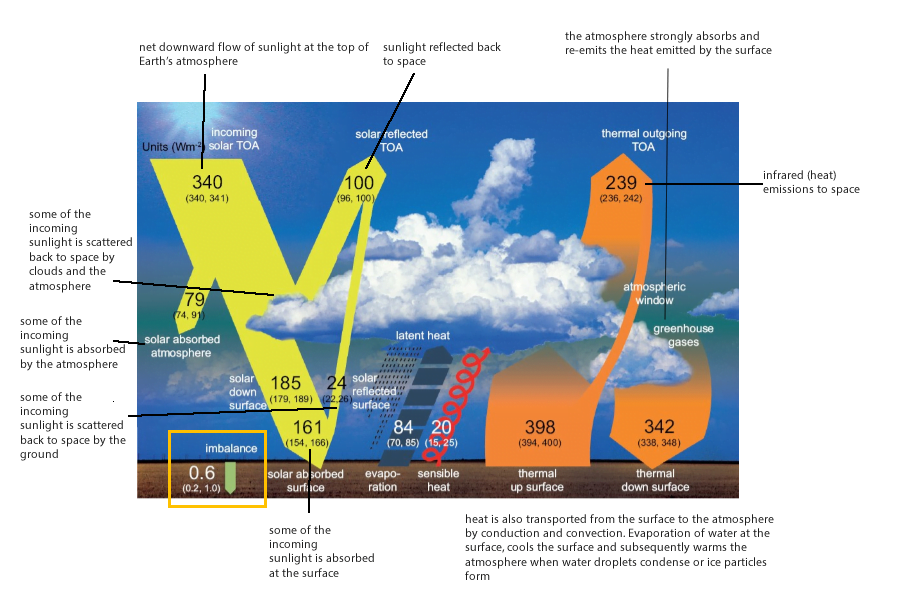
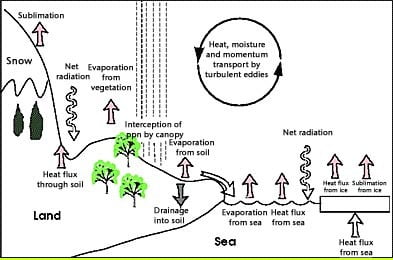
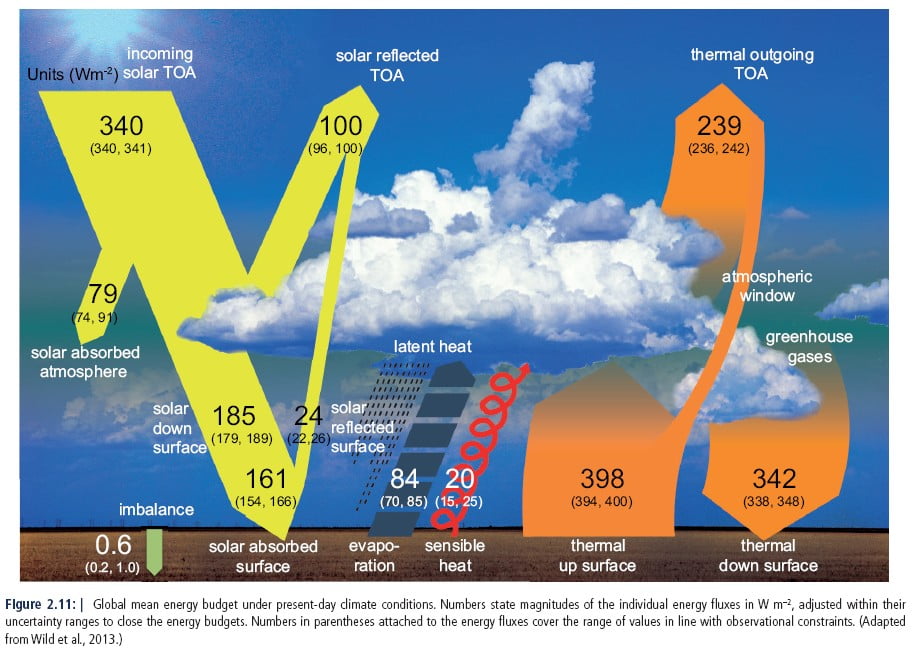
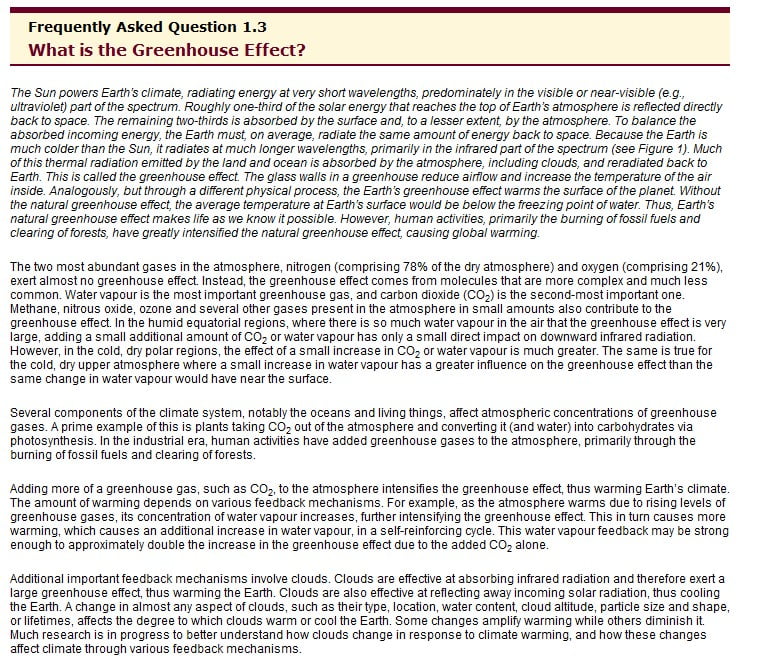
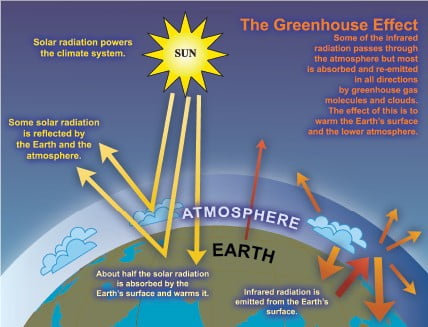
The current Global annual average flows of electromagnetic and other energy. The numbers show the movement of energy in W/m2 (Watts per m2) and their uncertainty (in brackets). The incoming sunlight (solar energy) at the Top Of the earth’s Atmosphere (TOA) is 340 W/m2, some of which is scattered back to space by clouds, the atmosphere or the surface (100 W/m2). The rest is absorbed within the atmosphere and at the surface. The amount of energy absorbed by the surface determines its temperature (currently around 15 oC), which in turn determines the type (thermal) and amount (398 W/m2) of energy emitted by the surface. Water at the surface evaporates, which requires energy, and moves into the atmosphere, where it condenses into water droplets or forms ice crystals, releasing latent heat energy. This transports energy from the surface into the atmosphere. Conduction and convection also move heat from the surface to the atmosphere. Most of the infra-red energy emitted by the surface is absorbed and re-emitted by gases in the atmosphere rather than escaping to space. The infra-red energy emitted to space (239 W/m2) together with the reflected solar energy approximately balances the incoming solar energy.
Since the last IPCC report, new space-borne instruments have begun collecting data, recording the energy exchanges between the Sun, Earth and Space. This has improved the accuracy of the information available to scientists. While it might be expected that it would be easier to make measurements of the movement of energy at the surface, it is the energy exchanges at the top of the atmosphere which are better known. They are measured directly by satellite sensors whereas surface measurements rely on instruments that are not spread evenly across the globe. Using information about cloud heights from space-borne radar and lidar instruments has allowed new estimates to be made of the thermal infrared radiation which reaches the surface.
Since 1950 the amount of solar radiation reaching the surface has been changing. Until the 1980s it was decreasing (dimming) because of an increase in atmospheric pollutants called aerosols. An aerosol is a colloid of either a solid or a liquid suspended in air and some of these cause the atmosphere to scatter sunlight back to space and can also can make clouds more reflective by increasing the number of water droplets in the clouds, which also increases the amount of sunlight reflected. Since then, national and international legislation has reduced the amount of aerosols which has increased the amount of solar radiation reaching the surface (brightening).
Human activities are affecting the Earth’s energy balance by;
- changing the emissions and resulting atmospheric concentrations of greenhouse gases, such as carbon dioxide, which reduce the amount of infra-red radiation which escapes to space (the Greenhouse effect),
- changing the emissions and resulting atmospheric concentrations of aerosols which reflect and absorb the sun’s radiation,
- changing land surface properties, which affects reflection, conduction and evaporation, by e.g. deforestation and increased urbanisation.
The result of these activities is that the sum of the energy leaving the top of the atmosphere is less (239+100 W/m2) than the energy entering it (340 W/m2). The imbalance is estimated to be about 0.6 W/m2. Most of this excess energy is absorbed at the surface (mainly by the oceans), as shown by the orange box, causing the observed increase in temperatures in the lower atmosphere and oceans.
| Summary:There is more energy entering the top of the atmosphere than is leaving it. This energy needs to go somewhere and most is causing a rise in temperature in the oceans and the atmosphere above. The warming is very likely to be caused by human activities such as the increase in carbon dioxide and other pollutants. |
IPCC links
This is figure 2.11 from the WG1 report of the 2013 IPCC 5AR.
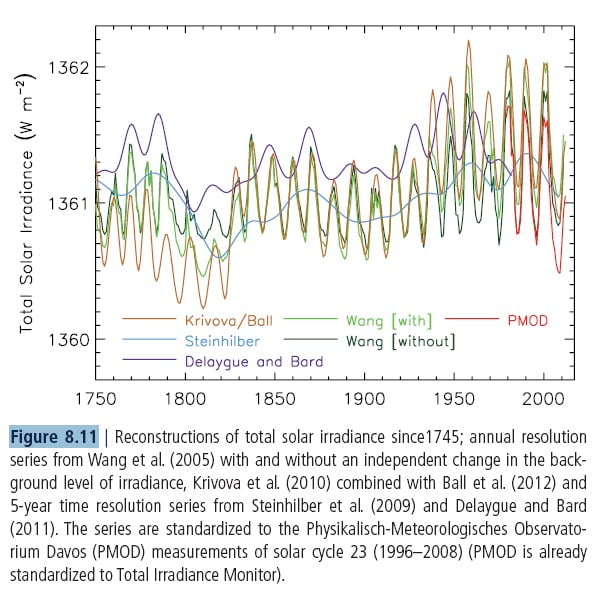
WG1 Figure 8.11 shows reconstructions of total solar irradiance since 1745.
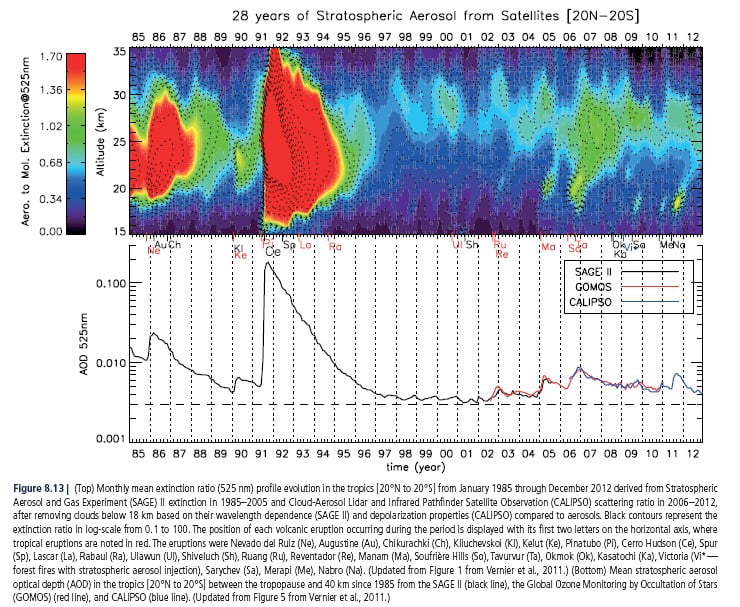
WG1 Figure 8.13 shows the amount of aerosol in the stratosphere from volcanoes in the period 1984-2012.
WG1 FAQ 5.1 Is the Sun a major driver of recent changes in climate?
WG1 FAQ 7.1 How do clouds affect climate and climate change?
WG1 FAQ 7.2 How do aerosols affect climate and climate change?
WG1 FAQ 10.1 Climate is always changing. How do we determine the causes of observed changes?
From AR4:
FAQ 1.3 What is the Greenhouse Effect? With FAQ 1.3 Figure 1
2)The Carbon Cycle
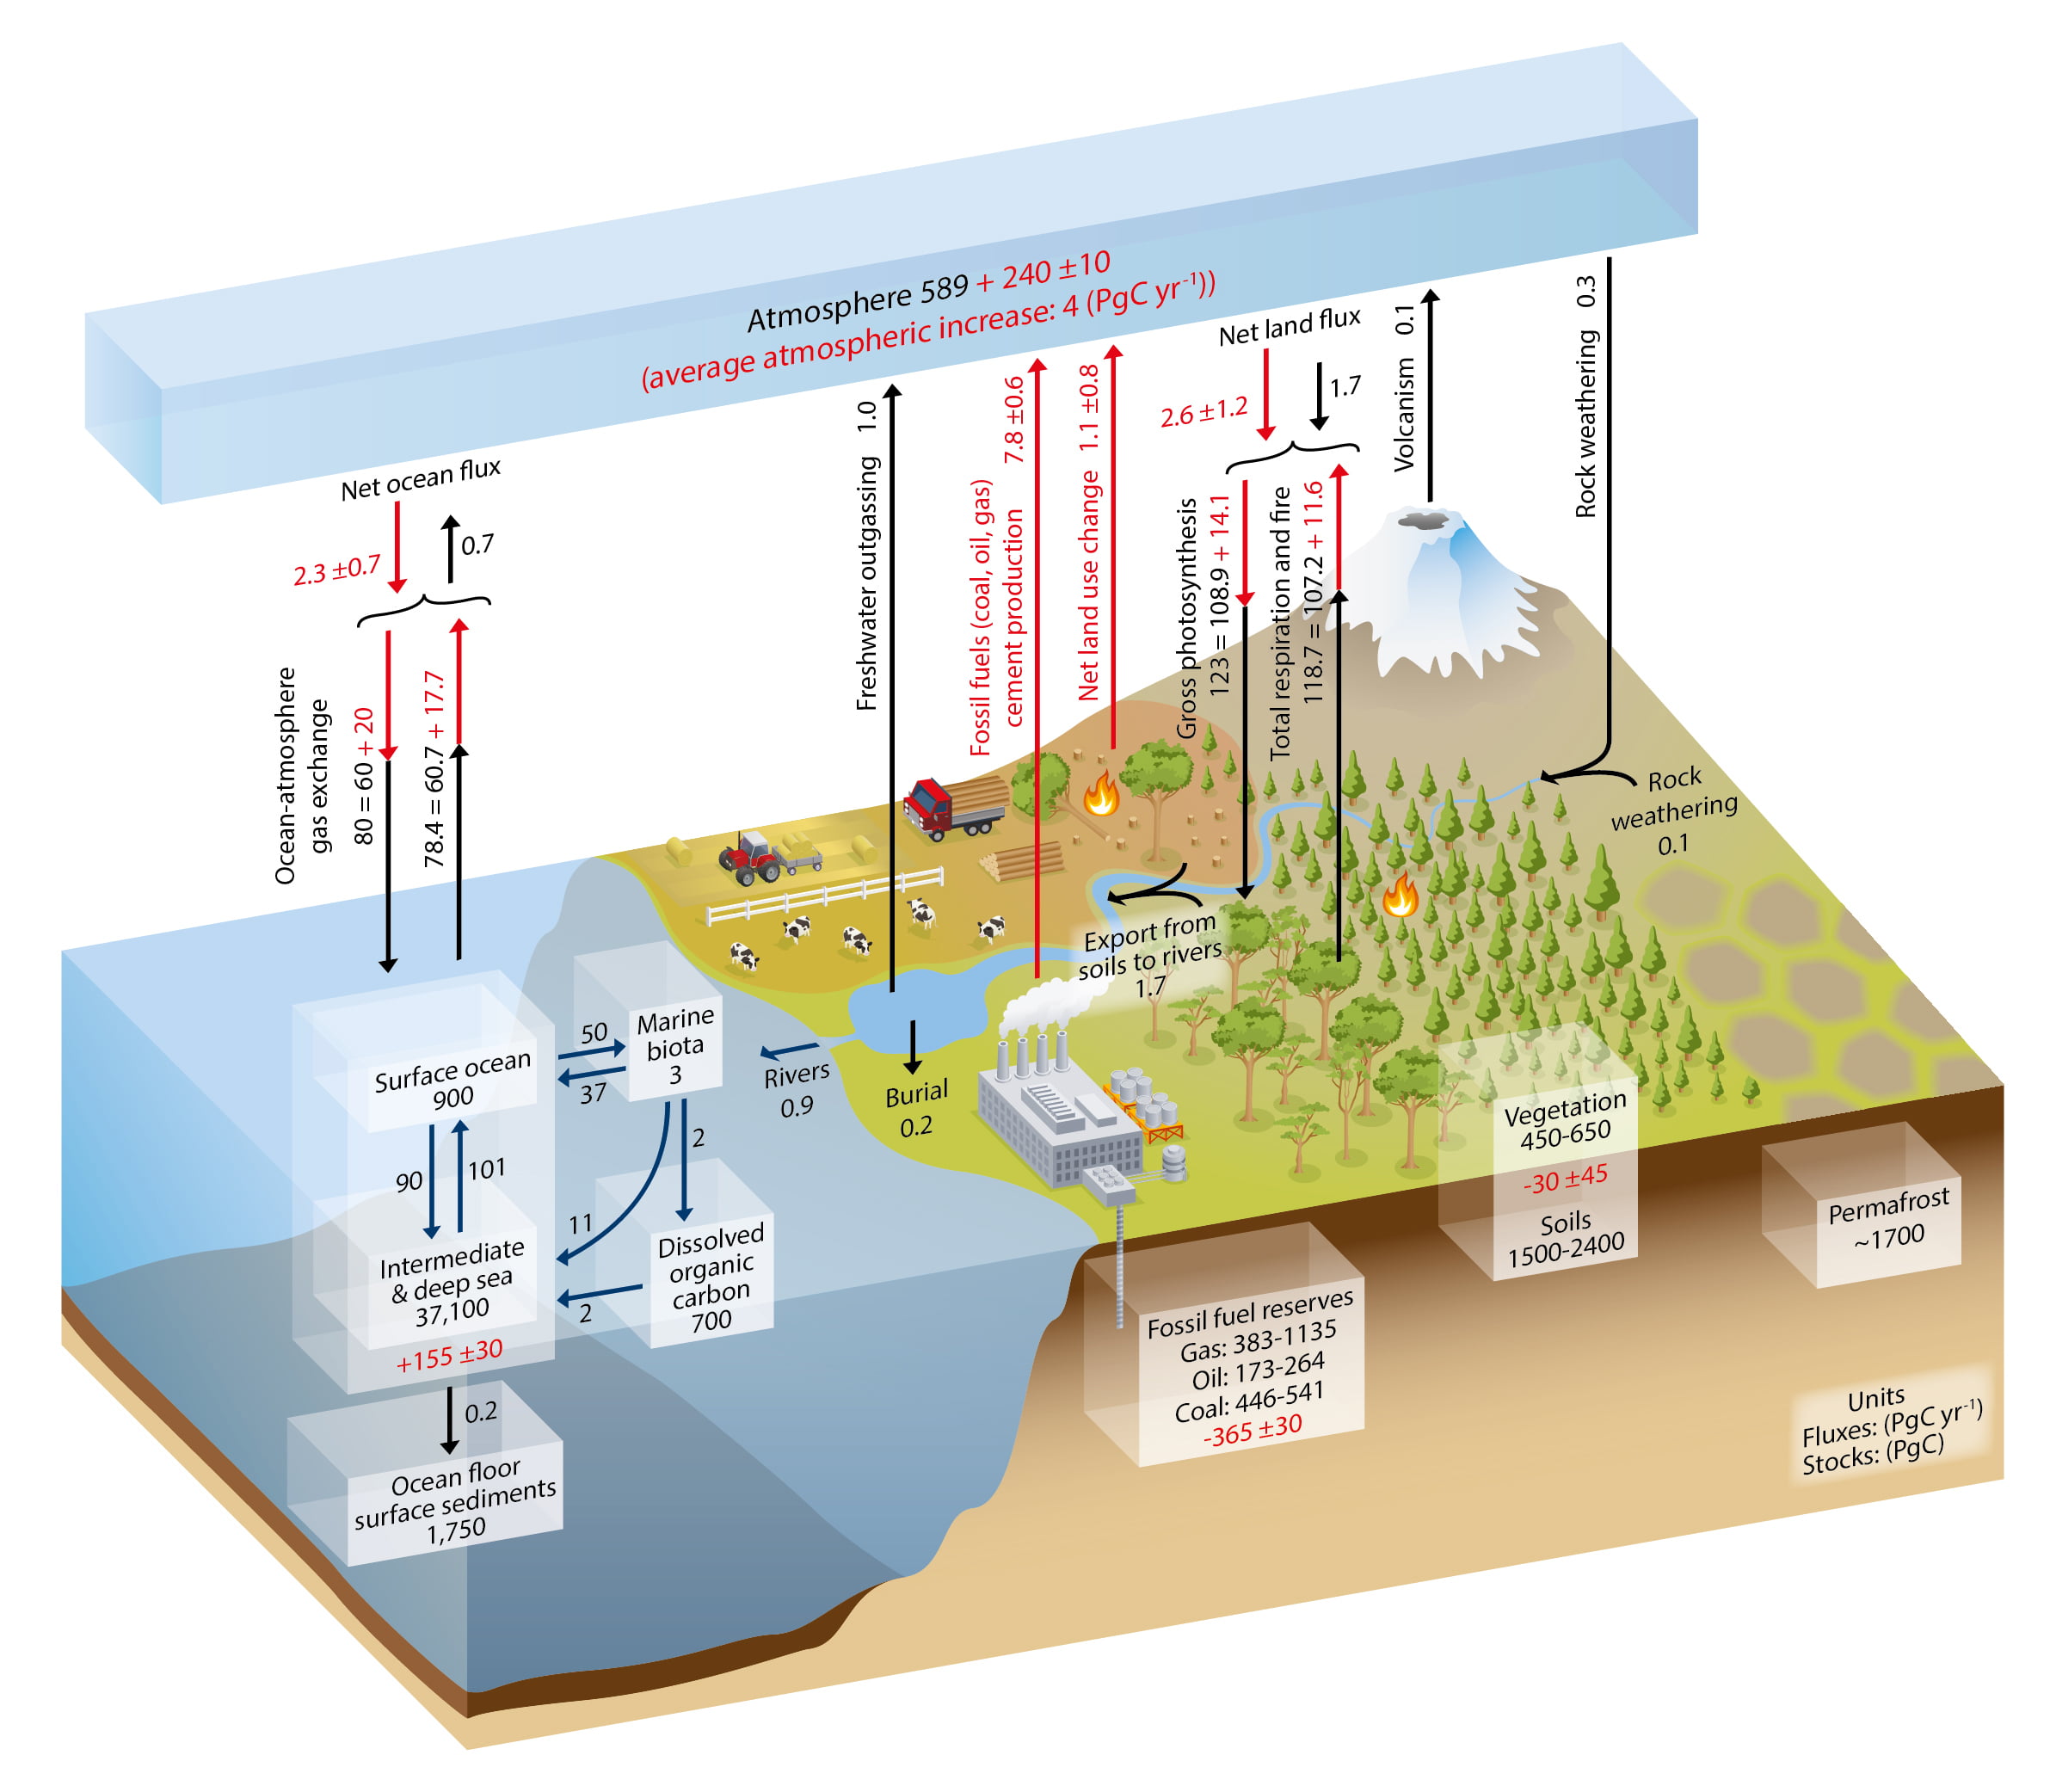
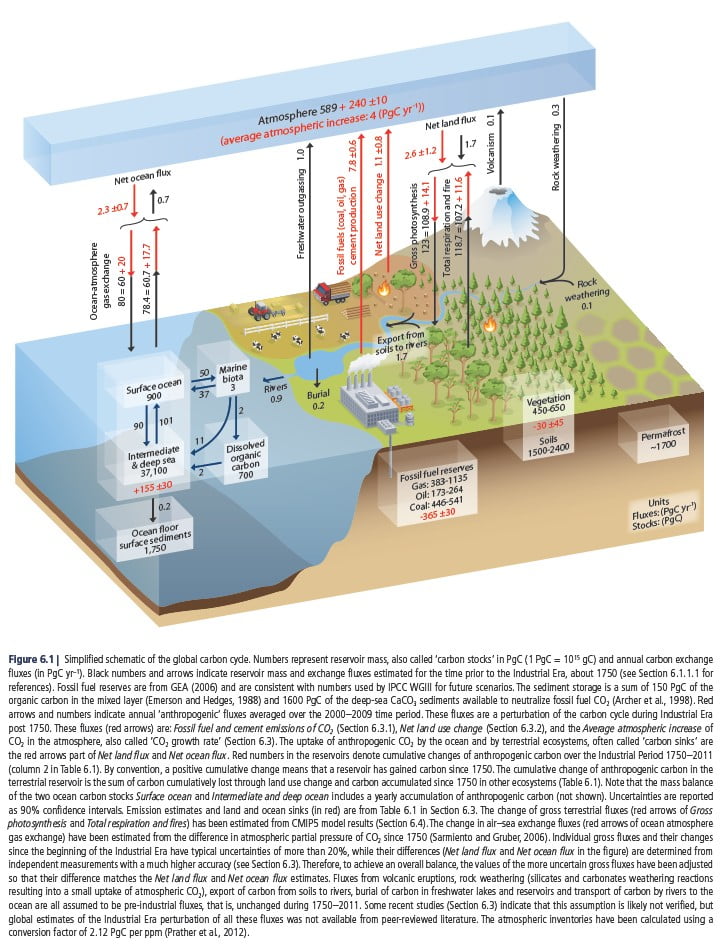
The numbers represent carbon reservoirs in Petagrams of Carbon (PgC; 1015gC) and the annual exchanges in PgC/year. The black numbers and arrows show the pre-Industrial reservoirs and fluxes. The red numbers and arrows show the additional fluxes caused by humans averaged over 2000-2009, which include emissions due to the burning of fossil fuels, cement production and land use change (in total about 9 PgC/year). Some of this additional anthropogenic carbon is taken up by the land and the ocean (about 5 PgC/year) while the remainder is left in the atmosphere (4 PgC/year), causing rising atmospheric concentrations of CO2. The red numbers in the reservoirs show the cumulative changes in anthropogenic carbon from 1750-2011; a positive change indicates that the reservoir has gained carbon.
The global carbon cycle can be viewed as a series of reservoirs of carbon in the Earth System, which are connected by exchange fluxes. An exchange flux is the amount of carbon which moves between reservoirs each year.
There are two domains in the global carbon cycle, fast and slow. The fast domain has large exchange fluxes and relatively ‘rapid’ reservoir turnovers. This includes carbon on land in vegetation, soils and freshwater and in the atmosphere, ocean and surface ocean sediments. Reservoir turnover times (a measure of how long the carbon stays in the reservoir) range from a few years for the atmosphere to decades to millennia for the major carbon reservoirs of the land vegetation and soil and the various domains in the ocean.
The slow domain consists of the huge carbon stores in rocks and sediments which exchange carbon with the fast domain through volcanic emissions of CO2, erosion and sediment formation on the sea floor. Reservoir turnover times of the slow domain are 10,000 years or longer.
Before the Industrial Era, the fast domain was close to a steady state. Data from ice cores show little change in the atmospheric CO2 levels over millennia despite changes in land use and small emissions from humans. By contrast, since the beginning of the Industrial Era (around 1750), fossil fuel extraction and its combustion have resulted in the transfer of a significant amount of fossil carbon from the slow domain into the fast domain, causing a major perturbation to the carbon cycle.
In the atmosphere, CO2 is the dominant carbon containing trace gas with a concentration of approximately 390.5 ppm in 2011, which corresponds to a mass of 828 PgC. Additional trace gases include methane (CH4, currently about 3.7 PgC) and carbon monoxide (CO, around 0.2PgC), with still smaller amounts of hydrocarbons, black carbon aerosols and other organic compounds.
The terrestrial biosphere reservoir contains carbon in organic compounds in vegetation (living biomass) (450 to 650 PgC) and in dead organic matter in litter and soils (1500 to 2400 PgC). There is an additional amount of old soil carbon in wetland soils (300 to 700 PgC) and in permafrost (1700 PgC).
CO2 is removed from the atmosphere by plant photosynthesis (123±8 PgC/ year). Carbon fixed into plants is then cycled through plant tissues, litter and soil carbon and can be released back into the atmosphere by plant, microbial and animal respiration and other processes (e.g. forest fires) on a very wide range of time scales (seconds to millennia).
A significant amount of terrestrial carbon (1.7 PgC/year) is transported from soils to rivers. A fraction of this carbon is released as CO2 by rivers and lakes to the atmosphere, a fraction is buried in freshwater organic sediments and the remaining amount (~0.9 PgC/ year) is delivered by rivers to the coastal ocean. Atmospheric CO2 is exchanged with the surface ocean through gas exchange.
Carbon is transported within the ocean by three mechanisms;
(1) the ‘solubility pump’
(2) the ‘biological pump’
(3) the ‘marine carbonate pump’
| Summary: Carbon is cycled around in the environment from a number of stores or reservoirs by various processes. Some of these processes are natural such as photosynthesis; others are the result of human activity such as most burning of fossil fuels. Humans are moving carbon at a very high rate from stores where it would usually stay for tens of thousands of years. The processes to put the carbon back in such stores are much slower so carbon dioxide is building up in the atmosphere and oceans. |
IPCC links
These is figure 6.1 from the WG1 report of the 2013 IPCC 5AR.
WG1 FAQ 6.2 What happens to carbon dioxide after it is emitted into the atmosphere?
WG1 FAQ 12.3 What would happen to future climate if we stopped emissions today?
3) Sources of Anthropogenic Carbon Dioxide
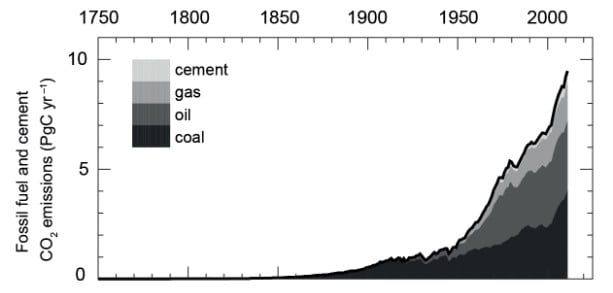
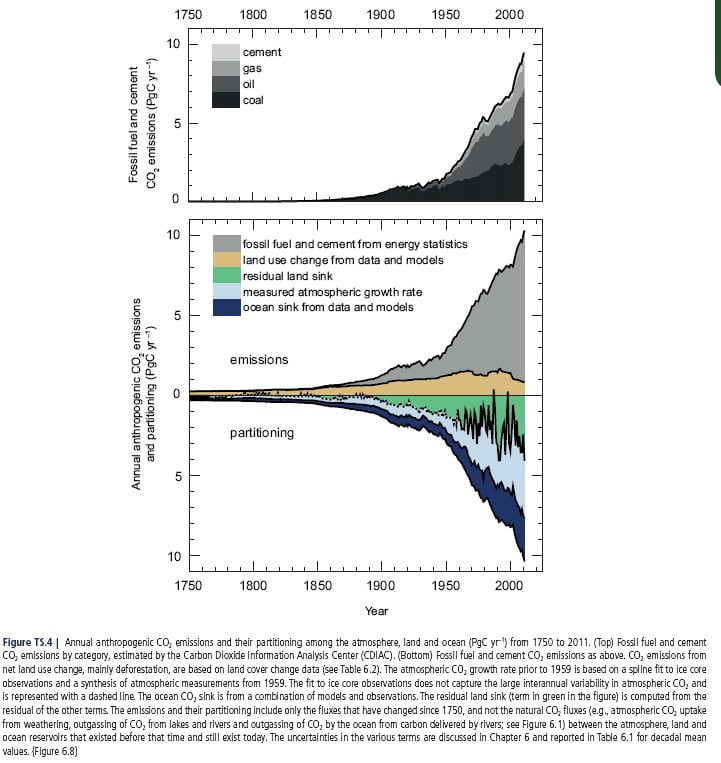
Annual global anthropogenic CO2 emissions (PgC/ year) from 1750 to 2011
Anthropogenic CO2 emissions to the atmosphere were 555 ± 85 PgC between 1750 and 2011. Of this, fossil fuel combustion and cement production contributed 375 ± 30 PgC and land use change (including deforestation, afforestation (planting new forest) and reforestation) contributed 180 ± 80 PgC. In 2002–2011, average fossil fuel and cement manufacturing emissions were 7.6 to 9.0 PgC/ year, with an average increase of 3.2%/ year compared with 1.0%/ year during the 1990s. In 2011, fossil fuel emissions were in the range of 8.7 to 10.3 PgC.
Emissions due to land use changes between 2002 and 2011 are dominated by tropical deforestation, and are estimated to range between 0.1 to 1.7 PgC/year. This includes emissions from deforestation of around 3 PgC/ year compensated by an uptake of around 2 PgC/year by forest regrowth (mainly on abandoned agricultural land).
The IPCC concluded that the increase in CO2 emissions from both fossil fuel burning and land use change are the dominant cause of the observed increase in atmospheric CO2 concentration. Globally, the combined natural land and ocean sinks of CO2 kept up with the atmospheric rate of increase, removing 55% of the total anthropogenic emissions every year on average during 1958–2011. The ocean reservoir stored 155 ± 30 PgC. Vegetation biomass and soils stored 160 ± 90 PgC.
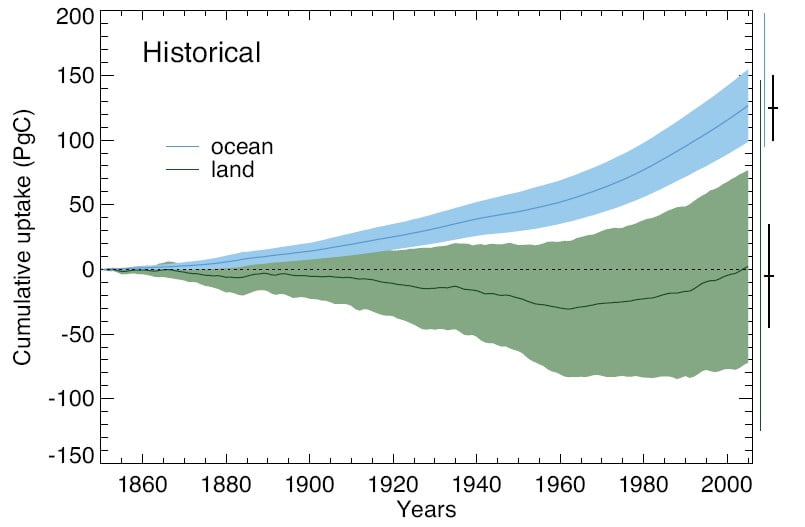
| Cumulative land and ocean uptake of carbon for the period 1850-2005. The thick line shows the mean and the shaded area shows one standard deviation. This shows that land was a net source of CO2 to the atmosphere until around 1960, after which land becomes a net sink with more CO2 being drawn down from the atmosphere into vegetation and soils than is released. |
| Summary: Since 1750 when the industrial revolution began, humans have produced carbon dioxide by burning fossil fuels and making cement. About half of this extra carbon dioxide has stayed in the atmosphere where it absorbs energy, preventing the energy escaping into space and so heating the planet. Some of the extra carbon dioxide has been taken up by the ocean. |
IPCC links
These are figures TS.4 (top) and 6.24 from WG1 2013 IPCC 5AR.
WG1 full figure TS.4 also shows the partitioning of the emissions into the atmosphere, land and ocean sinks.
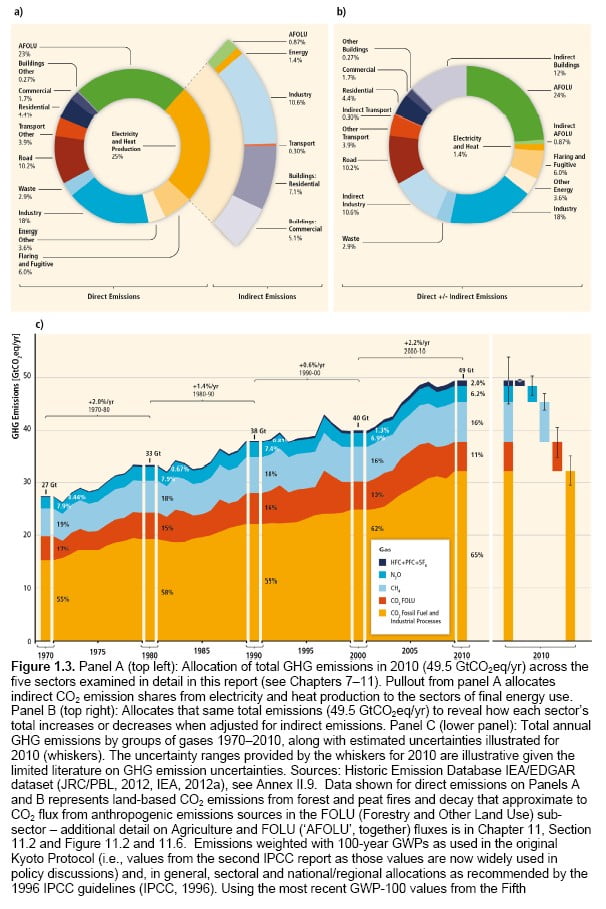
WGIII Figure 1.3 shows the emissions of all greenhouse gases for 1970-2010.
WG1 Figure 6.3 shows the corresponding increase in the atmospheric concentration of CO2.
WG1 FAQ 6.1 Could rapid release of methane and carbon dioxide from thawing permafrost or ocean warming substantially increase warming?
WG1 FAQ 6.2 What happens to carbon dioxide after it is emitted into the atmosphere?
WG1 FAQ 12.3 What would happen to future climate if we stopped emissions today?
WGIII FAQ 2.1 What causes GHG emissions?
4) Changing Carbon Dioxide and Oxygen Concentrations in the Atmosphere
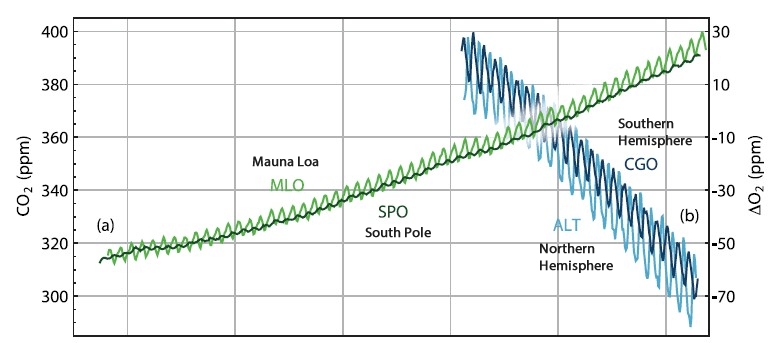
Concentrations of carbon dioxide and oxygen in the atmosphere Atmospheric concentration of a) carbon dioxide in parts per million by volume from Mauna Loa (MLO, light green) and the South Pole (SPO, dark green) from 1950 to 2013, and of b) changes in the atmospheric concentration of O2 from the northern hemisphere (ALT, light blue) and the southern hemisphere (CGO, dark blue) relative to a standard value.
Carbon Dioxide
CO2 increased by 40% from 278 ppm in 1750 to 390.5 ppm in 2011.
Most of the fossil fuel CO2 emissions take place in the industrialised countries north of the equator. Consistent with this, the annual average atmospheric CO2 measurement stations in the Northern Hemisphere (NH) record higher CO2 concentrations than stations in the Southern Hemisphere (SH). As the difference in fossil fuel combustion between the hemispheres has increased, so has the difference in concentration between measuring stations at the South Pole and Mauna Loa (Hawaii, NH).
The atmospheric CO2 concentration increased by around 20 ppm during 2002–2011. This decadal rate of increase is higher than during any previous decade since direct atmospheric concentration measurements began in 1958.
Because CO2 uptake by photosynthesis occurs only during the growing season, whereas CO2 release by respiration occurs nearly year-round, the greater land mass in the NH imparts a characteristic ‘sawtooth’ seasonal cycle in atmospheric CO2.
Past changes in atmospheric greenhouse gas concentrations can be determined with very high confidence from polar ice cores. During the 800,000 years prior to 1750, atmospheric CO2 varied from 180 ppm during glacial (cold) up to 300 ppm during interglacial (warm) periods. Present-day (2011) concentrations of atmospheric carbon dioxide exceed this range. The current rate of CO2 rise in atmospheric concentrations is unprecedented with respect to the highest resolution ice core records of the last 22,000 years.
Oxygen
Atmospheric oxygen is tightly coupled with the global carbon cycle. The burning of fossil fuels removes oxygen from the atmosphere. As a consequence of the burning of fossil fuels, atmospheric O2 levels have been observed to decrease slowly but steadily over the last 20 years. Compared to the atmospheric oxygen content of about 21% this decrease is very small; however, it provides independent evidence that the rise in CO2 must be due to an oxidation process, that is, fossil fuel combustion and/or organic carbon oxidation, and is not caused by volcanic emissions or a warming ocean releasing carbon dioxide (CO2 is less soluble in warm water than cold). The atmospheric oxygen measurements also show the north–south concentration O2 difference (higher in the south and mirroring the CO2 north–south concentration difference) as expected from the greater fossil fuel consumption in the NH.
| Summary: The green line shows the changing concentration of carbon dioxide: it is going steadily up, with seasonal fluctuations, consistent with the amount of fossil fuel combustion due to human activities. An additional piece of evidence to support that this is caused by the burning of fossil fuels is that the oxygen concentration is going down by a similar amount, suggesting that the oxygen is being used to produce carbon dioxide in a combustion reaction rather than the carbon dioxide coming from some other process such as volcanoes. |
IPCC links
This is figure 6.3 from WG1 of 2013 IPCC 5AR
WG1 FAQ 6.2 What happens to carbon dioxide after it is emitted into the atmosphere?
5) Are people causing Climate Change?

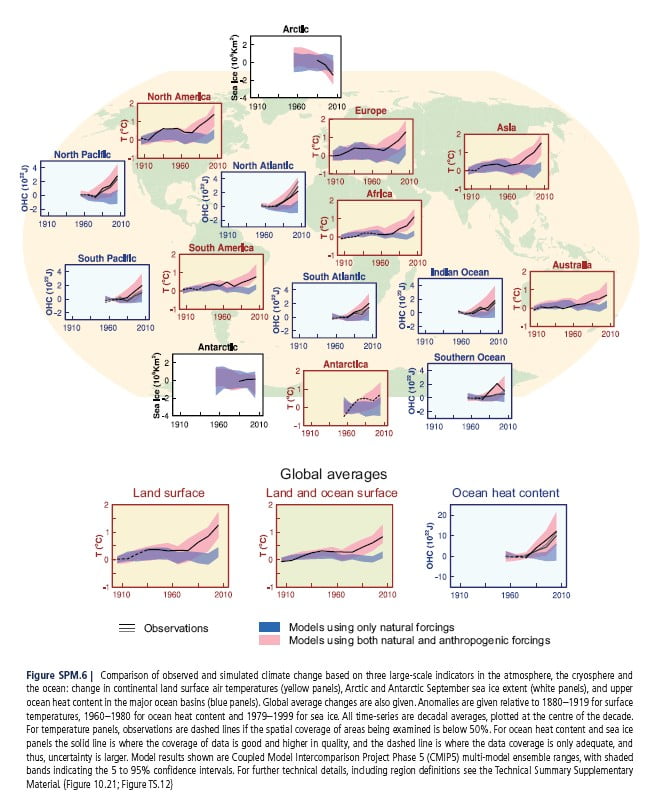
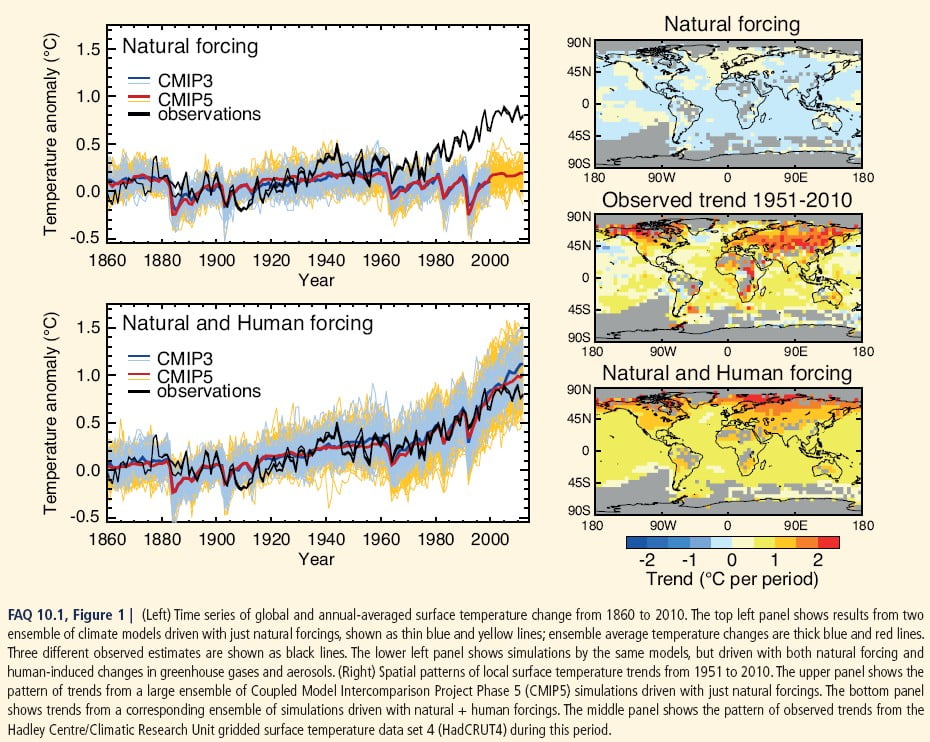
A comparison of observed and modelled climate change in globally averaged surface air temperatures and upper ocean heat content. The values are decadal averages given relative to the 1880–1919 average surface temperatures and the 1960–1980 average upper ocean heat content. The observations are dashed where the coverage of observations is poor and uncertainty is larger. The model results shown are from a large collection of climate models from around the world, with shaded bands indicating the 5 to 95% confidence intervals.
The causes of observed long-term changes in climate (on time scales longer than a decade) are assessed by determining whether the expected ‘fingerprints’ of different possible causes of climate change are found in observations. These fingerprints are patterns of change in temperature, or other climate variables, and are estimated using climate model simulations of the climate’s response to specific ‘forcing factors’ (any factor that influences global climate by heating or cooling the planet) which change the earth’s energy balance. Some forcing factors are caused by purely natural processes, such as volcanic eruptions or variations in the brightness of the sun; other forcing factors are caused by human activities, such as emitting greenhouse gases.
By comparing the simulated fingerprint patterns with observed climate changes, scientists can determine which forcing factors have been most important. This work also takes into account natural fluctuations in the climate (known as ‘natural internal variability’) that occur without any forcing.
The observed change in temperature in the latter half of the 20th century, shown by the black line in the figures, is larger than expected from just natural internal variability. Simulations driven only by natural factors (blue areas in the figures) fail to reproduce the temperature changes that were observed in the late 20th century. Only the simulations that include both forcing factors caused by human activities (including changes in greenhouse gases, stratospheric ozone and atmospheric aerosol pollution) and natural processes (pink areas) simulate the observed warming trend. Natural causes of change are still at work in the climate system, but the IPCC concluded that “ it is extremely likely that human activities caused more than half of the observed increase in global mean surface temperatures from 1951 to 2010”.
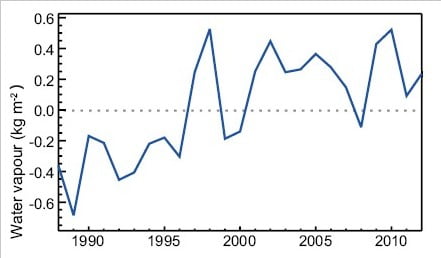
| Global and annual averages of atmospheric water vapour over ocean surfaces, shown relative to the average for the period 1988-2007. |
Evidence of climate change is also seen in other variables. Since the last IPCC report, satellite evidence has shown an increase in the amount of water vapour in the troposphere. The year-to-year variability and long term trend in atmospheric water vapour content are closely linked to changes in global sea surface temperature, partly because warmer temperatures cause increased evaporation.
| Summary: Climate scientists use models to predict what will happen to the temperature in the future – these models can also be used to try to find out what caused the changes seen in the recent past. They strongly suggest that the change in climate since the 1950s is mostly due to human activity. |
IPCC links
This is figure 6 from the Summary for Policy Makers from the WG1 report, IPCC 2013
The inset figure is figure 2.31 from WG1 of the 2013 IPCC 5AR
WG1 FAQ10.1 Figure 1 shows the same information in greater detail.
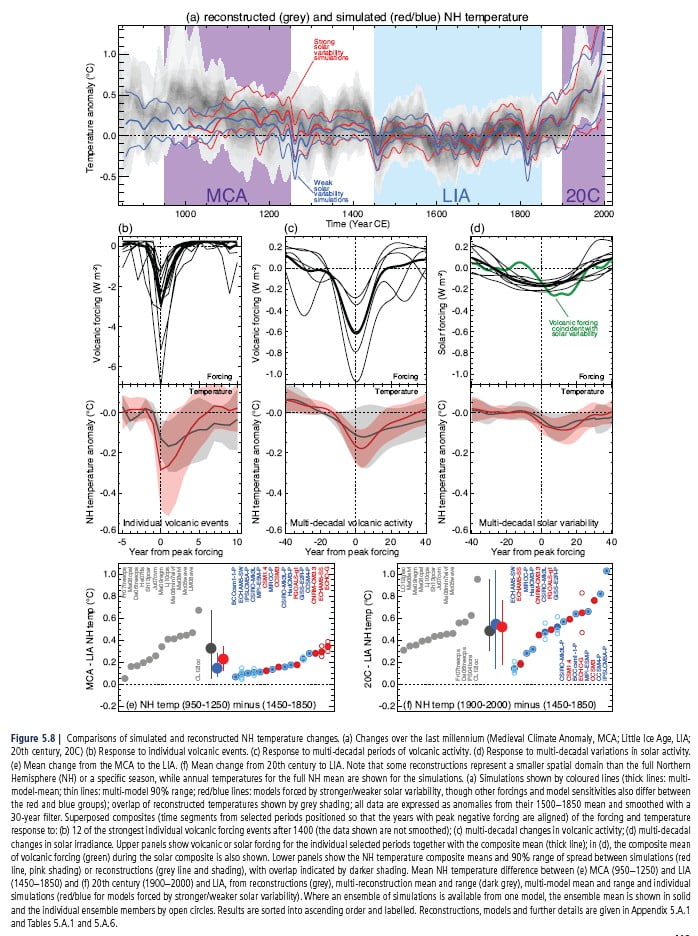
WG1 Figure 5.8 shows reconstructed temperature from observations for a longer time period.
WG1 Figure 5.7 shows individual reconstructions from different data sources.
WG1 FAQ 2.1 How do we know the world has warmed?
WG1 FAQ 5.1 Is the Sun a major driver of recent changes in climate?
WG1 FAQ 10.1 Climate Is Always Changing. How Do We Determine the Causes of Observed Changes?
WG1 FAQ 11.2 How do volcanic eruptions affect climate and our ability to predict climate?
From the 4th Assessment Report WG1:
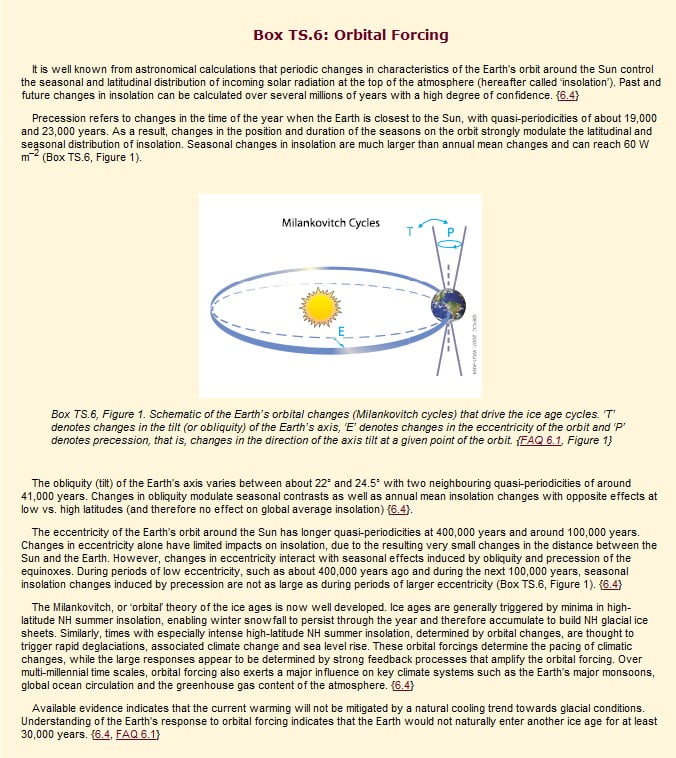
Box 6.1 Orbital Forcing
Box TS.6 Orbital Forcing
FAQ 6.1 What Caused the Ice Ages and Other Important Climate Changes Before the Industrial Era?
6) Quantifying the Causes of Recent Climate Change
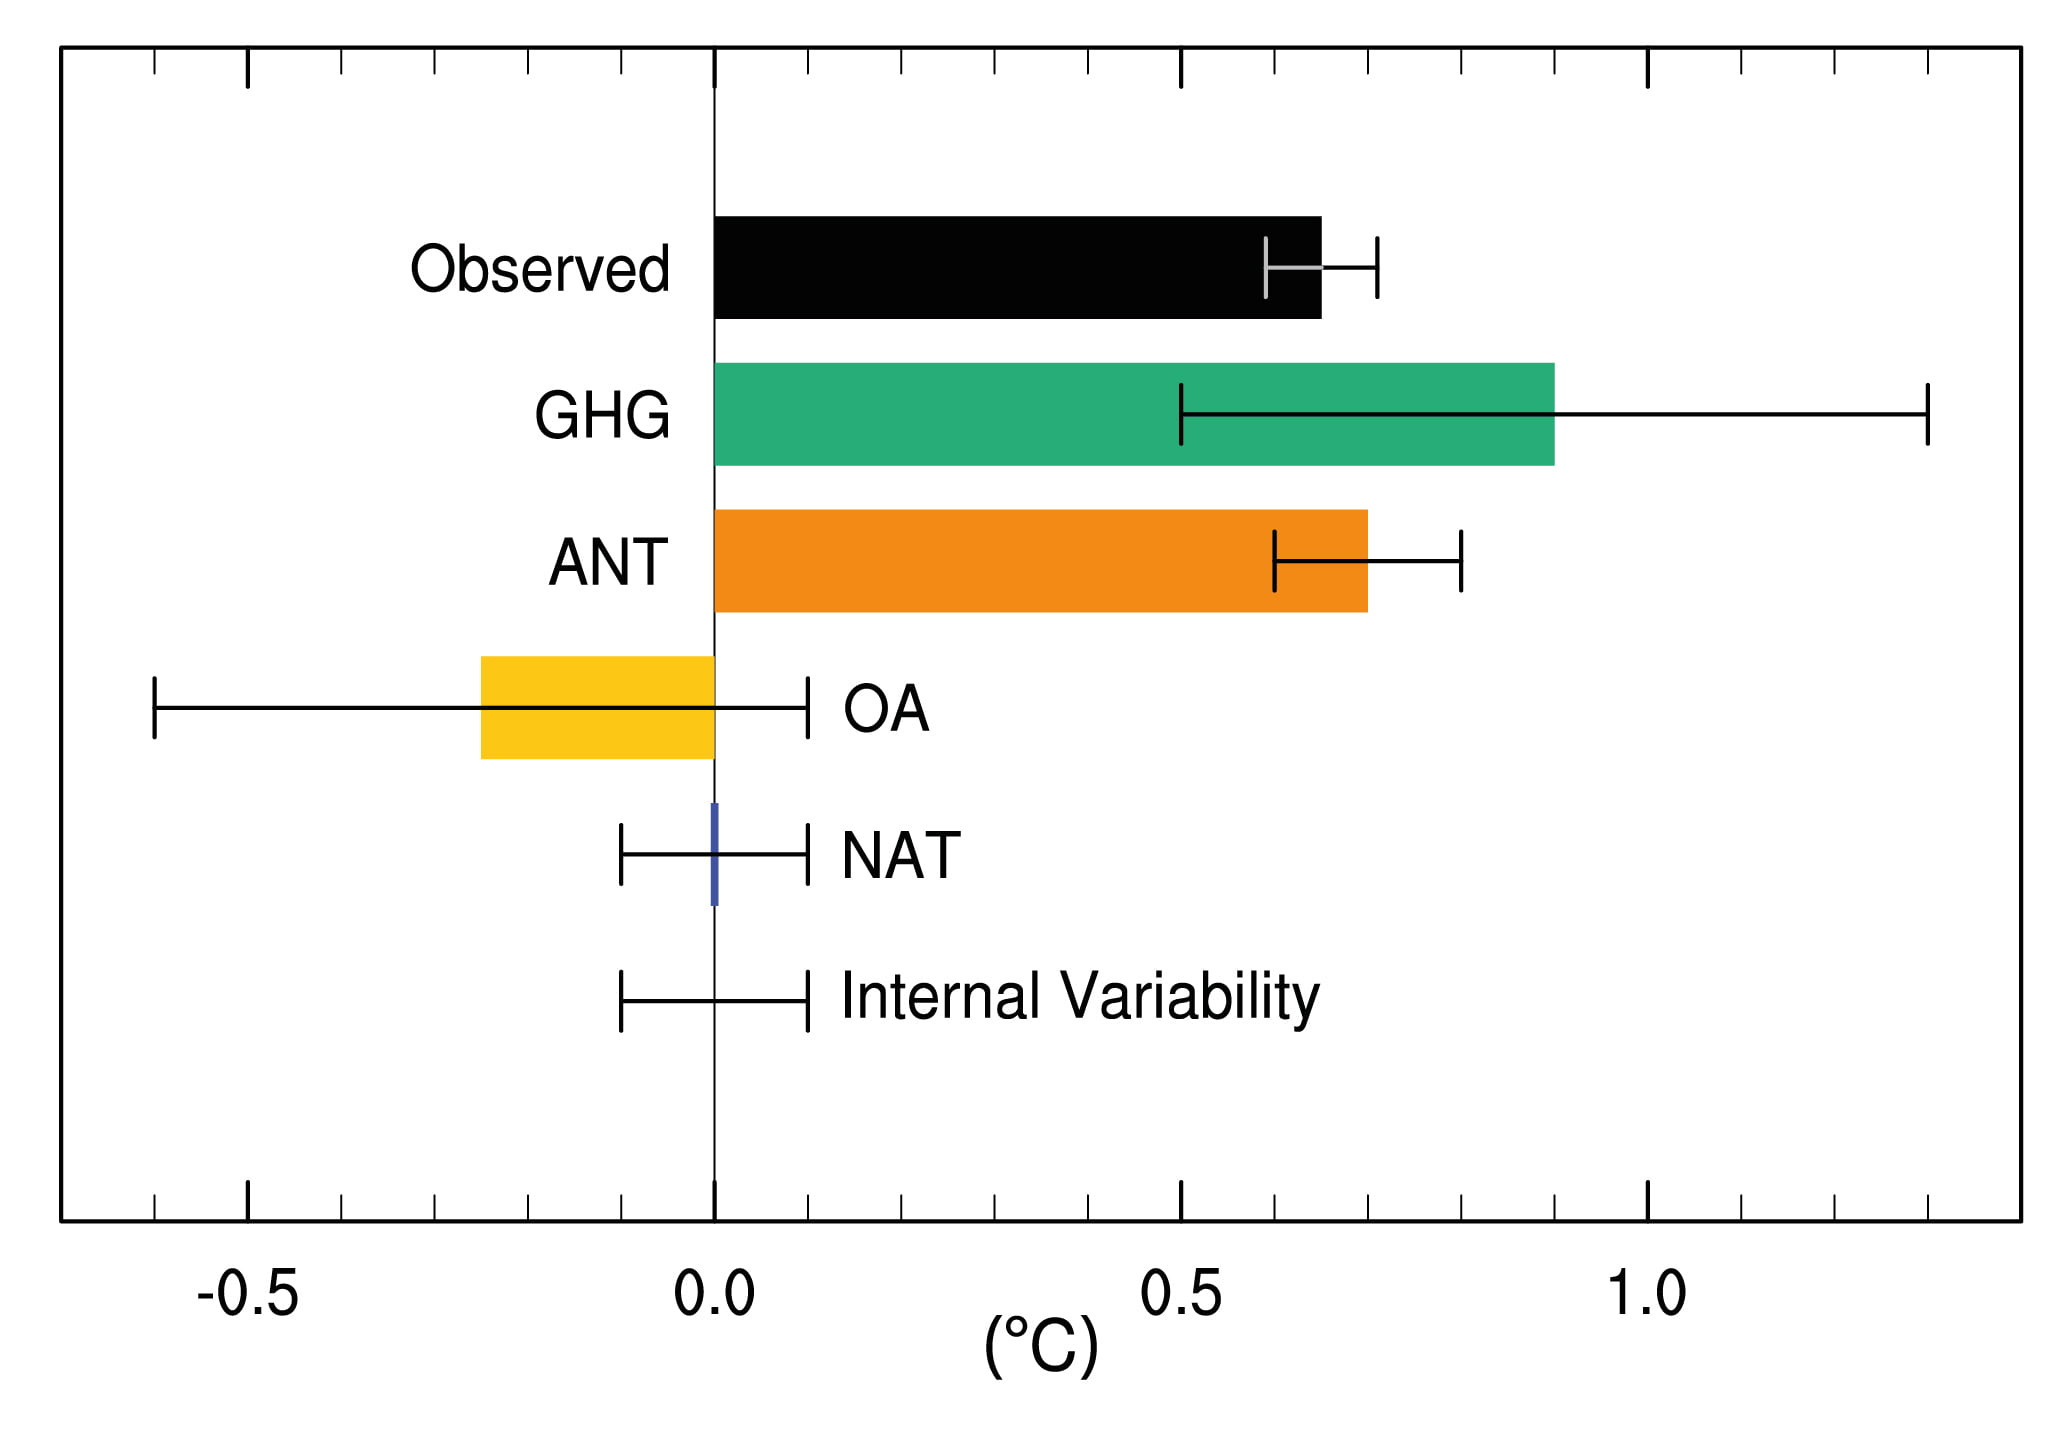
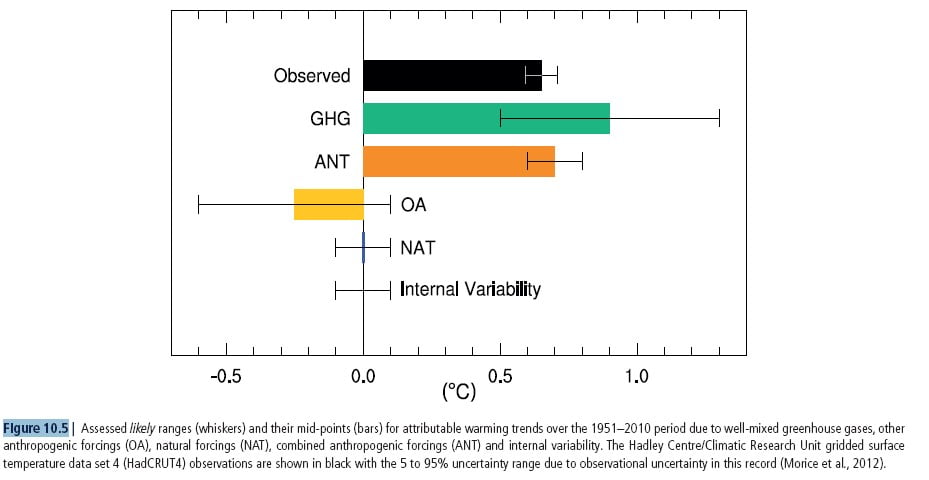
The black bar shows the trend in global mean surface temperature from 1951-2010. The coloured lines show how each factor is thought to have contributed to this rise. The thin black lines (whiskers) show the assessed likely ranges in the data and the coloured bars show the mid-points of these ranges for the contributions from: well-mixed greenhouse gases (GHG, green), other anthropogenic forcing factors (OA, yellow), combined anthropogenic forcing factors (ANT, orange), natural forcing factors (NAT, blue) and natural internal variability (i.e. unforced). Other anthropogenic forcing factors include emissions of aerosols and non-greenhouse gases, and land use change. Natural forcing factors include changes in the sun’s energy output and volcanic emissions.
The IPCC concluded that “it is extremely likely that human activities caused more than half of the observed increase in global mean surface temperatures from 1951 to 2010.”
The quantitative contributions to the observed warming over the period 1951-2010 are estimated using climate model simulations which include different forcing factors. Forcing factors influence global climate by heating or cooling the planet. The figure shows that the increase in well-mixed greenhouse gases (primarily CO2) contributed a global mean surface warming between 0.5°C and 1.3°C, with a central estimate of 0.9°C. This warming contribution was partly offset by the contribution of other anthropogenic forcing factors (OA) which probably cooled the climate. As a result, the central estimate for the contribution from combined (greenhouse gas plus other anthropogenic) forcing factors is lower at 0.7°C, which is similar to the observed warming of 0.6-0.7°C. The contributions from natural forcing factors and internal variability, due to naturally variable processes within the climate system, are assessed to be small.
A major contribution to other anthropogenic forcing (OA) is from aerosols, which are small particles of liquids or solids dispersed through the air. These come from both natural and human sources, and can affect the climate in multiple and complex ways through their interactions with radiation and clouds. Some aerosols scatter and reflect solar radiation and therefore tend to the cool the climate, whilst others absorb solar radiation causing warming. The balance between cooling and warming depends on the properties of the aerosol (such as its colour) and local environmental conditions. Overall, models and observations indicate that anthropogenic aerosols have exerted a cooling influence on the Earth since pre-industrial times, which has masked some of the global mean warming from greenhouse gases that would have occurred in their absence.
The observed global mean surface temperature has shown a much smaller increasing linear trend over the past 15 years than over the past 30 to 60 years with the trend over 1998–2012 estimated to be around one third to one half of the trend over 1951–2012. Even with this ‘hiatus’ in the surface temperature trend, the 2000-2010 decade has been the warmest in the instrumental record. The IPCC concluded that this ‘hiatus’ is probably the result of both a cooling contribution from natural internal variability and a reduced trend in natural forcing (volcanic eruptions and panthropogenicbiological pump a do) and their /pa name=”6″wnward phase of the 11 year solar cycle). During the ‘hiatus’, the climate system has continued to accumulate energy, for example energy accumulation in the oceans has caused the global mean sea level to continue rising.
| Summary: Climate scientists have tried to work out how much of the change in temperature since the 1950s is due to various factors. They suggest that very little is due to natural variability and most is due to human activity, mainly the industrial emissions of greenhouse gases. The thin black lines show the estimated error ranges in the calculations. |
IPCC links
This is Figure 10.5 from the 2013 IPCC WG1 5AR.
WG1 FAQ 5.1 Is the Sun a major driver of recent changes in climate?
WG1 FAQ 7.2 How Do Aerosols Affect Climate and Climate Change?
WG1 FAQ 10.1 Climate is always changing. How do we determine the causes of observed changes?
WG1 FAQ 11.2 How do volcanic eruptions affect climate and our ability to predict climate?
7) Projected Effects of Increased Levels of Greenhouse Gases

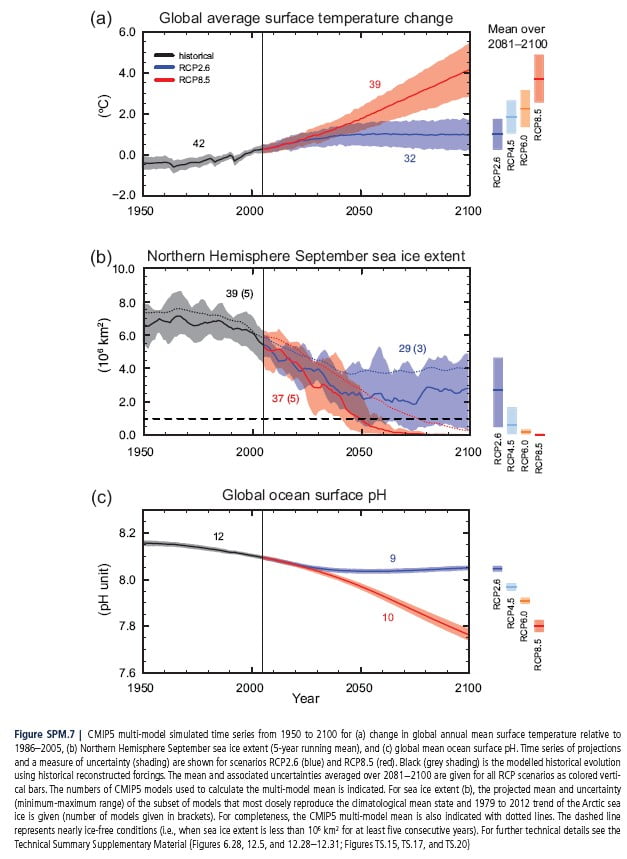
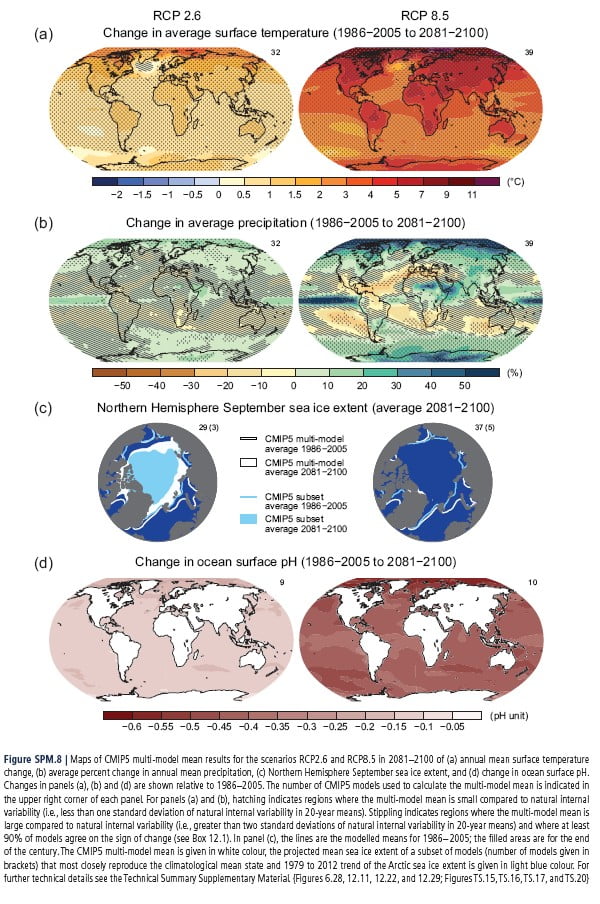
Climate model projections of change
Climate Model Simulations of the change in
(a) global annual mean surface temperature (oC difference relative to 1986-2005 average)
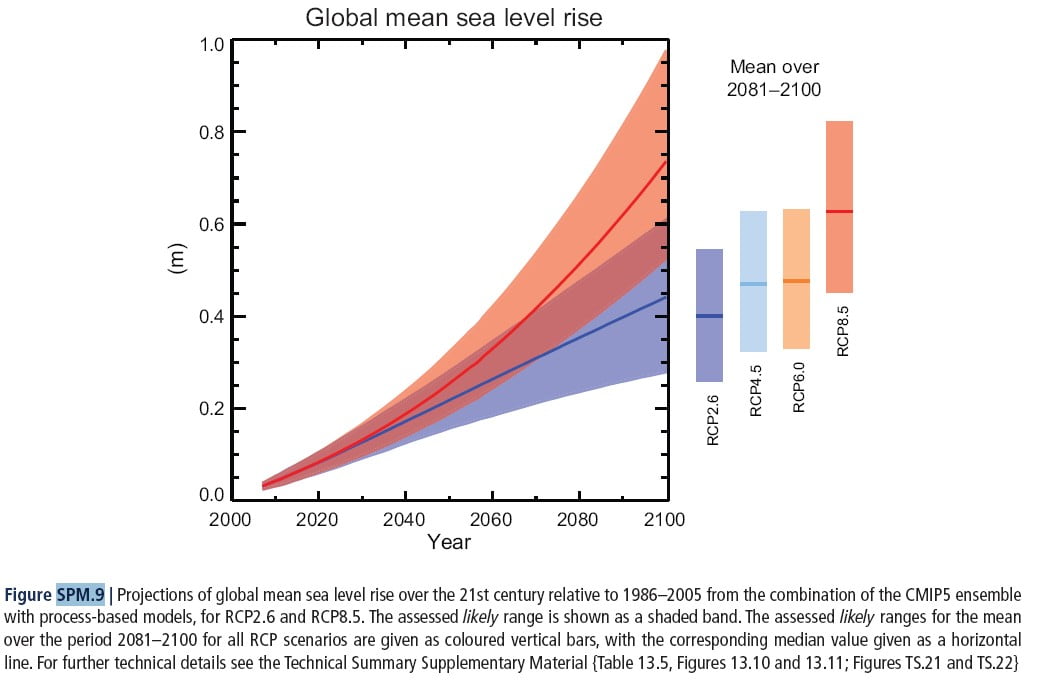
(b) sea level (m difference)
(c) ocean acidity (pH) and
(d) precipitation (% change by 2081–2100 relative to 1986-2005).
The shading indicates an uncertainty range for simulations of the past (grey) and for two different future scenarios – a low emissions scenario where carbon emissions are rapidly cut (RCP2.6, blue) and a high emissions scenario (RCP8.5, red)
There will be further warming and changes in all components of the climate system if the concentrations of greenhouse gases continue to rise. To limit climate change will require substantial and sustained reductions of greenhouse gas emissions, similar to the low emissions (RCP2.6, blue) scenario. Although warming will continue to exhibit year-to-year and decade-to-decade variability, global mean surface temperatures for 2081–2100 will be higher than in 1986–2005 even under the low emissions scenario. The ranges derived from the model simulations are 0.3°C to 1.7°C for a low emissions scenario (the blue line) and 2.6°C to 4.8°C for the high emissions scenario (red line). Global surface temperature change for the end of the 21st century is likely to exceed 1.5°C above pre-industrial temperatures unless future emissions are very low.
Scientists are confident that the Arctic region will warm more rapidly than the global mean, and that average warming over land will be larger than over the oceans.
By 2100, with high emissions (red), model projections suggest global sea levels will have risen 0.52 to 0.98 m on average, with a rate during 2081 to 2100 of 8 to 16 mm/ year.
The projected decrease in surface ocean pH by the end of 21st century is 0.06 to 0.07 (blue) and 0.30 to 0.32 (red). This increase in ocean acidity is due to CO2 (an acidic gas) dissolving in the oceans and could affect marine ecosystems.
There are likely to be changes to rainfall patterns in many areas around the globe. Areas near the poles (high latitudes) and the equatorial Pacific Ocean are likely to experience an increase in annual mean precipitation by the end of this century. In many mid-latitude and subtropical dry regions, mean precipitation will likely decrease, while in many mid-latitude wet regions, mean precipitation will probably increase by the end of this century.
Extreme precipitation events over most of the mid-latitude land masses and over wet tropical regions will very likely become more intense and more frequent by the end of this century, because as global mean surface temperature increases, there is more energy and water vapour in the atmosphere.
By the mid-21st century, the magnitudes of the projected changes are substantially affected by the choice of emissions scenario. The various scenarios considered involve a wide range of technological, socioeconomic, and institutional trajectories, but it may be that the actual future does not fit within this projected range. Delaying mitigation efforts will make it substantially harder to achieve low longer-term emissions levels.
Beyond 2100
Warming will continue beyond 2100 except in the case of a low emissions scenario. A higher likelihood of remaining below a given warming target (such as 2°C), will require lower cumulative greenhouse gas emissions. Most other aspects of climate change will also persist for many centuries even if anthropogenic emissions of greenhouse gases are reduced to zero. Stabilization of global temperature does not imply stabilization for all aspects of the climate system. Processes related to vegetation change, changes in the ice sheets, deep-ocean warming and associated sea level rise have long time scales as do potential feedbacks linking, for example, ocean and the ice sheets. Ocean acidification will continue for many hundreds of years into the future as the oceans continue to take up atmospheric CO2. Land ecosystem carbon cycle changes will manifest themselves beyond the end of the 21st century. It is virtually certain that global mean sea level rise will continue beyond 2100, with sea level rise due to thermal expansion continuing for centuries to millennia. Reducing emissions earlier rather than later, for the same cumulative total, leads to a lower eventual global mean sea level rise.
Issues of equity, justice, and fairness arise with respect to mitigation and adaptation.Countries’ past and future contributions to the accumulation of greenhouse gases in the atmosphere are different, and countries also face varying challenges and circumstances, and have different capacities to address, mitigate and adapt.
Mitigation and adaptation can positively or negatively influence the achievement of other societal goals, such as those related to human health, food security, biodiversity, local environmental quality, energy access, livelihoods, and equitable sustainable development.
| Summary: Scientists use models to try to predict what might happen in the future if levels of carbon dioxide continue to rise. These show temperatures and sea levels rising and the pH of the sea falling as the sea becomes more acidic due to an increase in the concentration of carbon dioxide. Rainfall patterns change, but these vary with some areas seeing more and others less rain. |
IPCC links
This is part of Figures SPM 7a, c 8 and 9 from the WG1 report for the 2013 IPCC 5AR.
WG1 SPM Figure 7 (complete)
WG1 SPM Figure 8 – Maps of projected changes in temperature, precipitation, sea ice extent and ocean PH through the 21st Century
WG1 SPM Figure 9 – Projections of global mean sea level rise over the 21st Century.
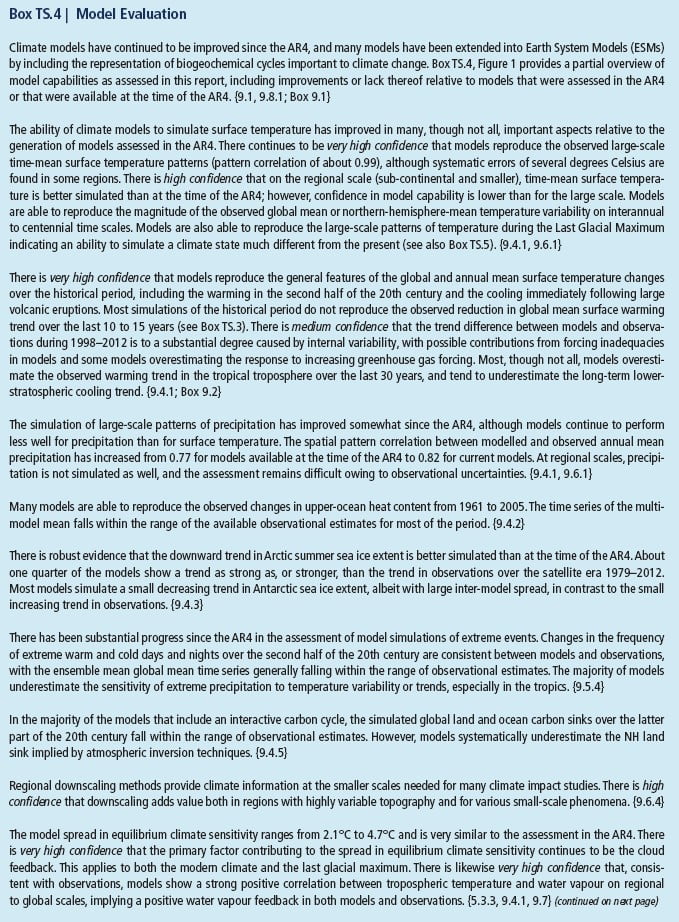
WG1 Box TS.4a and Box TS.4b Model Evaluation
WG1 FAQ 9.1 Are climate models getting better, and how do we know?
WG1 FAQ 12.1 Why are so many models and scenarios used to project climate change?
WG2 FAQ 2 How much can we say about what society will be like in the future, in order to plan for climate change impacts?
WG 2 FAQ 22.3 Is climate change decision-making different from other kinds of decision-making?
WG3 FAQ 1.2 What causes GHG emissions?
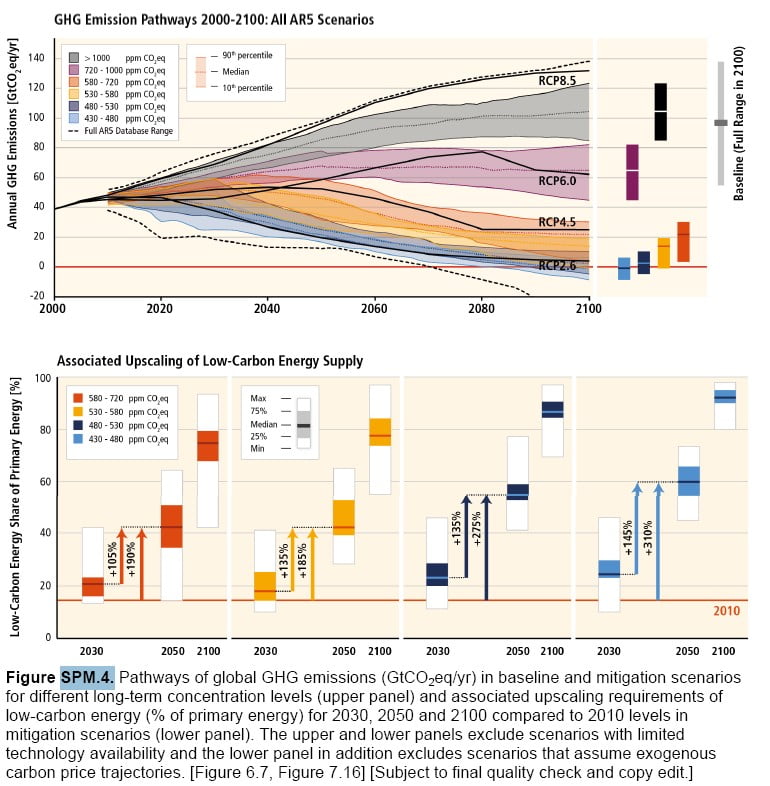
WG3 SPM Figure 4 Greenhouse gas emission scenarios
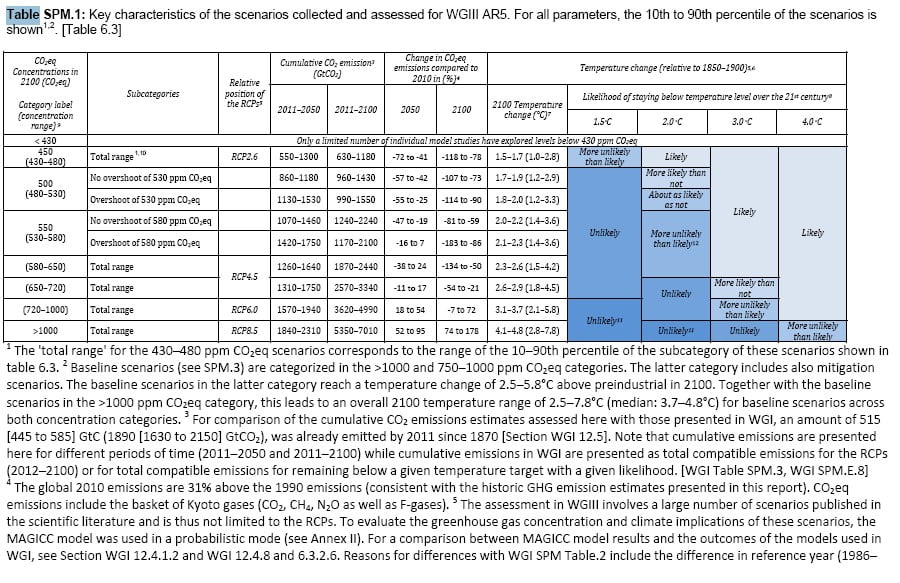
WG3 SPM table 1: Key characteristics of the emission scenarios
8) The Impact of Rising Carbon Dioxide on Plants and Ecosystems
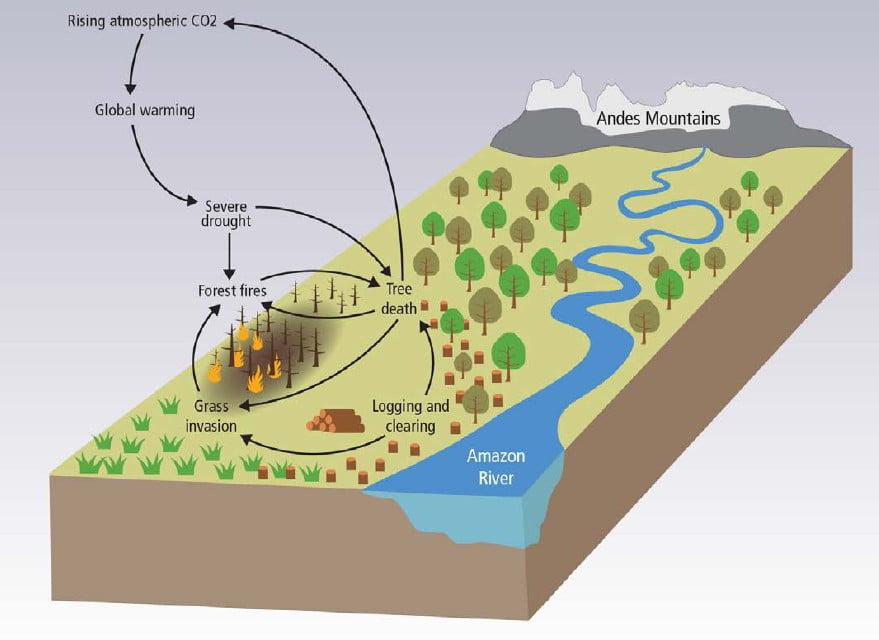
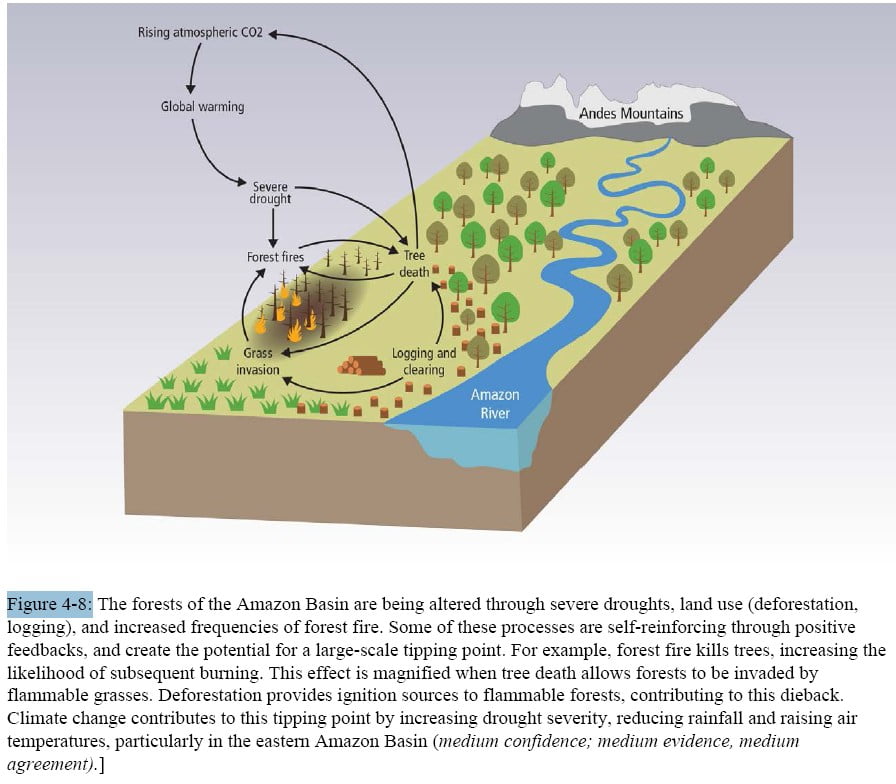
The forests of the Amazon Basin are already being altered through severe droughts, changes in land use (deforestation, logging), and increased frequencies of forest fire. Some of these processes are self-reinforcing through positive feedbacks, and create the potential for a large-scale tipping point. For example, forest fire kills trees, increasing the likelihood of subsequent burning. This effect is magnified when tree death allows forests to be invaded by flammable grasses. Deforestation provides ignition sources to flammable forests, contributing to this dieback. Climate change contributes to this tipping point by increasing drought severity, reducing rainfall and raising air temperatures, particularly in the eastern Amazon Basin.
There is a high risk that the large magnitudes and high rates of climate change this century will result in abrupt and irreversible regional-scale changes to terrestrial and freshwater ecosystems, especially in the Amazon and Arctic, leading to additional climate change.
There are plausible mechanisms, supported by experimental evidence, observations, and climate model simulations, for the existence of ecosystem tipping point in the rainforests of the Amazon basin. Climate change alone is not projected to lead to abrupt widespread loss of forest cover in the Amazon during this century. However, a projected increase in severe drought episodes, together with land-use change and forest fires, would cause much of the Amazon forest to transform to less dense, drought- and fire-adapted ecosystems. This would risk reducing biodiversity in an important ecosystem, and would reduce the amount of carbon absorbed from the atmosphere through photosynthesis. Large reductions in deforestation, as well as wider application of effective wildfire management lower the risk of abrupt change in the Amazon.
IPCC links
This is Figure 4.8 from Box 4.3 in the WGII report for the 2014 IPCC 5AR.
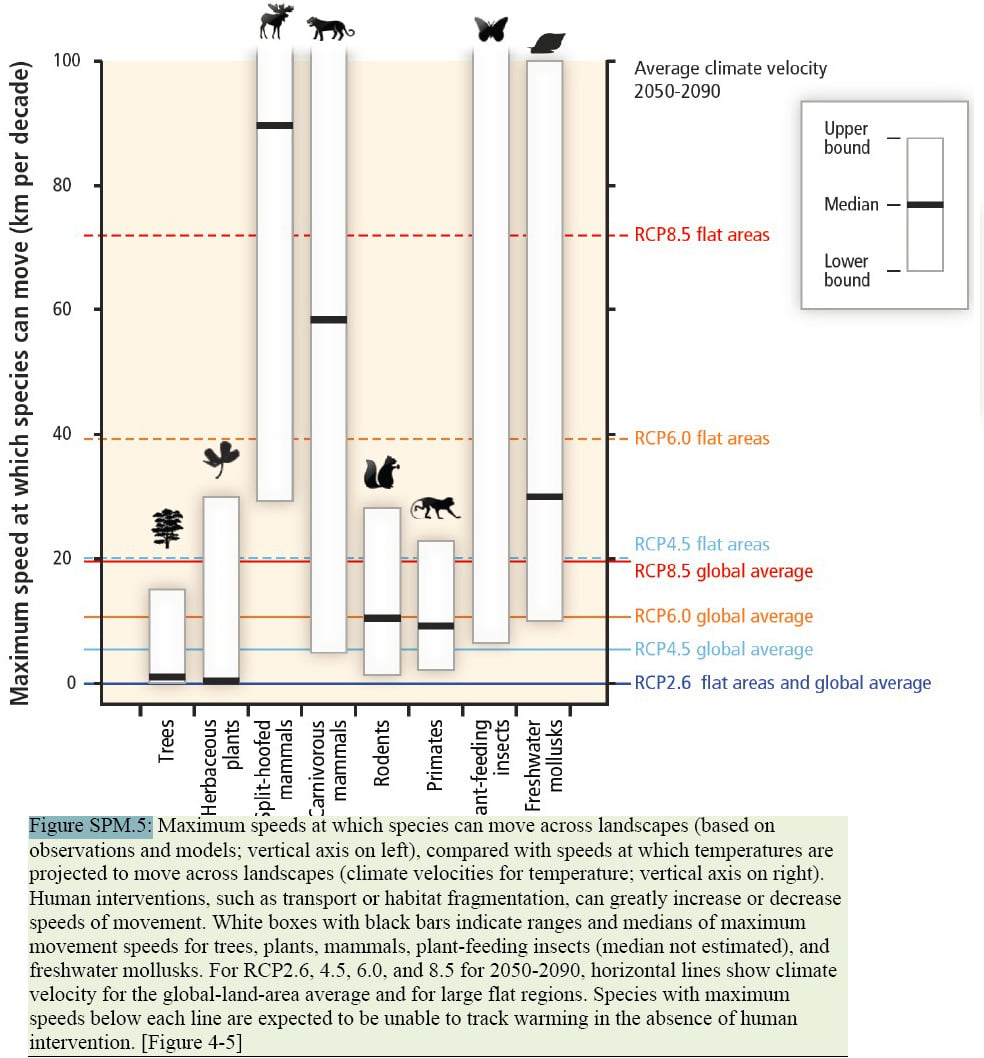
WGII Figure SPM.5 Maximum speeds at which species can move across landscapes compared with speeds at which temperatures are projected to move across landscapes
WGII FAQ 11 Why is it difficult to be sure of the role of climate change in observed effects on people and ecosystems?
WGII FAQ 4.2 What are the non-greenhouse gas effects of rising carbon dioxide on ecosystems?
WGII FAQ 4.4 How does climate change contribute to species extinction?
WGII FAQ 4.5 Why does it matter if ecosystems are altered by climate change?
9) The Methane Cycle

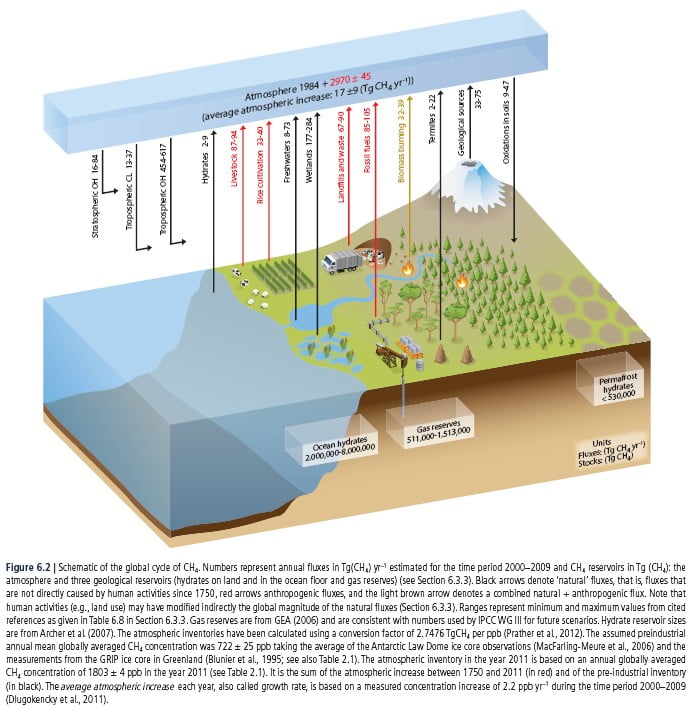
Global Methane cycle
The numbers show the 2000-2009 estimates for annual methane fluxes (changes) in Teragrams (1012g)of Methane (Tg(CH4) per year and methane reserves in Tg(CH4). The methane reserves are the atmosphere, hydrates on land, hydrates in the ocean floor and gas reserves. Methane hydrates are solids similar to ice with methane trapped in the crystal structure of water. The black arrows show natural fluxes, red arrows show fluxes directly caused by human activities since 1750 and brown arrows denote a combined natural and anthropogenic flux. Human activities may also have an indirect effect on natural fluxes, for example through land use change.
Methane absorbs infrared radiation more strongly per molecule compared to CO2. On the other hand, the methane turnover time is less than 10 years in the troposphere (much less than for CO2).
The sources of CH4 at the surface of the Earth include:
(1) Natural emissions of fossil CH4 from geological sources (marine and terrestrial seepages, geothermal vents and mud volcanoes).
(2) Emissions caused by leakages from fossil fuel extraction and use (natural gas, coal and oil industry).
(3) Pyrogenic sources resulting from incomplete burning of fossil fuels and plant biomass (both natural and anthropogenic fires).
(4) Biogenic sources including natural emissions predominantly from wetlands, from termites and very small emissions from the ocean. Anthropogenic biogenic emissions occur from rice paddy agriculture, ruminant livestock (such as cows), landfills, man-made lakes and wetlands and waste treatment. In general, biogenic CH4 is produced from organic matter under low oxygen conditions by the fermentation processes of some microbes.
Atmospheric CH4 is removed mainly by atmospheric chemical reactions with OH radicals. A smaller amount of CH4 is removed in the stratosphere through reaction with chlorine and oxygen radicals and by oxidation in well aerated soils.
For the decade of 2000–2009 methane emissions were 177 to 284 Tg(CH4)/year for natural wetlands emissions, 187 to 224 Tg(CH4)/ year for agriculture and waste (rice, animals and waste), 85 to 105 Tg(CH4)/ year for fossil fuel related emissions, 61 to 200 Tg(CH4)/year for other natural emissions including geological, termites and fresh water emissions, and 32 to 39 Tg(CH4)/ year for biomass and biofuel burning. Anthropogenic emissions account for 50 to 65% of total emissions.
Climate driven fluctuations of CH4 emissions from natural wetlands are the main drivers of the global inter-annual variability of CH4 emissions, with a smaller contribution from the variability in emissions from biomass burning during high fire years.
Atmospheric Methane Concentrations
Past changes in atmospheric greenhouse gas concentrations can be determined with very high confidence from polar ice cores. Between 1750 and 2011, CH4 increased by 150% from 722 ppb to 1803 ppb. Present-day (2011) concentrations of atmospheric methane (CH4) exceed the range of concentrations recorded in ice cores during the past 800,000 years. The current rate of increase in atmospheric concentration of CH4 is also unprecedented with respect to the highest resolution ice core records of the last 22,000 years.
| Summary: Methane concentrations in the atmosphere are rising which is problematic as methane causes more warming per molecule in the atmosphere than carbon dioxide. The methane concentration is a lot lower than the carbon dioxide concentration but is higher than it has been in at least the last 800 000 years. |
IPCC links
This is figure 6.2 from WG1 of the 2013 IPPC 5AR
WG1 FAQ 6.1 Could rapid release of methane and carbon dioxide from thawing permafrost or ocean warming substantially increase warming?
WG1 FAQ 12.3 What would happen to future climate if we stopped emissions today?
10) Could Geoengineering Counteract Climate Change?

An overview of some proposed geoengineering methods
Carbon Dioxide Removal methods:
- (A) Nutrients are added to the ocean (ocean fertilization), which increases oceanic productivity in the surface ocean and transports a fraction of the resulting biogenic carbon downward;
- (B) Solid minerals which are strong bases add alkalinity to the ocean, which causes more atmospheric CO2 to dissolve;
- (C) The weathering rate of silicate rocks is increased, producing dissolved carbonate minerals which are transported to the ocean;
- (D) Atmospheric CO2 is captured chemically, and stored either underground or in the ocean;
- (E) Biomass is burned at an electric power plant with carbon capture, and the captured CO2 is stored either underground or in the ocean;
- (F) CO2 is captured through afforestation and reforestation to be stored in land ecosystems.
Solar Radiation Management methods:
- (G) Reflectors are placed in space to reflect solar radiation;
- (H) Aerosols are injected in the stratosphere;
- (I) Marine clouds are seeded in order to be made more reflective;
- (J) Microbubbles are produced at the ocean surface to make it more reflective;
- (K) More reflective crops are grown;
- (L) Roofs and other built structures are whitened.
The most direct approach to reducing the effects of anthropogenic climate change is reducing greenhouse gas emissions. However, a number of ‘geoengineering’ approaches have also been proposed as temporary, or additional, interventions. Geoengineering – also called climate engineering – is defined as a broad set of methods and technologies that aim to deliberately alter the climate system in order to alleviate the impacts of climate change.
Theory, model simulations and observations suggest that some Solar Radiation Management (SRM) methods which reduce the amount of solar radiation reaching the Earth’s surface could substantially offset a global temperature rise and partially offset some other impacts of climate change. However, regionally, SRM would not precisely offset the temperature and rainfall changes caused by elevated greenhouse gases.
Numerous side effects, risks and shortcomings from SRM have been identified. For example:
- SRM might produce a small but significant decrease in global precipitation (with larger differences on regional scales).
- Stratospheric aerosols SRM could cause modest polar stratospheric ozone depletion.
- As long as GHG concentrations continued to increase, the SRM would also need to increase, exacerbating side effects. In addition, scaling SRM to substantial levels would carry the risk that if the SRM were terminated for any reason, surface temperatures would increase rapidly (within a decade or two) to values consistent with the greenhouse gas forcing, which would stress systems sensitive to the rate of climate change.
- SRM would not compensate for ocean acidification from increasing CO2.
- There could also be other as yet unanticipated consequences.
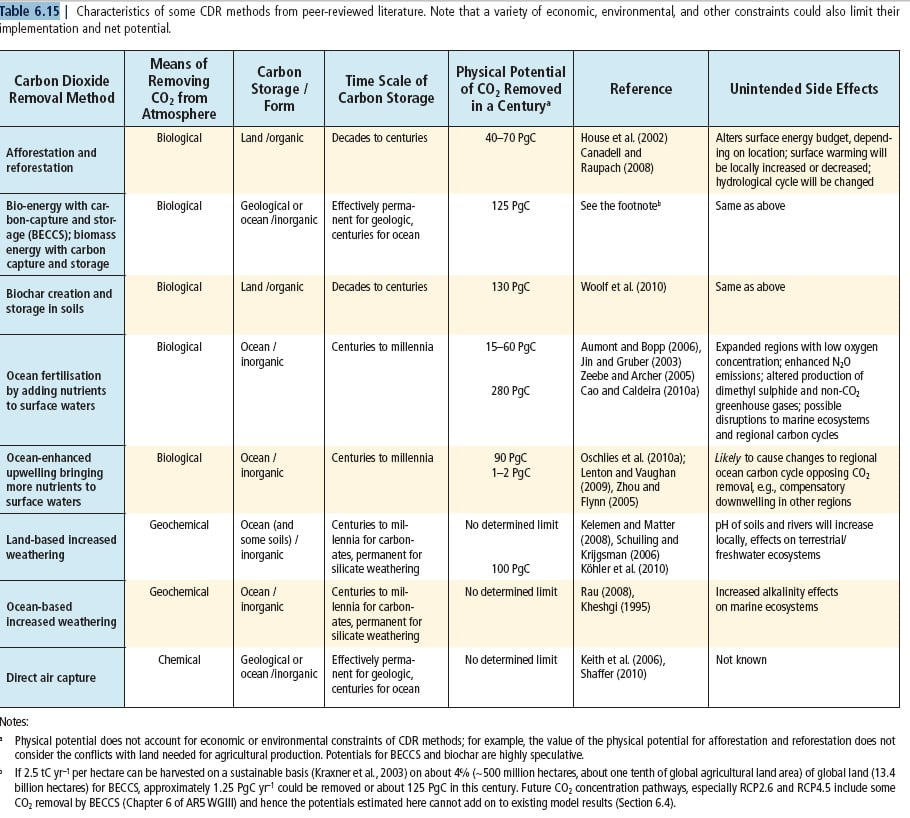
Novel ways to remove CO2 from the atmosphere on a large scale are termed Carbon Dioxide Removal (CDR) methods. These methods have biogeochemical and technological limitations to their potential. Uncertainties make it difficult to quantify how much CO2 emissions could be offset by CDR on a human time scale. CDR would probably have to be deployed at large-scale for at least one century to be able to significantly reduce atmospheric CO2. A major uncertainty is the capacity to store carbon securely with sufficiently low levels of leakage. In addition, it is virtually certain that the removal of CO2 by CDR will be partially offset by outgassing of CO2 from the ocean and land ecosystems.
CDR methods can also have associated climatic and environmental side effects:
- A large-scale increase in vegetation coverage, for instance through afforestation or energy crops, could alter surface characteristics, such as surface reflectivity. Some modelling studies have shown that afforestation in seasonally snow-covered boreal regions could in fact accelerate global warming, whereas afforestation in the tropics may be more effective at slowing global warming.
- Enhanced vegetation productivity may increase emissions of N2O, which is a more potent greenhouse gas than CO2.
- Ocean-based CDR methods that rely on biological production (i.e., ocean fertilization) would have numerous side effects on ocean ecosystems, ocean acidity and may produce emissions of non- CO2 greenhouse gases such as methane.
| Summary: One way of reducing the carbon dioxide concentration in the atmosphere is to reduce emissions. This is not popular globally and other solutions have been considered. There are potential problems with these – including that nobody would really know what might happen and who might suffer as a result of these ideas being tried. |
IPCC links
This is FAQ7.3 figure 1 from the WG1 report for the 2013 IPCC 5AR.
WG1 Table 6.14 and Table 6.15 give examples of carbon dioxide removal methods and their implications for carbon cycle and climate.
WG1 FAQ 7.3 Could geoengineering counteract climate change and what side effects might occur?
WG1 FAQ 7.1 How do clouds affect climate and climate change?
WG1 FAQ 7.2 How do aerosols affect climate and climate change?
WG1 FAQ 12.3 What would happen to future climate if we stopped emissions today?
GLOSSARY
Adaptation The process of adjustment to actual or expected climate and its effects. In human systems, adaptation seeks to moderate harm or exploit beneficial opportunities. In natural systems, human intervention may facilitate adjustment to expected climate and its effects.
Aerosols A suspension of airborne solid or liquid particles, with a typical size between a few nanometres and 10 μm, that reside in the atmosphere for at least several hours. Many act as surfaces for water droplets and ice crystals to form on.
Anthropogenic Resulting from or produced by human activities.
Biological pump The process of transporting carbon from the ocean’s surface layers to the deep ocean by the primary production of marine phytoplankton, which converts dissolved inorganic carbon (DIC), mainly CO2, and nutrients into organic matter through photosynthesis.
Climate The average weather, or more rigorously, the statistical description in terms of the mean and variability of relevant quantities over a period of time ranging from months to thousands or millions of years. The classical period for averaging these variables is 30 years, as defined by the World Meteorological Organization. The relevant quantities are most often surface variables such as temperature, precipitation and wind.
Climate Model A numerical representation of the climate system based on the physical, chemical and biological properties of its components, their interactions and feedback processes, and accounting for some of its known properties. Climate models are applied as a research tool to study and simulate the climate, and for operational purposes, including monthly, seasonal and interannual climate predictions.
Energy Budget The Earth is a physical system with an energy budget that includes all gains of incoming energy and all losses of outgoing energy. The Earth’s energy budget is determined by measuring how much energy comes into the Earth system from the Sun, how much energy is lost to space, and accounting for the remainder on Earth and energy flows between the atmosphere and the ocean or land surface.
Emissions Scenario A plausible representation of the future development of emissions of substances that potentially influence the earth’s energy budget (e.g., greenhouse gases, aerosols) and are based on a coherent and internally consistent set of assumptions about driving forces (such as demographic and socioeconomic development, technological change) and their key relationships.
Feedback An interaction in which a perturbation (change) in one climate quantity causes a change in a second, and the change in the second quantity ultimately leads to an additional change in the first. A negative feedback is one in which the initial perturbation is weakened by the changes it causes; a positive feedback is one in which the initial perturbation is increased. For example, melting ice can expose dark-coloured land. The dark-coloured land absorbs more heat than the white ice, leading to further warming and melting. This is positive feedback.
Forcings Forcing represents any external factor that influences global climate by heating or cooling the planet. They may be either natural or anthropogenic. Natural forcings include volcanic eruptions, solar variations and orbital forcing; the amount of solar energy reaching Earth changes with orbital parameters eccentricity, tilt and precession of the equinox. Anthropogenic forcing include changes in the composition of the atmosphere and land use change.
Geoengineering A broad set of methods and technologies that aim to deliberately alter the climate system in order to alleviate the impacts of climate change. Most, but not all, methods seek to either (1) reduce the amount of absorbed solar energy in the climate system (Solar Radiation Management) or (2) increase net carbon sinks from the atmosphere at a scale sufficiently large to alter climate (Carbon Dioxide Removal).
Greenhouse Gas Atmospheric gases that absorb and emit radiation at specific wavelengths within the spectrum of radiation emitted by the Earth’s surface, the atmosphere, and by clouds.
Internal variability Variations in the mean state and other statistics (such as the occurrence of extremes) of the climate on all spatial and time scales beyond that of individual weather events, due to natural, unforced processes within the climate system. Because the climate systems has components with very different response times complex dependencies, the components are never in equilibrium and are constantly varying. An example of internal variability is El Niño, a warming cycle in the Pacific Ocean which has a big impact on the global climate, resulting from the interaction between atmosphere and ocean in the tropical Pacific.
Marine carbonate pump The process of transporting carbon from the ocean’s surface layers to the ocean floor caused by marine organisms forming shells in the surface ocean. These sink, are buried in the sediments and eventually form sedimentary rocks.
Mitigation A human intervention to reduce the sources or enhance the sinks of greenhouse gases.
Reconstruction Approach to reconstructing the past temporal and spatial characteristics of a climate variable from predictors. The predictors can be instrumental data if the reconstruction is used to infill missing data or proxy data if it is an indirect measure used to develop paleoclimate reconstructions.
Solubility pump An important physic- chemical process that transports dissolved inorganic carbon from the ocean’s surface to its interior. Because carbon dioxide is more soluble in colder water, and the thermohaline circulation of the oceans is driven by cold, dense water sinking at high latitudes, deep water contains more dissolved inorganic carbon.
Stratosphere The highly stratified region of the atmosphere above the troposphere extending from about 10 km (ranging from 9 km at high latitudes to 16 km in the tropics on average) to about 50 km altitude.
Tipping point A hypothesized critical threshold when global or regional climate changes rapidly from one stable state to another stable state. The tipping point event may be irreversible.
Troposphere The lowest part of the atmosphere, from the surface to about 10 km in altitude at mid-latitudes (ranging from 9 km at high latitudes to 16 km in the tropics on average), where clouds and weather phenomena occur. In the troposphere, temperatures generally decrease with height.
Turnover time A measure of how long a component stays in a reservoir. It is the ratio of the mass M of a reservoir (e.g., a gaseous compound in the atmosphere) and the total rate of removal S from the reservoir: T = M/S. For each removal process, separate turnover times can be defined. In soil carbon biology, this is referred to as Mean Residence Time.
Uncertainty A state of incomplete knowledge that can result from a lack of information or from disagreement about what is known or even knowable. It may have many types of sources, from imprecision in the data to ambiguously defined concepts or terminology, or uncertain projections of human behaviour.
UK National Curriculum Links
KS3 chemistry – the carbon cycle
The Carbon Cycle
Changing Carbon Dioxide and Oxygen Concentrations in the atmosphere
KS3 chemistry – the production of carbon dioxide by human activity and the impact on climate.
Sources of Anthropogenic Carbon Dioxide
Changing Carbon Dioxide and Oxygen Concentrations in the atmosphere
Are People Causing Climate Change?
Quantifying the Causes of Recent Climate Change
KS3 biology – the dependence of almost all life on Earth on the ability of photosynthetic organisms, such as plants and algae, to use sunlight in photosynthesis to build o/a
rganic molecules that are an essential energy store and to maintain levels of oxygen and carbon dioxide in the atmosphere
The Effect of Rising CO2 on Plants and Ecosystems
KS3 biology – how organisms affect, and are affected by, their environment, including the accumulation of toxic materials.
The Effect of Rising CO2 on Plants and Ecosystems
GCSE chemistry/ combined science – evaluate the evidence for additional anthropogenic causes of climate change, including the correlation between change in atmospheric carbon dioxide concentration and the consumption of fossil fuels, and describe the uncertainties in the evidence base
The Earth’s Energy Balance
The Carbon Cycle
Sources of Anthropogenic Carbon Dioxide
Changing Carbon Dioxide and Oxygen Concentrations in the atmosphere
Are People Causing Climate Change?
Quantifying the Causes of Recent Climate Change
GCSE chemistry/combined science – describe the potential effects of increased levels of carbon dioxide and methane on the Earth’s climate and how these effects may be mitigated, including consideration of scale, risk and environmental implications
The Earth’s Energy Balance
The Carbon Cycle
Changing Carbon Dioxide and Oxygen Concentrations in the atmosphere
Quantifying the Causes of Recent Climate Change
Projected Effects of Increased Levels of Greenhouse Gases
The Methane Cycle
Could Geoengineering Counteract Climate Change?
GCSE physics – explain that all bodies emit radiation and that the intensity and wavelength distribution of any
GCSE physics – explain how the temperature of a body is related to the balance between incoming radiation absorbed and radiation emitted; illustrate this balance using everyday examples and the example of the factors which determine the temperature of the earth.
GCSE Biology/ Combined Science
– explain the effect of temperature, light intensity and carbon dioxide concentration on the rate of photosynthesis
– explain the interaction of these factors in limiting the rate of photosynthesis.
– explain the importance of the carbon cycle and the water cycle to living organisms
– evaluate the evidence for the impact of environmental changes on the distribution of organisms, with reference to water and atmospheric gases.
