Home » Teaching Resources » Satellites

Satellites

Facebook
Twitter
Pinterest
Print

satellites above the earthSatellites provide a huge variety of information. They carry instruments that relay telecommunications signals (telephone messages, TV pictures, emergency messages from ships and aircraft, etc.), help in navigation, measure changes in vegetation or movements in the earth’s surface and observe the atmosphere. Those that observe the atmosphere are known as weather satellites and the information they provide is used by weather forecasters, as well as others with an interest in the weather. Most people are now familiar with the pictures that are shown on the TV Weather Forecast, but there are other types of observation being made in the atmosphere.

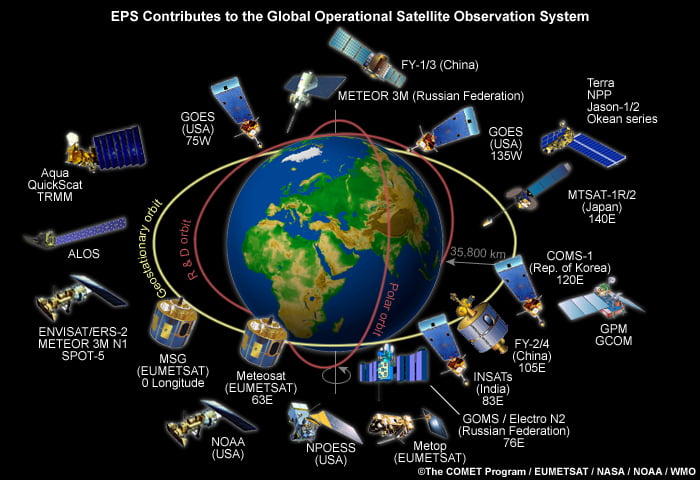
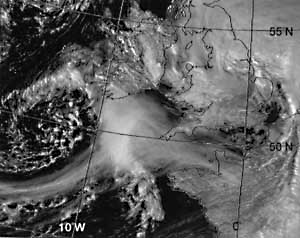
The first successful weather satellite was called TIROS1 and was launched on 1 April 1960. The subsequent launch of other observing systems has resulted in the creation of an imaging network on a truly global scale. Information is now available for inhospitable land areas and the oceans, where weather data were previously largely unavailable.

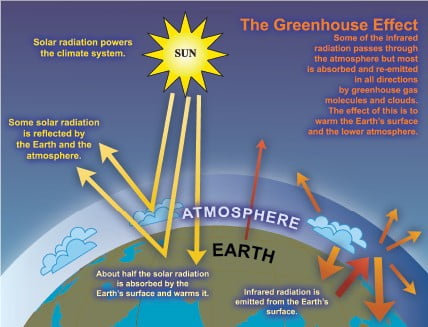
The advent of weather satellites has also provided a continuous, automatic feed of data, with a coverage and resolution (horizontal, vertical and temporal) not possible by any other means. Therefore, we can now ‘look down’ and record what is happening, and the information from satellites helps in the prediction of changes in the weather.

Types of satellite

There are two types of satellite providing weather data.

Geostationary – these are positioned at a height of 35,780 km above the equator, and ‘hang’ over the same spot on the Earth’s surface all the time. Meteosat, the geostationary satellite operated by European countries, is positioned over the equator on the Greenwich meridian and covers Africa, Europe, the Middle East, much of the Atlantic Ocean and the western Indian Ocean. The present satellite is called MSG and provides pictures every 15 minutes. It is possible to receive images with a resolution that is similar to that usually available from the much lower polar-orbiting satellites, although a very powerful computer is needed to process the data for much more than a relatively small area.

Polar-orbiting – these pass over the Earth from pole to pole. The NOAA satellites, operated by the USA, orbit at a height of around 850 km and take around 100 minutes to complete each orbit. During this time, the Earth has turned by about 25 degrees, so the satellite views a different part of the surface each time it passes. A European satellite, called MetOp-A, was launched on 19th October 2006, and is also a polar orbiter. As the orbit is much lower than that of the geostationary satellites, the images provide detailed information about the cloud structure. The UK receives images from a set of three passes, twice a day, from each satellite. The first pass is over the eastern Mediterranean, the second roughly over the UK, and the third over the eastern Atlantic. One set of passes occurs during the day and the other at night. There are also instruments that measure the temperature vertically through the atmosphere along the path of the satellite. The data from these is fed into numerical forecasting models, helping with the analysis of the state of the atmosphere and hence with the weather forecast.


satellites
Fig 1: The current global satellite network.

Satellite instrumentation

Satellites carry a variety of instruments. Some of the instruments provide the images, with which most people are familiar – these are known as radiometers. Others measure the temperature and humidity vertically through the atmosphere – these are spectrometers and interferometers. Such remote sensing instruments are called passive because they measure the radiation being emitted by various parts of the atmosphere. Active remote sensing instruments are also used. These emit radiation from a transmitting device, such as radar, towards either the earth’s surface or objects in the atmosphere, like clouds or falling rain, which reflect the radiation. The target attenuates the radiation pulse, making the reflected radiation different from the outgoing, and this difference can be measured. Such measurements are then used to assess surface wind speed, rates of rainfall and other useful parameters.

The information from spectrometers and interferometers is not available, even to weather forecasters. It is only used by numerical weather prediction models. However, the images that are created from the radiometers’ data are of immense value in both analysing and forecasting the weather, and many of them are readily available to anyone with the appropriate equipment.

Types of satellite images

Satellite images are available from a number of different channels which are used individually or in combination to reveal information about the atmosphere and surface. Two of these channels are commonly referred to as Visible and Infra-red.

Visible images

Fig 2: Example of a visible image © Copyright EUMETSAT/Met Office

One type of radiometer measures visible light and provides visible images (just like a camera taking black and white photographs). What is being viewed is sunlight that has been reflected from the Earth or clouds. In general, the brighter the cloud appears, the thicker it is. The only disadvantage of visible images, as their name suggests, is that they are only available during daylight.

Infrared images

an example of an infrared image
Fig 3: An example of an infrared image © Copyright EUMETSAT/Met Office

These are effectively measuring the temperature of the top of the cloud or, if no cloud is present, of the Earth’s surface. The images are usually prepared in such a way that cold surfaces appear white and warm ones darker.

Because of the adiabatic lapse rate, temperatures in the lower part of the atmosphere normally decrease with height, so high cloud (with low temperatures) appears white, with low cloud or the Earth’s surface appearing darker.

Unlike visible images, infrared images are available even when there is no daylight.

A combination of visible and infrared images is very useful and can help distinguish between high and low cloud. For example, if a bright area appears on both the infrared and visible images in the same place, it is likely to be thick, high cloud. However, if the area appears bright on the visible image but dark on the infrared one, it is probably low cloud or perhaps fog. On the other hand, high-level cirrus cloud is readily detected on an infrared image but, unless quite thick, is barely detectable on a visible image.

Using satellite images

Satellite images provide a ‘real-time’ view of weather systems and are available from many web sites, including Dundee University. Many schools and colleges also have systems that provide access to live weather satellite images and allow a time-lapse sequence of images to be displayed showing how weather systems develop over time.

View satellite images from the Met Office

(i) Analysing cloud patterns

In general, the clouds shown in satellite pictures can be classified as layer clouds or convective clouds. Layer clouds tend to cover large areas and are indicated on a satellite picture by an area of uniform brightness. This type of cloud is formed by either widespread condensation at low levels, often under an inversion, or by large-scale rising motion in the atmosphere, often associated with depressions or fronts. Convective clouds are usually formed by air being heated from below. Rising bubbles of air generate cloud while the surrounding descending air is cloud free. The individual clouds can be identified on a satellite picture, and it is sometimes possible to look at the build-up of thunderstorm cells.

Fig 4a: Example of layer cloud on an infrared image
Example of layer cloud on a visible image
Fig 4b: Example of layer cloud on a visible image
Fig 4c: Example of convective cloud on an infrared image
Fig 4d: Example of convective cloud on a visible image

(ii) Identifying the location of depressions (low pressure)

Satellite pictures are particularly helpful in locating depressions and fronts. Depressions can be picked out by their distinctive swirl of cloud, and frontal systems can often be seen as a wishbone-shaped area of cloud radiating from a depression. A cold front is often clearly shown as a distinctive trailing edge of the left-hand prong of the wishbone pattern.

Example of a depression on a infrared image
Fig 5: Example of a depression on a infrared image © Copyright EUMETSAT/Met Office

(iii) Inferring the location of anticyclones (high pressure)

In anticyclones, the air is descending and warming – this means that thick cloud will not form, so areas of high pressure, especially blocking anticyclones, can easily be identified by the absence of high-level cloud and the ground and coastline can often be seen on the image.

Example of a cloud free anticyclone on a visible image
Fig 6: Example of a cloud free anticyclone on a visible image © Copyright EUMETSAT/Met Office

(iv) Estimating wind speeds and the movement of frontal systems

It is possible to estimate wind speed from the movement of clouds in a succession of images from geostationary satellites. A small section of cloud is identified and tracked through several images. Infrared images are used, since the temperature of the cloud top can be used to assess its height. Errors occur due to changes in the height of the cloud top as it grows or decays and mislocation of the area due to changes in size and shape. The movement of fronts is tracked by the movement of the cloud mass associated with the front.


Fig 7: Example showing the movement of frontal systems on an infrared image © Copyright EUMETSAT/Met Office

It should be remembered that fronts move at different speeds along their length and the surface front may well not move at the same speed as the higher-level cloud seen in the image.


The speed of the surface wind can be measured using an instrument known as Synthetic Aperture Radar (SAR). This can measure the speed of individual wavelets on the sea surface, from which the surface wind is inferred. The measurement is not possible when cloud is present.

(v) Studying global pressure belts

Whole Earth images allow the location of high and low pressure belts to be identified on the global scale. By looking at images from different times of the year, it is possible to see how these belts shift. If images are available from over the Indian Ocean, it is possible to watch the build-up of the Indian Monsoon.

Fig 8: A global infrared image © Copyright EUMETSAT/Met Office

(vi) Analysing daily temperature changes

A series of daily images can help show diurnal temperature variations as well the contrasts between land and sea temperatures.

Fig 9: Infrared image 11 May 2005 0000 GMT

(vii) Tracking the movement of tropical storms

Fig 11: Infrared image of Hurricane Rita 23 September 2005 © Copyright NOAA
Fig 11: Infrared image of Hurricane Rita 23 September 2005

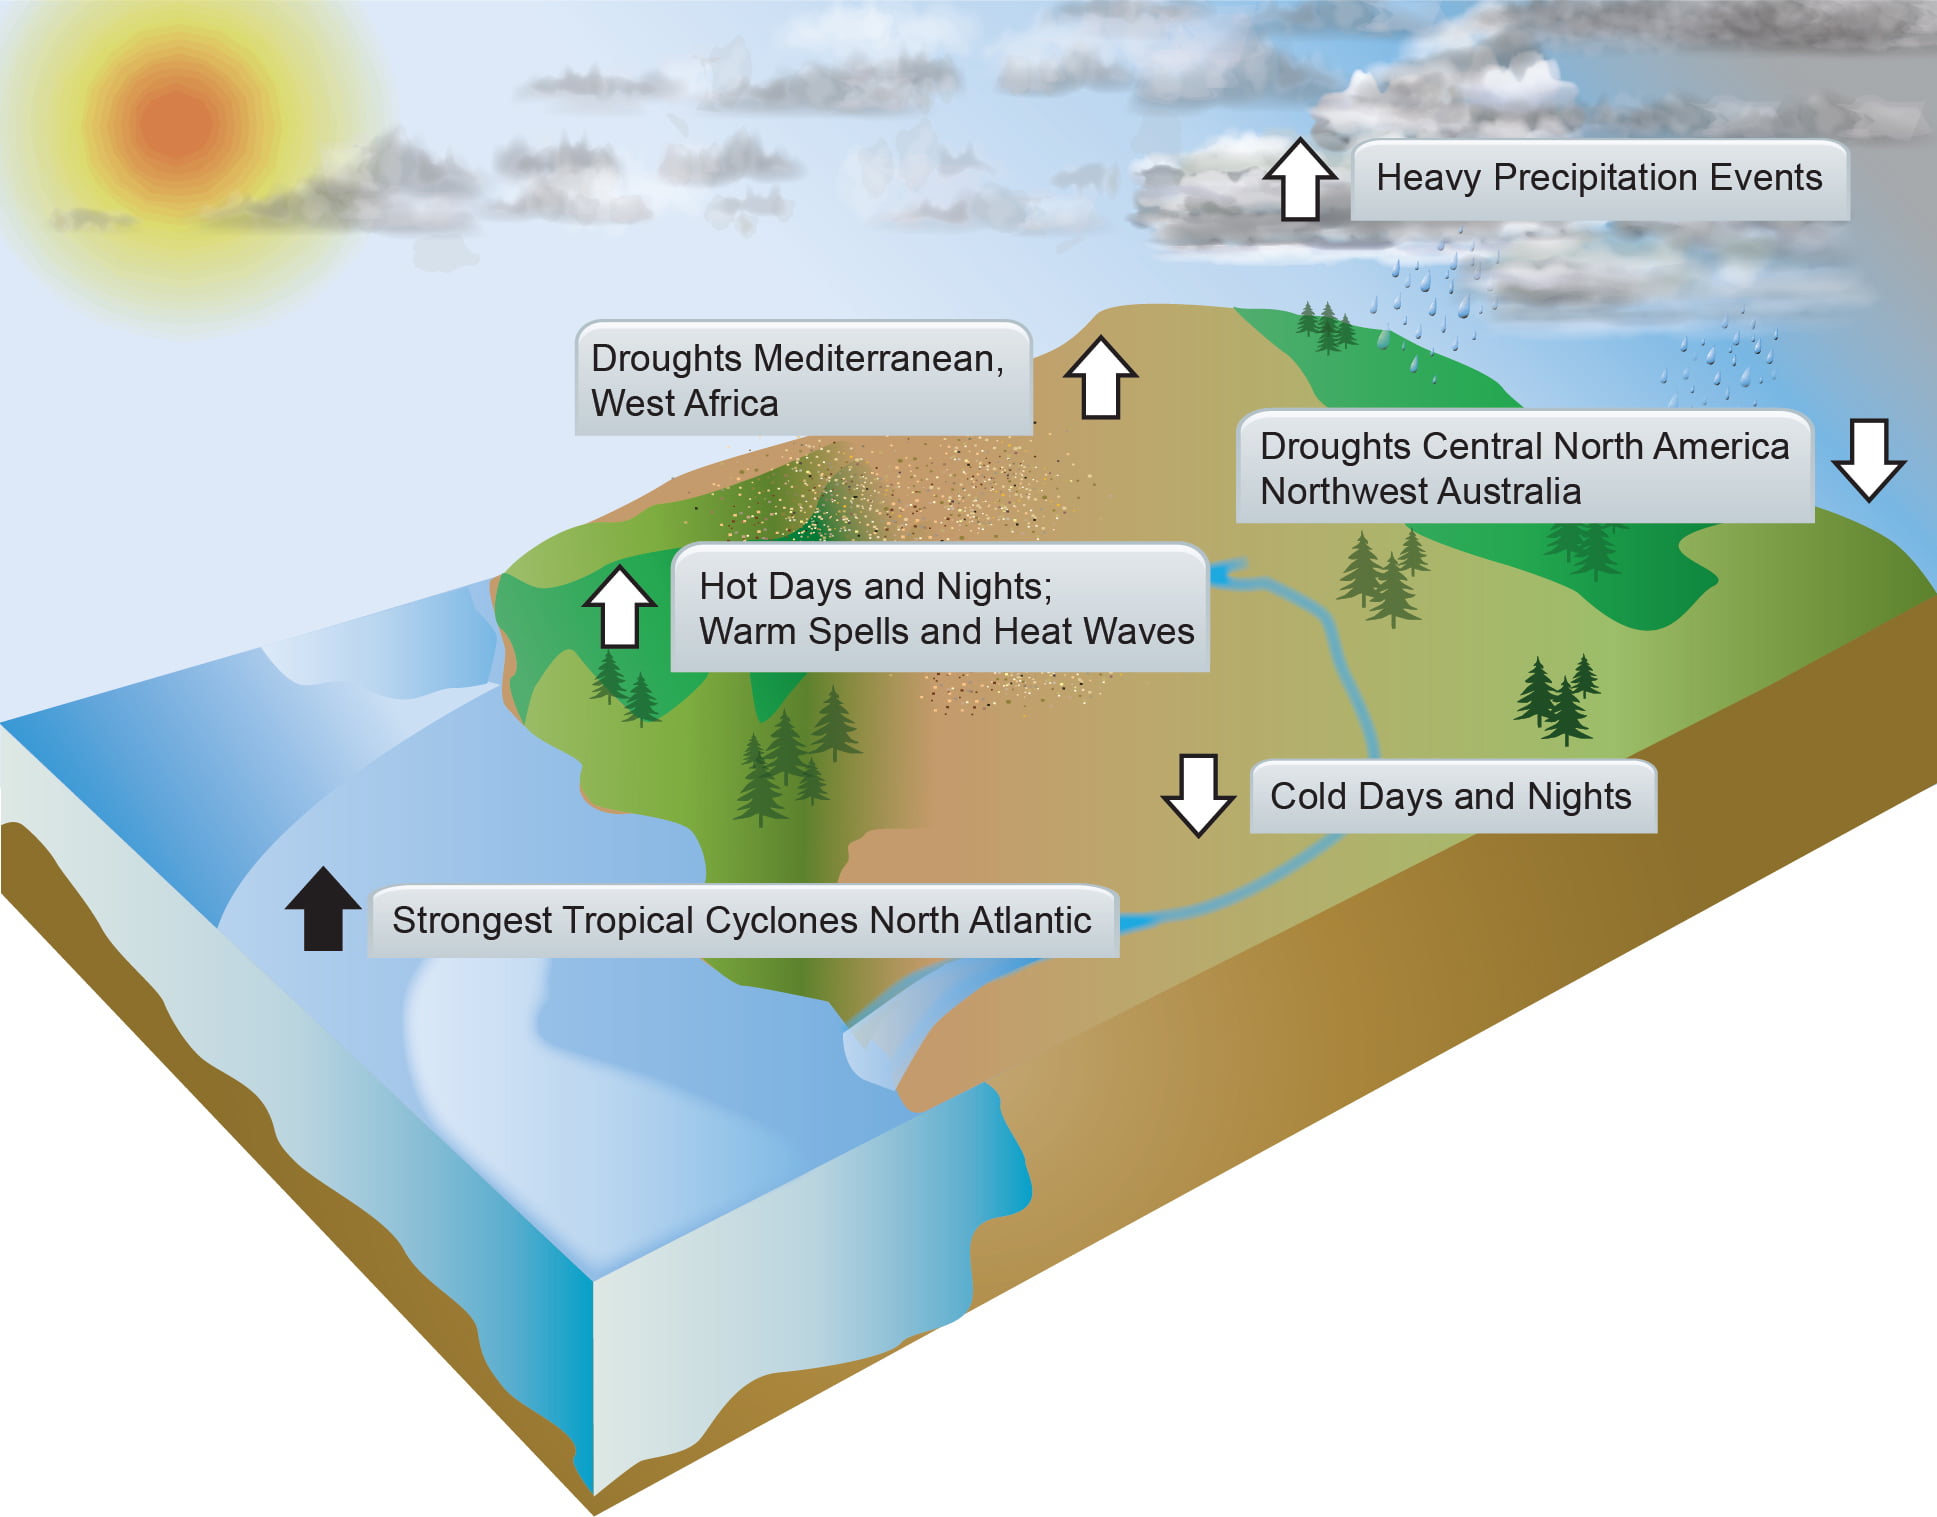
Satellite images can be easily used to identify tropical storms by spotting the characteristics swirls of cloud surrounding the clear central eye of the storm. The size of the hurricane can be measured, along with the speed and direction of movement.

Future satellite programmes and research

Satellites and their instruments require a significant level of investment in order to be designed and built, while their launch has a higher risk of failure than installing other observational platforms. Operational costs are also high, but as these notes show, the benefits of satellite technology images are huge, providing large quantities of usable and relevant data on a global scale.

With each new generation of satellites, a new opportunity is presented in using the latest instrument technology. There is now a new generation of Meteosat satellites, known as Meteosat Second Generation (MSG). The first of these was MSG-1, and this was launched in 2002.

A second and third (MSG-2: Meteosat-9, MSG-3: Meteosat-10) have now been in use for some years, with MSG-3 being the operational European geostationary satellite at the moment. Its radiometers can provide images with a similar resolution to those on polar orbiting satellites. There are additional instruments to measure the Earth’s radiation budget, which will be essential for climate studies, and to provide Search and Rescue (SAR) communications.

MSG-4: Meteosat-11 is due to be launched in 2015.

Satellite acronyms

EUMETSAT – this is the European organisation that designs, builds and launches satellites, and the United Kingdom is represented by the Met Office.

MSG – Meteosat Second Generation

GOES – Geostationary Operational Environment Satellite

INSAT – Indian National Satellite

NOAA – National Oceanic and Atmospheric Administration (US Department of Commerce)


Satellites lesson plan


Web page reproduced with the kind permission of the Met Office

Start exploring

Latest from blog

Related resources …

Secondary Maths, Secondary Science
Numerical activity calculating total speed (velocity) of an aircraft.
Secondary Science
A series of downloadable lesson plans and teacher’s notes for science GCSE based on using the Gravity field and steady state Ocean Circulation Explorer
Secondary Geography, Secondary Science
In this section you will find a step-by-step guide to climate change. The information is written by climate experts using known facts and the
Secondary Geography, Secondary Science
Some Figures and Tables from the IPCC 2013 Fifth Assessment Report WG1 – The Physical Science Basis Copyright for all figures: IPCC, 2013: Climate Change