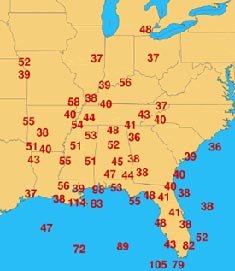
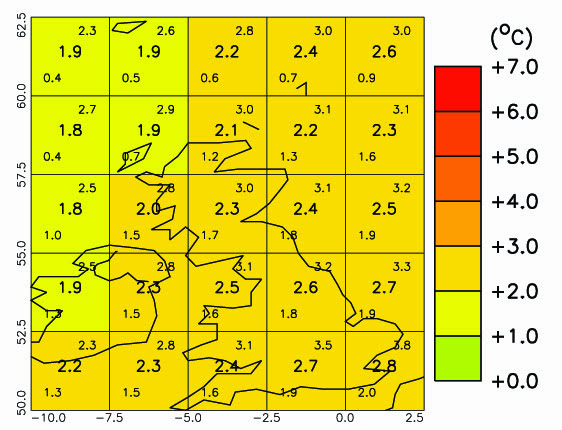
Home » Teaching Resources » Case Study – Hurricane Katrina

Case Study – Hurricane Katrina

Facebook
Twitter
Pinterest
Print

At least 1,500 people were killed and around $300 billion worth of damage was caused when Hurricane Katrina hit the south-eastern part of the USA. Arriving in late August 2005 with winds of up to 127 mph, the storm caused widespread flooding. 

Physical impacts of Hurricane Katrina

Aftermath

Physical impacts of Hurricane Katrina

Flooding
Hurricanes can cause the sea level around them to rise, this effect is called a storm surge. This is often the most dangerous characteristic of a hurricane, and causes the most hurricane-related deaths. It is especially dangerous in low-lying areas close to the coast.

There is more about hurricanes in the weather section of the Met Office website https://www.metoffice.gov.uk/research/weather/tropical-cyclones/facts

Hurricane Katrina tracked over the Gulf of Mexico and hit New Orleans, a coastal city with huge areas below sea-level which were protected by defence walls, called levees. The hurricane’s storm surge, combined with huge waves generated by the wind, pushed up water levels around the city.

The levees were overwhelmed by the extra water, with many collapsing completely. This allowed water to flood into New Orleans, and up to 80% of the city was flooded to depths of up to six metres.

Hurricane Katrina also produced a lot of rainfall, which also contributed to the flooding.

In pictures

House and car destroyed by the hurricane
Flooded New Orleans street
Boat on top of a house

Strong winds
The strongest winds during 25-30 August were over the coastal areas of Louisiana and Florida. A map of the maximum wind speeds which were recorded during the Hurricane Katrina episode is shown. Although the winds did not directly kill many people, it did produce a storm surge over the ocean which led to flooding in coastal areas and was responsible for many deaths.
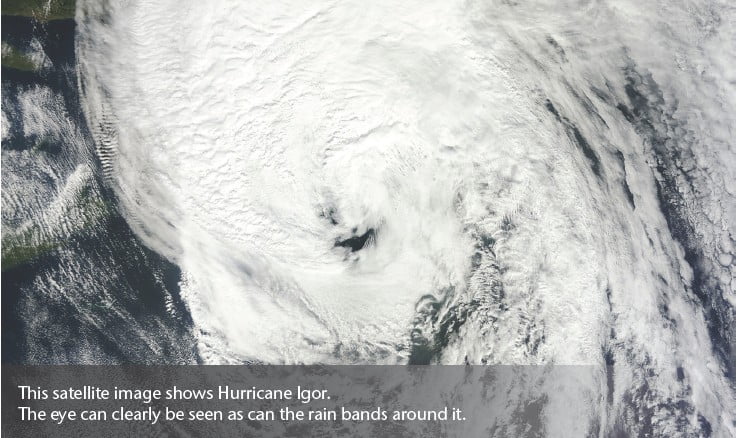
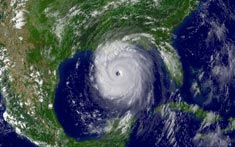
Satellite Image

hurricane katrina
Fig. 1 Satellite Image of Hurricane Katrina, 28 August 2005 at 2045 GMT. Courtesy NOAA/CIMSS/SSEC.

Illustration

Fig 2. Illustration showing different wave heights on a shoreline. Image courtesy of NOAA.

Tornadoes
Hurricanes can create tornadoes. Thirty-three tornadoes were produced by Hurricane Katrina over a five-day period, although only one person died due to a tornado which affected Georgia.

Impact on humans

  • 1,500 deaths in the states of Louisiana, Mississippi and Florida.
  • Costs of about $300 billion.
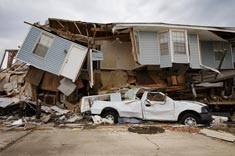
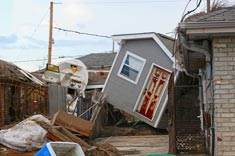
  • Thousands of homes and businesses destroyed.
  • Criminal gangs roamed the streets, looting homes and businesses and committing other crimes.
  • Thousands of jobs lost and millions of dollars in lost tax incomes.
  • Agricultural production was damaged by tornadoes and flooding. Cotton and sugar-cane crops were flattened.
  • Three million people were left without electricity for over a week.
  • Tourism centres were badly affected.
  • A significant part of the USA oil refining capacity was disrupted after the storm due to flooded refineries and broken pipelines, and several oil rigs in the Gulf were damaged.
  • Major highways were disrupted and some major road bridges were destroyed.
  • Many people have moved to live in other parts of the USA and many may never return to their original homes.
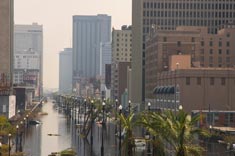
Aftermath

The broken levees were repaired by engineers and the flood water in the streets of New Orleans took several months to drain away. The broken levees and consequent flooding were largely responsible for most of the deaths in New Orleans. One of the first challenges in the aftermath of the flooding was to repair the broken levees. Vast quantities of materials, such as sandbags, were airlifted in by the army and air force and the levees were eventually repaired and strengthened.

Although the USA is one of the wealthiest developed countries in the world, it highlighted that when a disaster is large enough, even very developed countries struggle to cope.

Weather Map

Fig 3. Map of America showing highest wind speeds. Image courtesy of NOAA.

Web page reproduced with the kind permission of the Met Office

Start exploring

Latest from blog

Related resources …
Secondary Geography
A Met Office forecaster was working on secondment in Bermuda during hurricane Igor. Some thoughts were gathered from somebody who experienced it in person.