Home » Teaching Resources » Case Study – Heatwave

Case Study – Heatwave

Facebook
Twitter
Pinterest
Print

The heatwave of 2003

More than 20,000 people died after a record-breaking heatwave left Europe sweltering in August 2003. The period of extreme heat is thought to be the warmest for up to 500 years, and many European countries experienced their highest temperatures on record.

Physical Impacts

Effects of the heatwave

Immediate responses to the heatwave

What happened to cause the heatwave?

Physical Impacts

Low river flows and lake levels
The River Danube in Serbia fell to its lowest level in 100 years. Bombs and tanks from World War 2, which had been submerged under water for decades, where revealed, causing a danger to people swimming in the rivers. Reservoirs and rivers used for public water supply and hydro-electric schemes either dried up or ran extremely low.

Forest fires
The lack of rainfall meant very dry conditions occurred over much of Europe. Forest fires broke out in many countries. In Portugal 215,000 hectares area of forest were destroyed. This is an area the same size as Luxembourg. It is estimated millions of tonnes of topsoil were eroded in the year after the fires as the protection of the forest cover was removed. This made river water quality poor when the ash and soil washed into rivers.

The satellite image shown in Fig. 1 shows forest fires in southern Portugal and Spain in September 2003. The fires are shown by the red dots and smoke is in white.

Melting glaciers
Extreme snow and glacier-melt in the European Alps led to increased rock and ice falls in the mountains.

Effects of the heatwave

About 15,000 people died due to the heat in France, which led to a shortage of space to store dead bodies in mortuaries. Temporary mortuaries were set up in refrigeration lorries. There were also heat-related deaths in the UK (2,000), Portugal (2,100), Italy (3,100), Holland (1,500) and Germany (300).

Human effects

  • Heat-stroke — normally we sweat, and this keeps us cool on hot days. On very hot days our bodies may not be able to keep cool enough by sweating alone, and our core body temperature may rise. This can lead to headaches, dizziness and even death.
  • Dehydration — this is the loss of water from our bodies. It can cause tiredness and problems with breathing and heart rates.
  • Sunburn — damage to the skin which can be painful and may increase the risks of getting skin cancer.
  • Air pollution — it is thought that one third of the deaths caused by the heatwave in the UK were caused by poor air quality.
  • Drowning — some people drowned when trying to cool off in rivers and lakes.

The Met Office provides the Department of Health with heatwave warnings (Heat-Health Watch) to prepare the NHS, health professionals, carers and the general public for the effects of extreme heat.

Summers as hot as 2003 could happen every other year by the year 2050 as a result of climate change due to human activities.

Environment and social effects

  • Water supplies — drinking water supplies were affected in some parts of the UK and hosepipe bans introduced.
  • Tourism — many parts of the UK reported increased levels of tourism as people decided to holiday in the UK while the weather was unusually dry and hot.
  • Agriculture — many chickens, pigs and cows died during the heat in Europe and crops failed in the dry conditions. This led to higher food prices. It is thought to have cost European farming 13.1 billion euros.
  • Transport — some railway tracks buckled in the heat. The London Underground became unbearable. Some road surfaces melted. Low river levels prevented some boats from sailing.
  • The London Eye closed on one day as it became too hot in the cabins.
  • Energy — two nuclear power plants to close down in Germany. These rely on water for cooling in the power generation process.

In pictures

Fig 1. Satellite image.
A river with low levels of water
A forest fire
A forest fire
Family playing on the beach

Immediate responses to the heatwave

  • France requested aid from the European Union to deal with the effects.
  • Public water supply shortages occurred in several countries, including the UK and Croatia, which led to a temporary ban on using hose pipes.
  • TV news, internet and newspapers informed the public on how to cope with the heat — drinking plenty of water, wearing cool clothing, and staying in the shade in the middle of the day.
  • Network Rail in the UK imposed speed restrictions for trains when the temperature was above 30 °C. This was to help avoid trains derailing when railway lines might have buckled
  • Workers around Europe altered their working hours. Some refuse collectors started earlier to pick up rapidly decomposing rubbish from the streets.

What happened to cause the heatwave?

Weather chart

Fig 2. Weather Chart for midday on 5 August 2003.

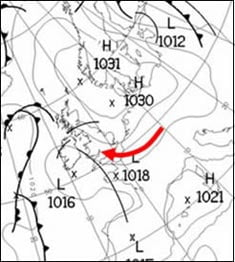
It shows an area of high pressure over most of Western Europe. Air is moving around the high in a clockwise direction, bringing a hot, dry tropical continental air mass to the UK at this time. This pattern occurred for much of the rest of the month. High pressure areas usually bring little cloud and warm conditions in summer.

You can find out more about weather charts in the weather section of the Met Office website.

Satellite imagery
The satellite images below confirm there is very little cloud over most of Europe.

Fig 3. Satellite Image of north-west Europe at 2 p.m. on 5 August.

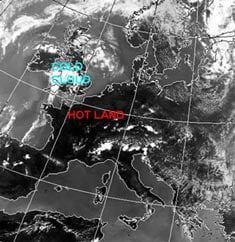
Fig. 3 shows a visible satellite image of north-west Europe at 2 p.m. on 5 August. Visible satellites show what you would see if you were in space looking down at Earth. White areas show were there is cloud, the brighter the shading the deeper the cloud. The dark areas show cloud free areas. On Figure 12, the darker areas over most of Europe show the area has thin or little cloud.

Fig 4. Satellite Image for north-west Europe at 2 p.m. on 5 August.

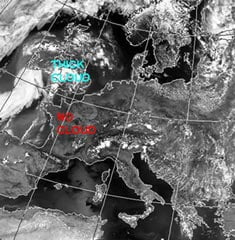
Fig. 4 shows an infrared satellite image for north-west Europe at 2 p.m. on 5 August. Infrared satellite images measure the temperature of the cloud or ground surface. The dark areas show surfaces that are warm and where there is no cloud. The whiter shading indicates cold cloud. The darker the shading of the land, the hotter it is.


You can find out more about satellites on the MetLink website.

Maximum temperatures
Many parts of Europe saw their temperature records broken during this summer, including the UK. A sweltering 39 °C was recorded in Brogdale in Kent on 10 August 2003, a record high which still stands today.

European rainfall
Rainfall over much of Europe was below what is normally expected during the months of June, July and August. The long-lasting high pressure system tended to reduce the amount of rain that fell.

As a result of the European heatwave:

  • A joint Met Office/Department of Health project called the Heat-Health Watch now gives advanced warning of UK hot. weather. It operates every summer from 1 June to 15 September.
  • The French government has made efforts to improve its prevention, surveillance and alert system for people such as the elderly living alone.

Further information on the Met Office main site
Met Office Event Summary

Further information on other websites
BBC News articles on the August 2003 European heatwave

Web page reproduced with the kind permission of the Met Office

Start exploring

Latest from blog

Related resources …
Secondary Geography
Residents had little time to react. Cars were swept out to sea, buildings were badly damaged and people had to act quickly to survive.