Home » Maths for Planet Earth » Surviving Species

Surviving Species

Facebook
Twitter
Pinterest
Print

Climate change affects the habitats and environments of many species, some of which won’t be able to adapt fast enough to survive in their new habitats.

The graph shows the percentage of species driven extinct since 1500. Of the species that were around in 1500
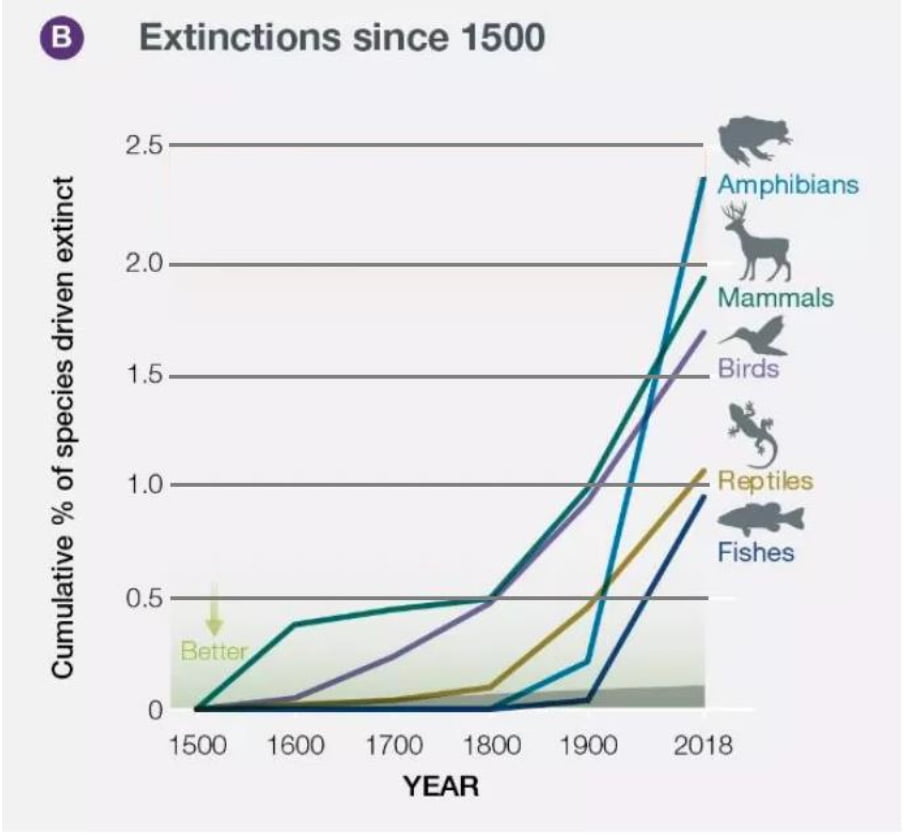
Diagram showing Extinctions since 1500

a) Calculate the probability of a reptile species having gone extinct by 1900. 

[1 marks]

b) Calculate the probability of an amphibian species not having gone extinct by 2018. 

[1 marks]

c) Of a sample of 60,000 species alive in 1500, assuming equal numbers of amphibian, mammal, bird, reptile and fish species are included, find, by first taking an average, how many species you would expect to have not gone extinct by 2018.

[3 marks] 
Start exploring

Latest from blog

More Maths for Planet Earth

A Level
In a simple model, the surface area, S km2, of a shrinking rainforest depends on the time, t, in years since 1980. The following
GCSE
The graph shows satellite measurements of global sea level rise since 2000 plotted relative to 1993. (sea level rise measured in mm = millimetres)
GCSE
The graph below shows how temperature has varied with time. The grey line shows monthly temperatures and the orange line shows an estimate of
GCSE
The pie chart shows information about students going to a ‘Fridays for Future’ climate strike. 3360 more female students went to the strike than