A Quadratic Emissions Model

The graph shows the rate of CO2 emissions per year since 1800.

Global Carbon Dioxide Emissions Graph

A climate scientist thinks that a quadratic curve could be fitted to the data, where the x axis is years since 1800, and the y axis is the rate of CO2 emissions per year (GtCO2 year-1). 

This curve would be of the form \(y = Ax^{2} + Bx + C\).

a) By using the points (166 , 42), (106 , 14) and (10 , 3), taken from the best fit lines on the graph shown above, evaluate the coefficients A, B, and C  in this model.

[4 marks]

b) By finding the minimum point of the curve, assess the suitability of this model as a fit for the data.

[3 marks]

Warming up a Solar Cell

The temperature T˚C of a solar cell during a 24 hour period is modelled as 

\[T = 20 – k\left( 15 – \frac{5t}{4} \right)^{2}\ ,\ \ \ 0 \leq t \leq 24\]

Where t is the time in hours after midnight and k is a positive constant

The temperature of the solar cell at midnight is 5˚C.

a) Use this information to find the value of k in the model.

[2 marks]

b) Find, according to the model, the temperature of the solar cell at 8:30 am.

[2 mark]

c) Determine the greatest temperature of the solar cell and the time at which this temperature occurs.

[3 marks]

d) State one limitation of the model

[1 mark]

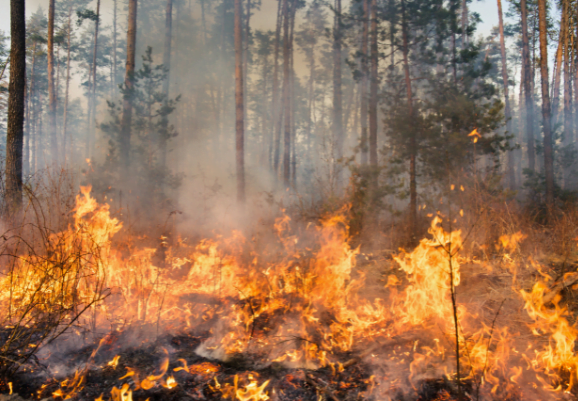
A Ferocious Forest Fire

During a particularly hot summer, the area of a small forest was reduced by fire. The area, Akm2, of the surviving forest is modelled as being inversely proportional to t, the time in days since the start of the fire.

a) 5.5 days after the fire started, the area of the surviving forest was 2.6 km2. Find the constant of proportionality, k.

[2 marks]

b) Sketch the graph of A against t, stating the equations of any asymptotes.

[2 marks]

c) Suggest one reason why this model has the restriction t ≥ 1

[1 mark]

d) Suggest a refinement to this model that might make it more accurate

[1 mark]

Profiting from Reforestation

A small company is planting trees in areas of the Amazon rainforest that have been affected by forest fires.

On any day, the cost to the company, $y, of planting x trees is modelled to be the sum of two elements:

  • a fixed cost
  • a cost that is proportional to the number of trees planted that day

a) Write down a general equation linking y with x for this model.

[2 marks]

The company is subsidised $2 by the government for each tree planted.

On a day when 80,000 trees are planted, the company makes a profit of £500

On a day when 30,000 trees are planted, the company makes a loss of £80

Using the above information,

b) Show that \(y =  0.84x + 428\)

[3 marks]

c) With reference to the model, interpret the significance of the value 0.84 in the equation.

[1 mark]

d) Find the least number of trees that must be planted on any given day for the company to make a profit that day.

[3 marks]