A Hurricane Direction Shift

The movement of a hurricane is modelled by vector h. 

It is moving at a speed of 20 kph, with the direction of 165˚ above the equator, when portrayed on a flat map of the Earth. 

a) Write h in component form.

[2 marks]

The hurricane makes landfall. Its movement is now modelled by vector l, \(\left( \frac{15\sqrt{3}}{2}\mathbf{\text{i}},\mathbf{\ }\frac{15}{2}\mathbf{j} \right)\).

b) Find the amount by which the hurricanes speed has decreased and state the hurricanes new direction.

[3 marks]
Monitoring Currents

In this question, all distances are measured in kilometres.

2 deep sea ocean current monitors, A and B, have position vectors (-1, 7, k) and (4, 1, 10) respectively, relative to a fixed origin. Given that the distance from A to B is \(5\sqrt{5}\)km,

a) Find the possible values of the constant k.

[3 marks]


b) For the larger value of k, find the unit vector in the direction of \(\overrightarrow{\text{OA}}\)

[3 marks]

Colliding Currents

2 deep sea ocean currents meet.

By modelling one current as the positive y axis.

a) Find the angle that the second current, with vector \(4\mathbf{i – j}\), makes with the first current when they meet.

[3 marks]

A Regrowing Reef

a) Use the substitution \(u = 4 – \sqrt{s}\) to show that

\[\int_{}^{}\frac{\text{dh}}{4 – \sqrt{s}} = – 8\ln\left| 4 – \sqrt{s} \right| – 2\sqrt{s} + k\]

where k is a constant

[6 marks]


A coral reef is growing back after global temperatures are reduced from their peak value.

The rate of change of area covered by the reef is modelled by the differential equation

\[\frac{\text{ds}}{\text{dt}} = \frac{t^{0.25}(4 – \sqrt{s})}{20}\]

Where s is the surface area of the reef in m2 and t is the time, in years, after the reef begins to regrow.

b) Find, according to the model, the range of areas that could be covered by the coral reef. 

[2 marks]

The coral reef has a surface area of 1m2 when it starts to regrow.

According to the model,

c) Calculate the time this reef would take to cover 12 m2, giving your answer to 3 significant figures.

[7 marks]

Deep-Sea Bubbles

Deep sea vents can emit harmful gases, such as hydrogen sulphide. Since these bubbles are small, they shrink once they leave the vent, as the gases dissolve into the ocean.

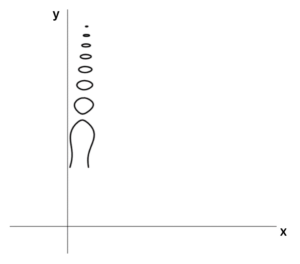
An autonomous submarine takes a photograph of these bubbles that looks like this graph sketch. 

deep-sea bubbles

A scientist discovers that the surface of the bubbles visible in this photograph can be represented by the curve:

\[\sin\frac{y^{3}}{100} + e^{- x}y + x^{2} = 5\ ,\ y > 5\]

By first using implicit differentiation to show that

\[\frac{\text{dy}}{\text{dx}} = \frac{100(y – 2e^{x}x)}{3e^{x}y^{2}\cos\frac{y^{3}}{100} + 100}\]

Show that at the turning points on the curve, where \(\frac{\text{dy}}{\text{dx}} = 0\), \(y = 2xe^{x}\)

[8 marks]

A Speedy Sea Current

An ocean current separates into 2 different currents at a small island that can be modelled as the origin. Current A heads due south and current B heads on a bearing of 100˚. 

An oceanographer wants to measure the relative surface speeds of these two separate currents, by placing buoys in them off the island and measuring the distance travelled by the buoy in 20 hours.

After 20 hours, the buoy in current A has travelled 150km whilst the buoy in current B has travelled 250km.


a)
 Find the average speeds of the two ocean currents.

[2 marks]

b) Calculate the final distance between the buoys.

[2 marks]

c) Θ is the final bearing of the buoy in current B from the buoy in current A. Show that \(\frac{\sin\theta}{\sin{80}} = 0.93\) to 2 decimal places.

[3 marks]

d) Find the area of the triangle with the island and the two buoys as its
vertices.

[3 marks]

The Rates of Sea Level Rise

The graph shows satellite measurements of global sea level rise since 2000. 

(mm = millimetres)

the rates of sea level rise chart

a) Draw a line of best fit through the data between 1993 and 2010, and work out the rate of global sea level rise.

[3 marks]

b) Draw a line of best fit through the data between 2010 and 2018, and work out the rate of global sea level rise. 

[3 marks]

c) What does the difference between the rate in part b) and the rate in part c) tell us about how global sea level rise is changing? 

[1 mark]

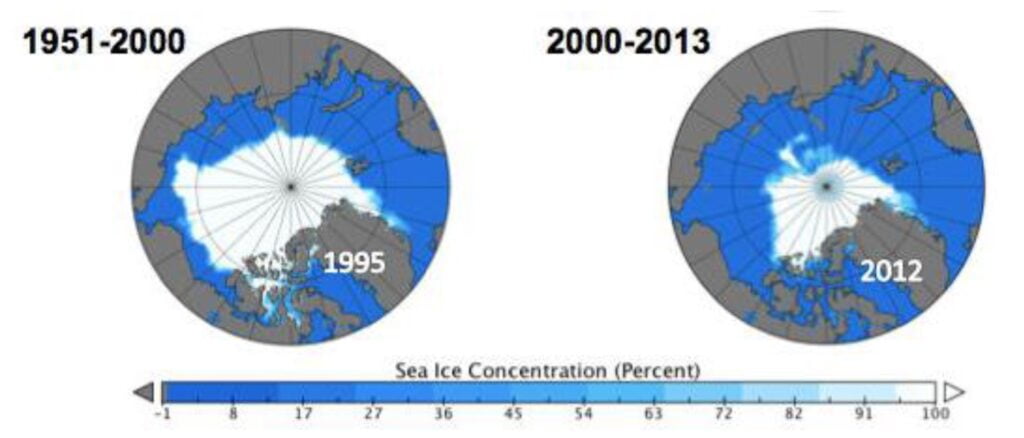
Arctic Ice Melting

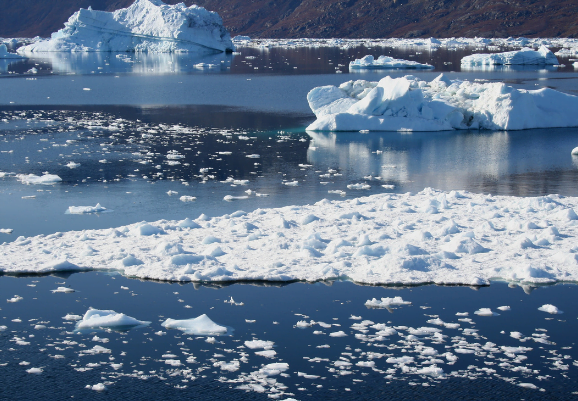
The increasing global temperature due to human-induced climate change is causing ice in the Arctic to melt, particularly over the summer season, July to September.

Arctic Ice Melting Diagram

In September 1999, there was 6.2 million km2 of Arctic sea ice.

In September 2015, there was 4.6 million km2 of Arctic sea ice.

Work out the percentage decrease in Arctic sea ice from September 1999 to September 2015. 

[3 marks]

Decreasing Fish Stocks

don't use calculatorGlobal warming will affect the world’s annual fishing catch.

In a world heated by a global warming of 2°C, the annual fishing catch will decrease by 3.3 million tonnes.

In a world heated by a global warming of 1.5°C, the annual fishing catch will decrease by 1.5 million tonnes.

Express the reduction of the annual fishing catch in a world warmed by 2°C as a fraction of the reduction in annual fishing catch in a world warmed by 1.5°C.

Give your answer in its simplest form.
[2 marks]

Losing Coral Reefs

don't use calculatorGlobal warming will affect the world’s coral reefs.

In a world heated by a global warming of 2°C, we will lose 99% of coral reefs.

In a world heated by a global warming of 1.5°C, we will lose 81% of coral reefs.

Express the percentage of coral reefs lost in a world warmed by 2°C  as a fraction of the amount of coral reefs lost in a world warmed by 1.5°C. Give your answer in its simplest form.

[2 marks]