Wiring up a Net-Zero Home

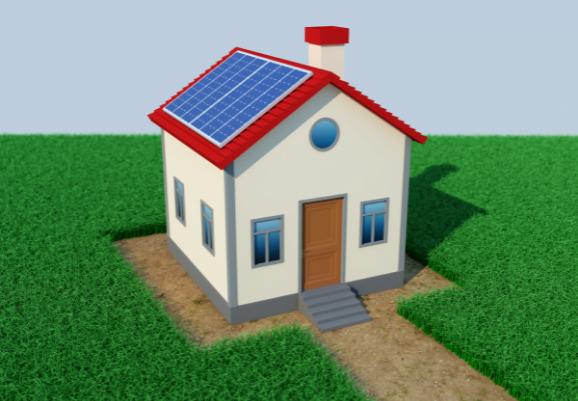
A homeowner decides to make their house carbon-neutral. They place solar panels on the roof, which then connect o their mains circuit via a wire.

The wire can be modelled as leaving the solar panels at A = 2i + 3j + 4k, and connecting to the mains at the point B = -3i + j – 3k, with the distances measured in metres and both points measured relative to the same fixed origin.

a) Show that \(\overrightarrow{\text{AB}} = – 5\mathbf{i -}2\mathbf{j -}7\mathbf{k}\) and hence find the length of wire needed to 2 decimal places.

[2 marks]

In many homes powered by solar energy, when excess power is generated, it can be put onto the national grid, so that more renewables power the grid rather than fossil fuels. 

The wire leading to the grid is on an automatic switch system M, which divides the wire \(\overrightarrow{\text{AB}}\) in the ratio 2:1.

b) Calculate the distance of the automatic switch system M from the origin.

[4 marks]


Mountainside Monitoring

3 CO₂ monitors K, L and M are placed on a mountain side

The vector \(\overrightarrow{\text{KL}} = 3\mathbf{i -}6\mathbf{k}\) and \(\overrightarrow{\text{LM}} = 2\mathbf{i} + 5\mathbf{j} + 4\mathbf{k}\), relative to a fixed origin.

Show that \(\angle KLM = 66.4°\) to one decimal place

[7 marks]

Hence find \(\angle LKM\) and \(\angle LMK\)

[3 marks]

A Climate Aware Citizen

A person decides in 2020 that they want to completely eradicate their carbon footprint in 20 months.

Following this decision, they begin to use multiple technologies that decrease their carbon footprint, such as limiting air travel, carbon offsetting and a solar powered home that contributes energy back to the national grid.

This results in their rate of emissions per month, E, following the equation

\[E = 12\ln\left( t + 5 \right) – 2t + 2\]

where t is the time, in months, since 2020.

a) Show that they achieve zero emissions between 18 and 22 months after they start.

[2 marks]

b) Using the iteration formula \(t_{n + 1} = 6\ln{(t + 5)} + 1\) with \(t_{o} = 18\), find the value of \(t\) at which they achieve zero emissions to 2 decimal places.

[3 marks]

City Emission Levels

The emissions of a city from 2000 to 2012 are modelled by the equation


\(p\left( t \right) = \frac{1}{10}\ln\left( t + 1 \right) – \cos\frac{t}{2} + \frac{1}{10}t^{\frac{3}{2}} + 199.3\)

\[0 \leq t \leq 12\]


a) Show that the emissions reach a local maximum in the interval \(8.5 \leq t \leq 8.6\)

[5 marks]


The emissions reach a local minimum between 9 and 11 years after the measurements began.

b) Using the Newton-Raphson procedure once and taking \(t_{0} = 9.9\) as a first approximation, find a second approximation of when the emissions reach a local minimum.

[6 marks]

A Carbon Conscious Company

The curve

\[y = e^{-0.5x} + 4x – 0.1x^{2} + 2\]

Can be used to describe a company’s net emissions, in tons of CO2, x decades after 2000. 

a) By first using calculus, show that peak emissions occur at 19 ≤ x ≤ 21

[4 marks]

The company owns an afforestation program. As trees absorb CO2, this means that their net emissions can decrease to negative values.

b) Show that the emissions become negative between 39 and 41 years after the year 2000.

[2 marks]

c) Use the Newton-Raphson method to find, to 4 significant figures, the number of decades it takes for the emissions to become negative. Use x0 = 39

[4 marks]

UK Carbon Dioxide Emissions

The rate of CO2 emissions for the UK was measured every 5 years, from 1990 to 2015.

The results are given in the table below with the rate of CO2 emissions measured in x109 kg year-1

Year

1990

1995

2000

2005

2010

2015

Rate of CO2 emissions (x109 kg year-1)

595.7

557.5

555.7

555.2

496.7

403.8

Using all of this information,

a) Estimate the total CO2 emissions from the UK between 1990 and 2015, giving your answer in standard form.

[3 marks]

Given that the curve produced by plotting a graph of the rate of CO2 emissions against the year is concave,

b) Explain whether your answer to part (a) is an underestimate or an overestimate of the total CO2 emissions between 1990 and 2015.

[1 mark]

Finding the Total Carbon Dioxide Emissions from 1850

The graph below shows how the rate of CO2 emissions varies from 1800 to 2017.

This curve can be approximated as \(E = 1.5e^{0.02t}\) where E is the rate of CO₂ emissions per year (GtCO₂ year⁻¹) and t is the number of years since 1800.

a) Using the above equation, calculate the total mass of CO₂ emitted between the years 1800 and 2017. Give your answer to 3.s.f.

[3 marks]


b) By comparing the exponential model with the best fit line on the graph shown at \(t = 150\), evaluate whether your answer to (a) is an overestimate of the true emissions or an underestimate.

[1 mark]

50 Years to Net-Zero

A country wishes to achieve net-zero CO2 emissions in 50 years. 

At the start of the program their emissions are 800MtCO2 year-1. 

They decide that they will be able to reduce their emissions at a stable rate so that each subsequent year they emit 12MtCO2 less than the previous year.

a) Calculate the total emissions that the country had produced over the 50 years, giving your answer in MtCO2.

[2 marks]

b) Show that a graph of MtCO2 produced per year against the year follows a straight line with equation:

\[y = 800 – 12x\]

[1 mark]

At the same time as reducing their emissions, the country decides to start a carbon dioxide removal program, whereby a certain amount of carbon dioxide is captured from the atmosphere and sequestered underground each year. 

The program begins in the tenth year. 

When the graph of MtCO2 removed per year is plotted against the year, it follows the curve with equation

\[y = 0.1x^{2} – x\]

c) Determine whether the country achieves their goal by finding the year in which the emissions removed are equal to the emissions produced, and thus the net emissions from the country are zero.

[3 marks]

After the 50 year program, the countries emissions stabilise at the final value. 

The MtCO2 absorbed per year follows the same trend as before. 

The country wishes to have not contributed to global warming at all since the start of the program. To achieve this, their net total CO2 emissions over the entire program would have to be zero.

d) Given the above information, by using calculus show that it takes 109 years for the country to have had a net zero effect on global warming since the start of the study.

[5 marks]

Deep-Sea Bubbles

Deep sea vents can emit harmful gases, such as hydrogen sulphide. Since these bubbles are small, they shrink once they leave the vent, as the gases dissolve into the ocean.

An autonomous submarine takes a photograph of these bubbles that looks like this graph sketch. 

deep-sea bubbles

A scientist discovers that the surface of the bubbles visible in this photograph can be represented by the curve:

\[\sin\frac{y^{3}}{100} + e^{- x}y + x^{2} = 5\ ,\ y > 5\]

By first using implicit differentiation to show that

\[\frac{\text{dy}}{\text{dx}} = \frac{100(y – 2e^{x}x)}{3e^{x}y^{2}\cos\frac{y^{3}}{100} + 100}\]

Show that at the turning points on the curve, where \(\frac{\text{dy}}{\text{dx}} = 0\), \(y = 2xe^{x}\)

[8 marks]

Storing Sequestrates

A manufacturer produces a tank for storing liquid CO2 underground.

The tank is modelled in the shape of a hollow vertical circular cylinder closed with a flat lid at the top and a hemispherical shell at the bottom. 

The walls of the tank are assumed to have negligible thickness.

The cylinder has a radius r metres and height h metres and the hemisphere has radius r metres.

The volume of the tank is 6 m3.

a) Show that, according to the model, the surface area of the tank, in m2 is given by

\[\frac{12}{r} + \frac{5}{3}\pi r^{2}\]

[4 marks]

The manufacturer needs to minimise the surface area of the tank, to minimise costs. 

b) Find, using calculus, the radius of the tank for which the surface area is a minimum.

[4 marks]

c) Find the surface area of the tank for this radius, giving your answer to the nearest integer.

[2 marks]