Categories
Blog Climate Climate Change Science

Carbon Dioxide in the Atmosphere – Balancing the Flow

It is the concentration of greenhouse gases in the atmosphere, rather than the emissions at a particular moment in time, which determines the temperature of the Earth.

How the concentration of Carbon Dioxide changes is determined by the balance between the amount of carbon dioxide going in to the atmosphere, and the amount being taken out. Change the flow rate using the + and – buttons on the animation below, where the water level in the bath represents the concentration of greenhouse gases in the atmosphere. 

In the furthest left position, there is less (no) carbon dioxide being added to the atmosphere than is being taken out by natural and human processes. The concentration of carbon dioxide in the atmosphere falls.

In the second position, the same amount of carbon dioxide is being added to the atmosphere than is being taken out by natural and human processes. The concentration of carbon dioxide in the atmosphere stays the same.

In the third position, there is slightly more carbon dioxide being added to the atmosphere than is being taken out by natural and human processes. The concentration of carbon dioxide in the atmosphere rises.

In the fourth position, there is much more carbon dioxide being added to the atmosphere than is being taken out by natural and human processes. The concentration of carbon dioxide in the atmosphere rises rapidly.

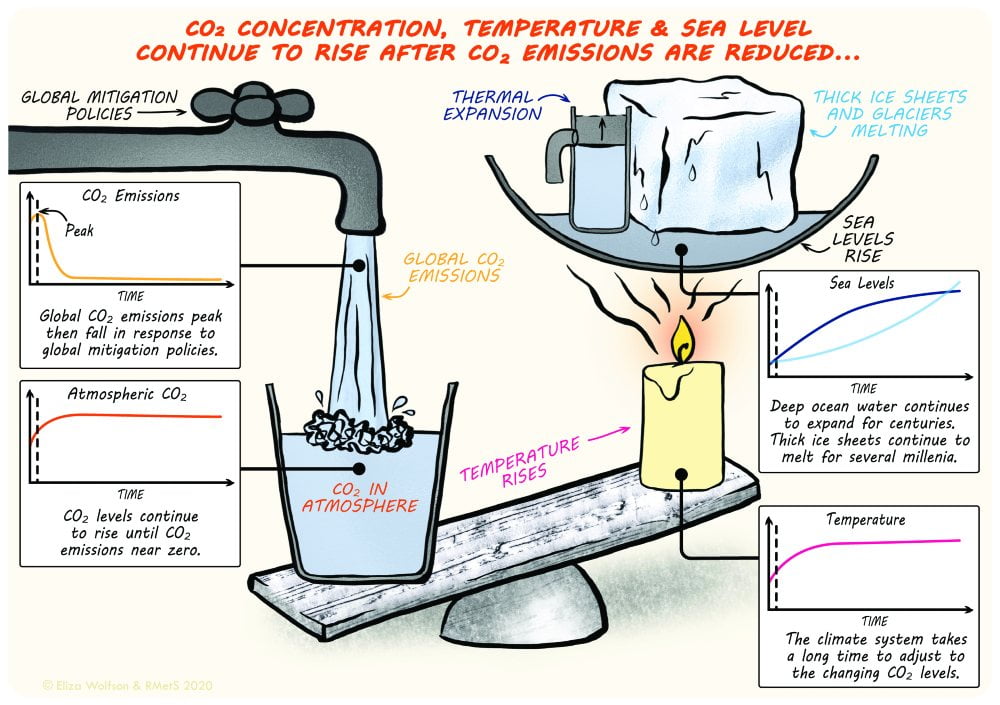
Even if emissions fall (position 3), as was the case briefly in 2020 when COVID19 related restrictions reduced global emissions, the concentration of greenhouse gases in the atmosphere continues to rise.

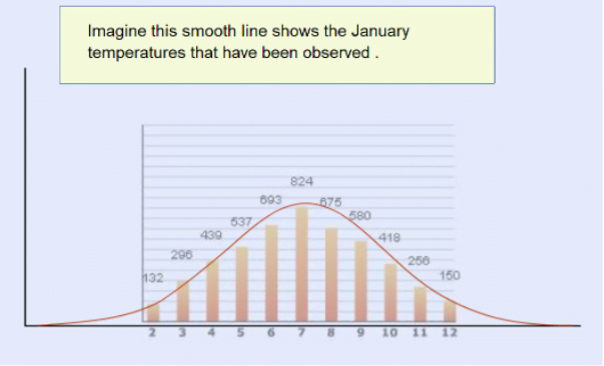
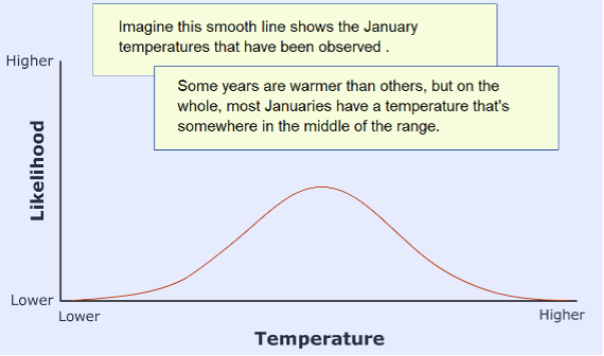
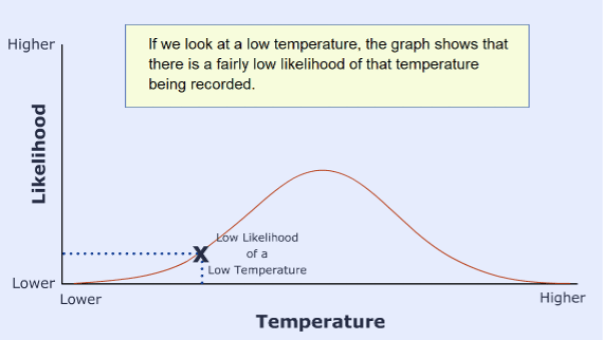
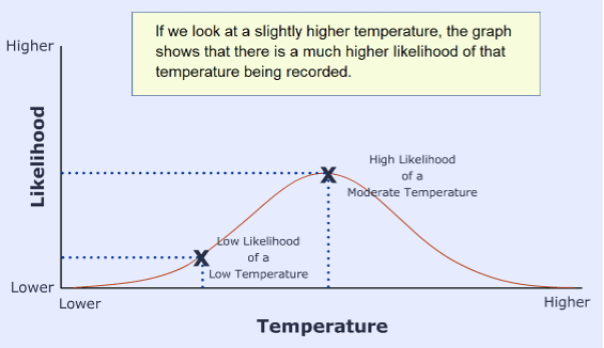
The relationship between emissions, concentrations, global temperature and sea level

Reducing emissions

Even before humans were around, there was a constantly evolving balance of greenhouse gases in the atmosphere. Natural sources, such as respiring animals, the decomposition of organic matter, volcanoes, rock weathering, freshwater outgassing and ocean-atmosphere exchange of gases are balanced by photosynthesis and ocean-atmosphere exchange of gases.

Humans have added additional sources and sinks, as are summarised by this diagram from the IPCC:

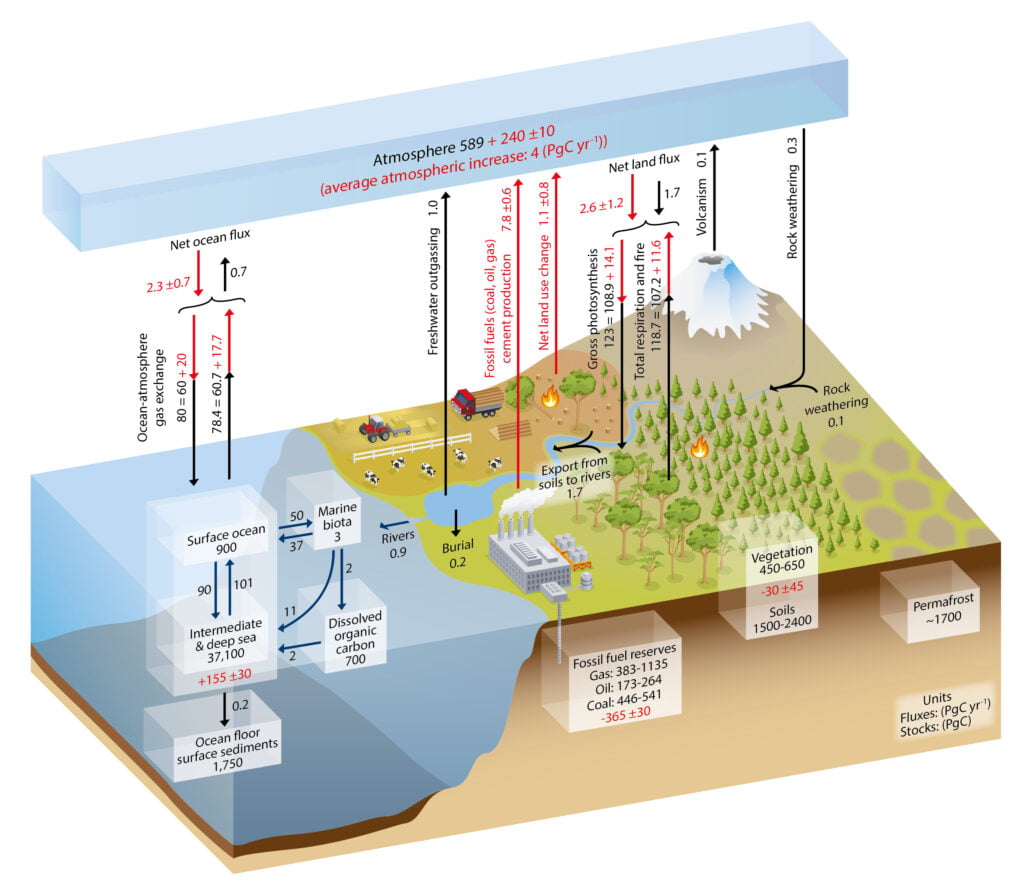
WG1 Chapter 6, figure 1. The numbers represent carbon reservoirs in Petagrams of Carbon (PgC; 1015gC) and the annual exchanges in PgC/year. The black numbers and arrows show the pre-Industrial reservoirs and fluxes. The red numbers and arrows show the additional fluxes caused by human activities averaged over 2000-2009, which include emissions due to the burning of fossil fuels, cement production and land use change (in total about 9 PgC/year). Some of this additional anthropogenic carbon is taken up by the land and the ocean (about 5 PgC/year) while the remainder is left in the atmosphere (4 PgC/year), explaining the rising atmospheric concentrations of CO2. The red numbers in the reservoirs show the cumulative changes in anthropogenic carbon from 1750-2011; a positive change indicates that the reservoir has gained carbon.

IPCC, 2013: Climate Change 2013: The Physical Science Basis. Working Group I Contribution to the Fifth Assessment Report of the Intergovernmental Panel on Climate Change, Cambridge University Press, Cambridge, United Kingdom and New York, NY, USA.

More processes could be added to this picture in the future, such as carbon capture and storage.

This animation was adapted from an infographic produced by the IPCC https://www.ipcc.ch/sr15/mulitimedia/worlds-apart/

Other related links

Categories
Blog Climate Climate Change Extreme weather Weather

Weather, Climate, Extreme Weather and Chaos Theory

How does climate relate to the weather?

We like to talk about the weather, to complain about its variability and to blame the weather forecasters for getting it wrong. But what is ‘climate’, and how does the weather we experience on a day-to-day basis relate to climate change, a subject which is increasingly dominating our newspapers and television screens? Why is it that we can’t make a perfect weather forecast? How can we hope to predict the climate of the 21st century, when we can’t say what the weather will be doing in a week’s time? If the climate changes, how does the weather change?

Firstly, how does the climate relate to the weather we experience on a day-to-day basis? We know from experience that the weather can be very different from one day to the next, let alone from one year to the next, without any change in the climate.

Surprisingly, dice are a good way to think about the difference between weather and climate…

The animation below allows you to choose how many times to roll a dice and then see how often you get each of the six sides. Try a low number of rolls, then try some larger number of rolls and see what happens:


Throw the dice a few hundred times. What is the average (mean) of the scores? The more throws, the closer the average gets to 3.5. If you were to throw the dice one more time, you would not be able to predict the number that the dice would land on, as the probability of throwing each number is the same. However, you could be very confident that the mean would still be 3.5.

But what has this got to do with weather and climate?

What if we associate weather types (for example, cloud cover) with each number on the dice?

Try rolling the dice in the animation, again explore what happens as the number of rolls increases.

As when there were numbers on the sides of the die, you can’t predict what the weather will be on the next throw. Climate is defined as being the average of the weather over a long (typically 30 years) period of time. The ‘climate’ of this die is 50% cloud cover. A single throw of 0% or 100% cloud cover won’t affect the climate very much if you are taking the average of 100s of throws. In the same way we can have a very hot summer one year, and a very wet one the next, without the climate, the weather we expect to happen, necessarily changing.

Climate is what we expect, weather is what we get

So why do the weather forecasters never get it totally right? Mostly because the weather is a ‘chaotic’ system.

Very small changes to the starting conditions can lead to completely different weather patterns developing. This observation led Ed Lorenz to suggest that the flap of a butterfly’s wings in the Amazon rainforest could lead to a tornado in Texas. It is very unlikely, but it could.

This means that, to make a perfect weather forecast, we need to know what the atmosphere is doing currently, down to the scale of individual butterflies flapping their wings, which is obviously impossible!

So, since tiny changes in the starting conditions of a weather system can make significant differences to the outcome, when making a forecast we have to try to take into account what might be happening now, as well as what might happen in the future to affect the atmosphere. The best we can do is to produce a range of forecasts, with some indication of what is most likely, or least likely, to happen.

To help illustrate this, consider throwing two dice instead of one:


With two dice, the probability of throwing a combined score of a number between 2 and 12 is not the same. There is only one combination of number that would give you a 2 or a 12 (two 1s or two 6s respectively) but, for example, for a combined score of 4 you could throw a 3 and a 1, two 2s or a 1 and a 3 – so you are 3 times as likely to throw 4 as 2 or 12. There are most possible ways of throwing a combined score of 7, and no way at all of throwing a 1 or 13 or more.

Move the slider to pick a number and throw the dice a large number of times. Notice the shape of the graph that is produced – the middle numbers are rolled more often than the smallest or largest numbers.

This sort of shape of ‘bell shaped’ graph is very common. For example, temperature measurements will often show a similar distribution, although temperature can of course take any value, not just the numbers one to twelve.

In this way, the results of many weather and climate forecasts can be combined to show what is most likely to happen, what is unlikely to happen and what almost definitely won’t happen.

But what about extreme events? How will the likelihood of an extreme event change as the climate warms? It is never possible to attribute one particular event to a particular cause. To go back to the dice example, you could load a die so that sixes occur twice as often as normal. But if you were to throw a six using this die, you could not blame it specifically on the fact that the dice had been loaded. Half of the sixes would have occurred anyway, even with a normal die. Loading the die just doubles the odds of throwing a 6.

In general, if the climate warms, the whole bell-shaped curve of temperature for a particular place shifts to warmer temperatures:

Graph 1

Taken from the Synthesis report on Climate Change, 2001, ipcc.ch

Record hot events are more likely in a warmer world, and record cold events are less likely.

So, for example, we can say that the hot summer of 2003, which killed 22,000 – 35,000 people in central Europe, is twice as likely because of the global warming that has resulted from the man-made emissions of greenhouse gases. By 2050, we can expect summers as hot as that every other year.

Similarly, in the U.K., we can expect the number of extremely rainy days, with associated flooding, to increase. Already, the kind of rainfall that you could have expected once every 30 years in the 19th century is happening once every 12 years now. By the end of the century, it could be expected every 4 years.

So, we can adapt the earlier phrase about weather and climate to 

Climate is what you affect, weather is what gets you

So, to summarise:

  • Even with perfect forecasting techniques, we could never say exactly what the climate will do over the next century. This is because:
    • weather is chaotic
    • we don’t know how the world will develop and how much greenhouse gas will be emitted
    • We don’t know what other, natural, factors may affect the climate in the future – volcanic eruptions, changes in solar activity etc.
  • We can, at best, say what the climate is most likely to do, and what it probably won’t do.
  • The longer into the future a forecast is made, the less certain you can be about what will happen.
  • We can expect extreme events – such as abnormally hot seasons and storms, to become more frequent in a warmer world.

The animations were originally developed by climateprediction.net  and The University of Oxford Department for Continuing Education (Technology Assisted Life-long Learning Unit).

Categories
Blog Climate Climate Change

The Earth’s Energy Balance – the Basics

What affects the climate of the Earth? Why has the temperature of the Earth stayed approximately the same over very long periods of time, without varying by hundreds of degrees?

The temperature of the Earth can be represented by the level of water in a bucket which has a hole in the bottom and water flowing in from a tap at the top…

Click on the arrow to find out how it works.


The amount of water flowing out of the hole in the bucket is determined by the depth of water in the bucket – the higher the water level, the greater the pressure in the water and the more water is forced out of the hole. So, if you open the tap, the water level rises until the rate water leaves the bucket is again equal to the rate water is flowing in from the tap.

If you close the tap, the water level falls until the rate water leaves the bucket is again equal to the rate water is flowing in.

But how does this relate to the climate?

Our tap pouring water into a bucket with a hole is a simple way of looking at the temperature of the Earth.

The water flowing from the tap represents the energy from the Sun, the water escaping from the hole in the bucket represents the energy the Earth loses to space, and the water level in the bucket represents the temperature of the Earth.

The amount of energy the Earth loses to space is simply determined by the temperature of the Earth’s atmosphere. If the Earth were to get more energy from the Sun the temperature of the atmosphere would rise, just like the water level in the bucket, until the amount of energy it’s losing to space is again equal to the amount of energy it’s getting.

At its simplest level, whether or not the Earth is heating up or cooling down is determined by the difference between the amount of energy the Earth is getting from the Sun and the amount of energy it is losing to space.

Since the Industrial Revolution, the increasing amount of greenhouse gas in the atmosphere has been restricting the amount of energy the Earth is losing to space – as if the hole in the bucket were partially blocked. As a result, the Earth is heating up. If we were to stop increasing the amount of greenhouse gas in the atmosphere, the Earth would eventually (in a few decades) reach a new, constant, warmer, temperature.

It’s worth noting that if you were to leave the tap alone, but suddenly poured another load of water into the bucket in one go, the water level would rise abruptly. The water pressure would also increase abruptly, and so would the flow of water through the hole. As the water level fell back down to its original level, the flow of water through the hole would also slow until the water level stabilised at its original level.

In the same way, if something suddenly adds a lot of heat to the atmosphere (imagine a massive wildfire, maybe) then that heats the atmosphere locally, making it lose more energy to space. As the atmosphere slowly cools down, the energy lost to space also reduces, until the atmosphere returns to the temperature it had before the fire.

Adding heat to the atmosphere does not change the climate. Changing the composition of the atmosphere (for example by adding greenhouse gases), does.

The animations were originally developed by climateprediction.net  and The University of Oxford Department for Continuing Education (Technology Assisted Life-long Learning Unit).

Categories
Climate Change

COP26 and November 2020

As we head into the weeks when COP26, the UN climate change conference at which heads of state, climate experts and campaigners come together to agree coordinated action to tackle climate change, should have happened, a number of organisations are taking the opportunity to run virtual climate events.

The Youth Climate Summit will run from 9-13 November 2020.  It is a free, week-long virtual festival of themed discussions and activities.

Between 19 November – 1st December, Mockcop are running a youth-led online conference following a similar structure to the postponed COP26 climate summit to raise the ambition of our leaders when it comes to tackling the climate emergency.

If you are in a school, why not take the opportunity to run our Climate Negotiations resource with a year group bubble? We hope to have a fully virtual version available early in 2021.

COP26 will now run from 1-12 November 2021, in Glasgow.

https://www.youtube.com/embed/Cn-ZqGJxpk4
Categories
Climate Climate Change Weather

Weather, Climate and Covid-19

Categories
Blog Climate Change

Climate change: 800 years tracked using oak tree rings

bbcThe BBC have featured the research being done at Swansea University looking at how tree rings can tell us about past weather and climate. This is the research which forms the basis of our Tree Ring Resources – using tree rings to teach weather, climate, correlation, photosynthesis, regression, the carbon cycle, isotopes and more.

Categories
Climate Change Geography Research Science

Tree Ring Resources

We were delighted to launch our past weather and climate teaching resources at the Geographical Association’s meeting in Manchester last week.

You can find the introductory film, online game and teaching resources here

We’ll add more background information and some instructions about how to make a replica of the amazing tree ring jigsaw in lego or even by 3D printing it, shortly.

resources
Categories
Climate Change

IPCC 1.5 Degree Report

You are very unlikely to have missed the various media reports about the IPCC’s special report on global warming of 1.5 °C, published this week. Some of the comparisons between a 1.5°C world and a 2°C world are fairly shocking, even to someone who had a fair understanding of climate projections. The full summary of the report can be found here – but here are a few headlines which I have extracted from it:

  • Human activities are estimated to have already caused approximately 1.0°C of global warming above pre-industrial levels
  • If we stopped all emissions now, we would probably stay within 1.5°C warming.
  • If we do very little now, we are likely to reach 1.5°C warming by the 2050s at the latest.
  • – Climate-related risks for natural and human systems are higher for global warming of 1.5°C than at present, but lower than at 2°C
  • Climate related risks are larger if global warming exceeds 1.5°C before returning to that level by 2100 than if global warming gradually stabilizes at 1.5°C
  • By 2100, global mean sea level rise is projected to be around 0.1 metre lower with global warming of 1.5°C compared to 2°C. This would mean 10 million fewer people would be affected.
  • At somewhere between 1.5°C and 2°C, major ice sheet instability in Antarctica and/or irreversible loss of the Greenland ice sheet could be triggered, resulting in multi-metre rise in sea level over hundreds to thousands of years.
  • Limiting global warming to 1.5°C compared to 2°C is projected to lower the impacts on terrestrial, freshwater, and coastal ecosystems and to retain more of their services to humans. Of 105,000 species studied, 6% of insects, 8% of plants and 4% of vertebrates are projected to lose over half of their climatically determined geographic range for global warming of 1.5°C, compared with 18% of insects, 16% of plants and 8% of vertebrates for global warming of 2°C
  • With 1.5°C of global warming, one sea ice-free Arctic summer is projected per century. This likelihood is increased to at least one per decade with 2°C global warming.
  • Coral reefs are projected to decline by a further 70–90% at 1.5°C with larger losses (>99%) at 2ºC
  • Depending on future socioeconomic conditions, limiting global warming to 1.5°C, compared to 2°C, may reduce the proportion of the world population exposed to a climate-change induced increase in water stress by up to 50%
  • Estimates of the global emissions outcome of current nationally stated mitigation ambitions as submitted under the Paris Agreement would lead to global greenhouse gas emissions in 2030 of 52–58 GtCO2eq yr-1. These ambitions would not limit global warming to 1.5°C, even if supplemented by very challenging increases in the scale and ambition of emissions reductions after 2030. Avoiding overshoot and reliance on future large-scale deployment of carbon dioxide removal can only be achieved if global CO2 emissions start to decline well before 2030. The lower the emissions in 2030, the lower the challenge in limiting global warming to 1.5°C after 2030 with no or limited overshoot
  • Mitigation options consistent with 1.5°C pathways are associated with multiple synergies and trade-offs across the Sustainable Development Goals, particularly health, clean energy, cities and communities, responsible consumption and production, and oceans.

Carbon Brief: Scientists discuss key findings of the IPCC special report.
Carbon Brief: Q&A on the IPCC special report on climate change.
The Office for Climate Education’s Summary for Teachers.

Categories
Climate Change Geography Secondary

Water Cycle Film

We are delighted to have produced this short video illustrating how deforestation has an impact on the water cycle, both locally and globally. Bringing together the carbon and water cycles, it is particularly relevant to A level geography (and GCSE biology).

Categories
Climate Change Teaching

Climate Change Negotiations Wins Silver Award

We are delighted that our Climate Negotiations Resource has been awarded a Silver award at this year’s Geographical Association conference.

The citation from the judges read: “Simulating a world climate change conference is a free, online and multimedia resource, relevant for both GCSE and A level specifications. It provides a wealth of high-quality, sophisticated and up-to-date materials, including clear instructions and background information; vital for developing a full geographical perspective on the potential positions of the different countries. Particularly useful is video input from one of the British delegates to the Paris climate talks which lends authenticity to the process that the students undertake. The judges felt that while role play is a well-established approach to learning about geographical issues such as climate change, the quality of the resource would enable teachers to confidently set up an excellent simulation for their classes.”