We have created a new resource in time for International Women’s Day 2022, exploring the links between two of the Sustainable Development Goals – gender equality, and climate action.
Taking information from this weeks’ InterGovernmental Panel on Climate Change (IPCC) report on Impacts, Adaptation and Vulnerability as well as some of the relevant highlights fromCOP26, teachers can adapt the resource to suit their class.

The first of our very short daily bulletins from COP26 for teachers to use during registration or lessons can now be found on YouTube.
These bulletins will cover highlights about the coming day’s events as well as more general background information about how COP works. We’ll also try and bring in a bit of careers related information.
The aim of the films will be to help students engage more with this very important event which is happening in the UK, as well as giving them some context for the messages that they get through social media etc.
Please share with other teachers in your school who might be interested.
Thanks!
We will be filming very short daily bulletins from COP26 for teachers to use during registration or lessons.
They will cover highlights about the coming day’s events as well as more general background information about how COP works. We’ll also try and bring in a bit of careers related information. You will be able to find them on YouTube and we’ll try to make sure that they have been uploaded the night before, in plenty of time for morning registration.
The aim of the films will be to help students engage more with this very important event which is happening in the UK, as well as giving them some context for the messages that they get through social media etc.
The first video will be available for showing on Monday, 1st November.
Please share with other teachers in your school who might be interested.
Thanks!
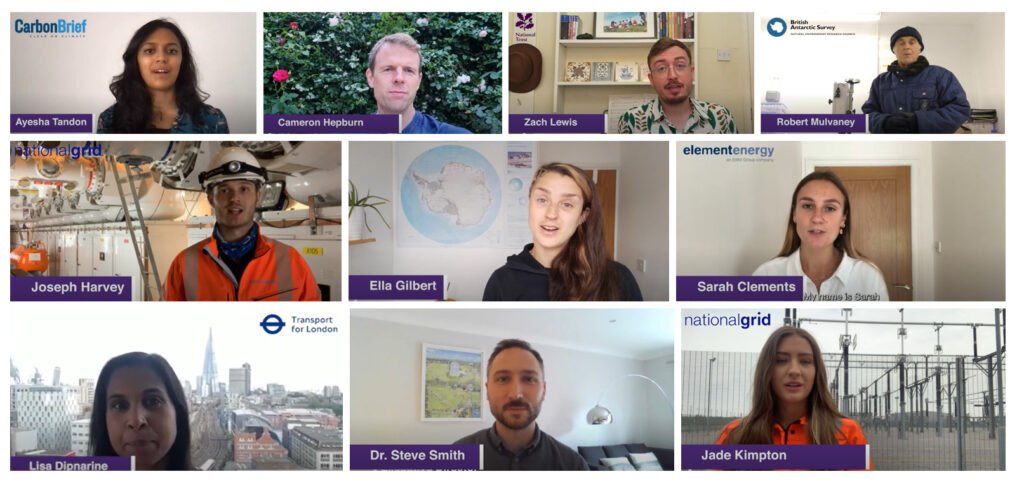
In this new set of 11 short videos, we explore some of the many careers in climate change that you could do with qualifications in STEM subjects.
If you want to work in an area where you can do something positive about climate change, but don’t know how, have a look at the work that these people do, why they think it’s important and the paths they took to the jobs that they now do.
If a career in weather or climate sounds interesting, have a look at the further careers information on our website at metlink.org/careers

The Central England Temperature (CET) dataset is the longest instrumental record of temperature in the world, pre-dating the satellites and radar instruments which we now have to tell us about the state of the atmosphere.
The data represents the temperature in a roughly triangular area of the United Kingdom enclosed by Lancashire, London and Bristol.
The sources of the data include records kept by individuals around the country, all carefully combined and corrected for factors such as changing instruments over time etc. The precision of the data published for each year reflects the number, accuracy, reliability and geographical spread of the temperature records that were available for that year – so early in the record, the data may only have a precision of 1°C or 0.5°C, whereas more recent data has a precision of 0.1°C.
The mean monthly temperature record starts in 1659 (with daily data being available from 1772 and maximum and minimum daily and monthly data beginning in 1878).
The full dataset and references can be found at www.metoffice.gov.uk/hadobs/hadcet
The Royal Meteorological Society is delighted to have collaborated with CREATE Education to develop instructions to allow schools or individuals to 3D print sections of the Central England Temperature Record and use their models to learn about weather, climate, extreme weather and climate change.
These engaging, tactile resources allow students to get a hands-on experience of what climate is and how it can change, and how extreme weather relates to the climate.
Each three dimensional block shows 10 years’ worth of monthly temperature records. Printing off several blocks allows you to compare the changing weather and identify extreme weather events. The models have been designed to interlink, so students can create a series of models to represent larger timeframes.
Climate is usually defined as the average of 30 years’ weather. For easy comparison with the weather in any one year, you can 3D print an additional mini block which shows current (1981-2010) climate.
Once the 3D models have been created and 3D printed, there is a tactile resource that can be used in multiple ways in the classroom to visualise and study past weather and climate, and at how the climate of the UK has been changing over time.
The lesson resources specifically focus on
1. The difference between climate and weather
2. The current climate of the UK
3. The changing climate of the UK
4. Looking at past extreme weather events and researching their impacts on people in the UK.
We have just added a new resource to our Weather and Climate: a Teachers’ Guide collection in the Changing UK Climate section.
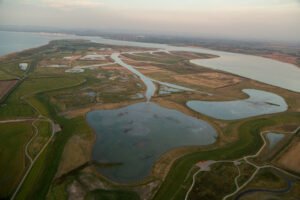
The resource provides students with source material, graphs and maps to allow them to make a poster explaining how salt marshes can protect coastal areas from the impact of rising sea levels.
Steart Marshes – designed for adaptation to climate change.
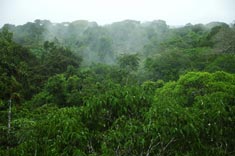

We are delighted to have worked together with the RGS to produce a resource for A Level geography students, using key data skills to investigate the impact of Amazon deforestation on rainfall.
The worksheet is designed to highlight the importance of meteorology understanding in physical geography. There are activities on the statistical tests of Mann Whitney U-Test and Spearman’s Rank Correlation Coefficient.

The Society has been given the chance to review three new climate change books aimed at a very similar audience:

Climate Crisis for Beginners
Andy Prentice and Eddie Reynolds
Usborne Publishing Ltd, 2020
Hardback £9.99
128pp
ISBN 978-1-4749-7986-3
Summary: a very comprehensive, engaging and current book for upper primary/ lower secondary aged students
“How important is this crisis? Not everyone agrees about this. This book is here to help you make up your own mind.”
With bright, simple illustrations and a cartoon-like style, it is aimed at young people – the recommended age range is 10+. I suspect that it will appeal most to the 10-14 age range, and then again to slightly older people who will not feel patronised by the style but will have interest in the content. My 14 year-old daughter was put off both by ‘for beginners’ and the appearance of the book. Being much older than that, I struggled a bit with the style – I didn’t know which bit to read next.
Andy Prentice and Eddie Reynolds are authors and editors at Usborne and have consulted with Steve Smith (University of Oxford) and Ajay Ghambir (Imperial College, London) in writing this book. Ed Hawkins (University of Reading) and Richard Betts (University of Exeter) also contributed. There are 5 chapters – The Basics; How sure are we? What do we do? What’s stopping us? And What can I do?
The book manages to walk the tightrope of accuracy v. oversimplification very well. Of course, that balance will never be perfect – for me, for example, it’s missing a discussion of water vapour in the section about greenhouse gases. However, it introduces an impressively broad range of concepts and vocabulary associated with climate science and climate change more generally.
Climate Crisis for Beginners conveys the significance of climate change together with the many and various political and social issues as well as the viewpoints and priorities of individuals. However, for me, the strength of this book lies in the weight it puts on the solutions and opportunities already available. It is not all doom and gloom.
One concern that I do have is just how quickly the book will become out of date – in one or two places it already has.
I asked my 11 year-old daughter to read it – here are some of her thoughts (I have corrected the spelling): “When I first looked at this book, it looked colourful and full of interesting ideas and visions of the future. The information is presented in a fun way with lots of subtitles and boxes so that you can find what you need easily. I like all the different points of view and the reasoning behind the different answers to questions.”
The book concludes “Now that you’ve read this book, you’ve got the tools to imagine the future that you want and an idea of how to start your journey towards it.”

Climate Action: The Future is in our Hands
Georgina Stevens
Illustrator Katie Rewse
Little Tiger Press, 2021
Hardback £19.99
72pp
Summary: A bright, positive reference book for upper primary aged children, focussing on climate change impacts, mitigation and action
“In this book, we share the facts, but we also share hope.
Learn about the causes of climate change and how it is affecting our world.
Explore the human impact and what it means to have a carbon footprint.
Read about creative ideas for tackling the climate crisis.
Be inspired by positive stories from young changemakers around the globe.
Get tips on how to take action and reduce your carbon footprint.”
The recommended age range for this book is 7-12 and the bright, colourful and relatively simple design and illustrations are geared towards the younger end of that age range. Having said that, my daughters, aged 11 and 14 both really enjoyed it, particularly liking the embossed cover. This is a book which is nice to hold – possibly justifying its price which includes the cost of planting a tree. The layout is as a reference book, making extensive use of subtitles, with each double page spread covering one topic, such as greenhouse gases, tropical storms or our clothes. The ratio of text to images is appealing and the text and images are appropriate to the literacy and numeracy skills of the intended age group.
Georgina Stevens is a sustainability writer, advisor and campaigner. In each topic she features a ‘what can we do’ section with small, achievable changes that young people and their families could make. The book also features a number of ‘changemakers’ and ‘groundbreakers’ – young people from around the world who have already developed sustainability initiatives or got involved in the climate change movement. What the book is missing, though, is the big, complex, economic, social and political developments that could have a really significant global impact on greenhouse gas emissions.
I think that the book probably does have a nice balance of science, technology and positivity for the upper primary age range. The science parts of the book aren’t completely accurate – I cringed when the greenhouse effect was described as a reflection of heat, and water vapour is missing from the discussion of greenhouse gases, but it’s probably appropriate for this age range.
My 11-year old sagely pointed out that the focus of the book is on now – to this age group, the past may feel slightly irrelevant and the future too unknown and intimidating.

Palm Trees at the North Pole, The Hot Truth about Climate Change
Marc ter Horst
Illustrated by Wendy Panders
Greystone Kids, 2021
Hardback £14.99
192pp
Summary: a science book best suited to early secondary school aged students who like reading. Don’t be put off by the title.
“Once upon a time, there were palm trees at the North Pole. Can you picture that? The most tropical of trees in a place where now there is only snow and ice. In the future, they might reappear. Because the climate is constantly changing.”
Firstly, the title. My 11 year-old daughter’s first comment was about the fact that there isn’t any land at the North Pole. Although the book does touch on continental drift, the author never really explains ‘palm trees at the North Pole’ nor justifies the extension to the future and, for anyone inclined to be sceptical about climate science, this is a very easy target. However, the book does merit passing this first hurdle.
The author, Marc ter Horst, has written several other non-fiction titles for young people. His interests in geology and evolution are apparent in the book, a large section of which focusses on the past. This is a book which is designed to be read from cover to cover rather than dipped in to. It is made up of double page case studies linked together in a fairly simple, frequently light-hearted story-telling style which will appeal to some readers, particularly those who don’t much like reference book style facts and figures. Inevitably the style means that some processes are over-simplified. However, explaining, say, the Milankovitch cycles in story form is an impressive achievement.
The story starts with the early evolution of the Earth and, passing through Keeling curves and hockey sticks progresses to the impacts of climate change. Adaptation and mitigation strategies don’t really start being mentioned until p. 138 and its only after that – if the reader has got that far – that positive opportunities for preventing climate change start being introduced. This is not a book that will help much with the rise of eco-anxiety in young people.
A unique feature is that the book finishes with ‘climate bingo’ and the instruction to cross off events as they happen – with events covering a questionable choice of climate change impacts and mitigation and adaptation strategies.
My daughter thought the illustrations, which are simple and sometimes add to the text but are mostly just decorative, were her favourite part. Aimed at readers aged 8-12, it is quite text heavy and I think most 8 year-olds would struggle with it.
Why is it so hard to predict the weather a week in advance, and how can scientists tell us what they think the climate will be like in 50 years’ time?
First of all, it’s important to understand that weather isn’t random, it’s chaotic. If the weather was random, it would mean there’s no possible way of knowing what it was going to do next. However, the weather does obey the laws of physics and every change in the weather has a cause. The problem is that since there are so many possible causes, we can’t know about them all.
You may have heard of the butterfly effect (first proposed by Ed Lorenz in the 1960s): A butterfly flapping its wings in the Amazon rainforest might, through a long line of unlikely but possible consequences, cause a storm over Texas. In a similar vein, if we don’t know what’s going on in the atmosphere and on the Earth’s surface down to the detail of a butterfly flapping its wings now, we can’t hope to know how that’ll affect the weather in a week’s time. The possible range of consequences grows with time – and the ability to accurately forecast the weather will decrease with time. Of course, some weather situations – such as High pressure, are much easier to predict than others – such as the snow showers which can be caused by Arctic maritime air, but in general tomorrow’s weather forecast is much more likely to be accurate than one for 10 days’ time.

Animation created by Ross Bannister
This animated double pendulum illustrates the chaotic nature of weather really well: The pendulum starts off in the same position, but with a slightly different rotation speed (400.0 degrees/ second v. 400.1 degrees/ second). Over time the difference in the way the double pendulum rotates grows, until the two are behaving completely differently.
Modern forecasting techniques try to capture the range of possible future weather by making an ‘ensemble’ of weather forecasts – rather than making one forecast with one set of starting conditions (the weather now) they make many forecasts, each with tiny differences in the weather now – trying to take into account the effects of all the possible ‘butterflies’ or other tiny details about the climate system that we can’t possibly measure. The ensemble of forecasts gives forecasters a range of possible weather forecasts, with some indication of what’s most likely, and what might happen.
The climate, unlike the weather, is not chaotic. Remembering that climate is ‘average weather’, if large scale factors which control the climate are known – the composition of the atmosphere, the location of the continents, the Earth’s position in relation to the Sun etc. then it’s possible to predict the climate.
In between weather forecasts and climate forecasts come seasonal forecasts – the ‘what will the weather be next winter’ type questions. As the weather is chaotic, this is very hard to do, but there is some skill to be found in looking at the large scale influences on the weather – for example, if there’s a strong El Niño occurring, then certain weather patterns are more likely to form than others.
The North Atlantic Oscillation (or NAO) is another of the many factors which can be looked at. Meteorologists look at the pressure difference between Iceland and the Azores. The pressure is always lower in Iceland than in the Azores because of the large scale circulation of the atmosphere, however the difference in pressure can vary. A large difference in the pressure (a positive NAO) leads to stronger westerlies, bringing moist air to Europe. Consequently, summers are cool and winters are mild and wet in Central and Western Europe. In contrast, if the pressure difference is small (a negative NAO), westerlies are suppressed, winters are cold and dry in northern European areas and the depressions track southwards toward the Mediterranean Sea, bringing increased storm activity and rainfall to southern Europe and North Africa.
 In this teachers’ guide and the accompanying online teaching resources, we aim to give UK geography teachers all that they need to deliver relevant, engaging and thorough weather and climate lessons to 11–14+ year old students. They are not linked to any specific curriculum but should be easily adaptable to all.
The book is accompanied by high quality online background information/professional development resources for teachers.
The Royal Meteorological Society believes that:
To this end, we have embedded a climate change thread throughout the online resources, showing its relevance to both weather and climate. An understanding of weather and climate is fundamental to an understanding of climate change.
There is a progression of knowledge through the topics, supported by review and assessment activities. The resources also progressively develop key geographical skills such as data, mapwork, GIS, fieldwork and critical thinking.
In this guide, we include common misconceptions which should be challenged in the classroom.
There are 20 topics or chapters. Across these, there are three threads or paths which can be taken through the online resources, depending on the teaching time available:
Basic weather: Weather in our lives, weather measurements, weather and climate, global atmospheric circulation, global climate zones, air masses, pressure and wind and water in the atmosphere
Climate: Weather and climate, global atmospheric circulation, global climate zones, past climate change, polar climate, hot deserts, changing global climate, UK climate, changing UK climate, the climate crisis
Extending weather: Anticyclones, depressions, microclimates, urban weather, tropical cyclones.
Many of the online teaching resources are available with standard or easier versions, as well as extension or alternative activities.
Find the scheme of work, teaching resources, background information for teachers, as well as the Teachers’ Guide (copies of which may be printed on request), here.
All the online resources will be updated and revised regularly.
© 2024 Royal Meteorological Society
RMetS is a registered charity No. 208222
By clicking any link on this page you are giving your consent for us to set cookies. More info
Strictly Necessary Cookie should be enabled at all times so that we can save your preferences for cookie settings.
If you disable this cookie, we will not be able to save your preferences. This means that every time you visit this website you will need to enable or disable cookies again.