Earlier this year, we asked climate change experts from a wide range of subject disciplines to look for opportunities to teach about climate change in the current English GCSE specifications and KS3 curriculum.
Over 100 people responded, and between them reviewed well over a hundred documents.
Teachers! Now we need your input – which of the suggestions they made would actually work in a secondary classroom? Do you have any more suggestions to add?
What are the easiest ways for teachers to show their students the relevance of the current curriculum to climate change?
If you think you have a few minutes to be able to help, by looking at the suggested opportunities in your subject area, please contact education@rmets.org and tell us which subjects you teach.
We plan to ask similar questions of young people, and to share the information we collect with a diverse range of other organisations as well as use it ourselves to improve the support we offer to teachers.
We also plan to extend the project to Wales, Scotland and N. Ireland.
We have created a set of resources designed to allow physics teachers to demonstrate how the core physics taught links to current climate change research and action. For each topic, an expert in the field has recorded a short film which could be shown at the end of the lesson or topic. For some topics, practical activities or worksheets are also included:
Adapting the National Grid
We have a large and growing proportion of our electricity from renewables, and the amount of electricity generated varies depending on the weather. In this film, Jade Kimpton from the National Grid shows how the flow of electricity in the National Grid is getting more complex.
Key words: renewable and non-renewable energy, greenhouse gasses, fossil fuels, gravitational potential and kinetic store of energy.
Clouds reflect the Sun’s light, cooling the planet, but they can also act a bit like greenhouse gases, warming the planet. In this film, Dan Grosvenor from the University of Leeds shows how different types of cloud have a different climate effect.
The Jet streams are bands of fast winds high in the atmosphere which are driven by pressure differences. Stormy weather follows the jet stream. In this film, Tim Woollings from the University of Oxford shows how, as the lower atmosphere gets warmer, we need to understand how the patterns of pressure and the jet stream change and what effect that will have on storms in the UK.
Cathie Wells from the University of Reading is helping aircraft conserve fuel which reduces greenhouse gas emissions by making use of high resolution forecasts of three dimensional wind speeds in the atmosphere.
Key Words: speed, distance, time, velocity, greenhouse gas
Contrails occur when water vapour from jet engines condenses – only when the temperature and humidity conditions of the air is right. Contrails act like greenhouse gases. Marc Stettler from Imperial College, London is interested in guiding aircraft to fly where conditions are right, reducing contrail formation.
Join experts from the worlds of education policy and climate science to explore the findings of a climate literacy survey conducted earlier this year on the Royal Meteorological Society’s behalf by Ipsos MORI as part of their Young Person’s Omnibus survey.
The questions asked in the survey were developed by the Royal Meteorological Society, in conjunction with many of their members, including authors of the Intergovernmental Panel on Climate Change report, to ensure that they give a fair assessment of climate literacy. The questions will remain relevant in years to come as we hope to repeat the survey annually to assess the impact of interventions on climate change education in schools.
The ongoing results of the survey will inform the work of the Royal Meteorological Society, supporting teachers of all subjects to make use of the opportunities within the current curricula and exam specifications to teach climate change.
This free 50-minute virtual event will include an overview of the findings of the survey, panel discussion and Q&A.
The panel will include:
Prof Andrew Charlton-Perez, Head of School of Mathematical, Physical and Computational Sciences, University of Reading and Professor of Meteorology
Dr Sylvia Knight, Head of Education, Royal Meteorological Society
Dr Pippa Bailey, Head of Climate Change and Sustainability Practice, Ipsos MORI
Carl Ward, Chief Executive, City Learning Trust and Chair of the Foundation for Education Development
We have pulled together a set of Weather and Climate Change resources which could be used with a year 6 class after their SATs exams. Designed as a progressive set of engaging and interactive resources, they introduce skills and knowledge which will help prepare students for secondary school.
The resources can be used in independent lessons, or as part of a whole or half weather and climate themed day.
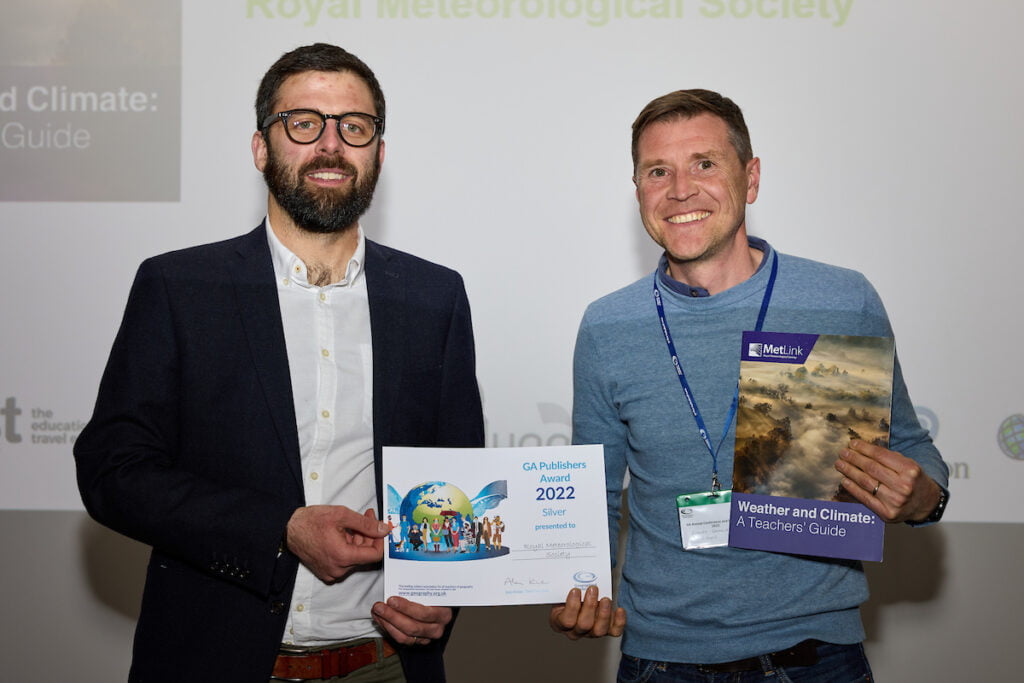
We were delighted that our Weather and Climate Teachers’ Guide/ scheme of work for 11-14 geography was awarded a ‘silver’ by the Geographical Association at their conference in April.
“This excellent – and free – resource, accompanied by differentiated PowerPoints, is well-structured, informative, and fits some complex weather and climate topics into a digestible format. The judges felt it is an accessible resource that provides support for subject specialist and non-specialist teachers alike. They liked the examples that the authors used and the way it makes connections from one lesson to another, building the learning along the way.”
In this article we explore air masses – the idea that, by looking at where our wind is blowing from, and what has happened to the air in the wind on its way to us, we can begin to understand why we’re getting some particular weather.
We live on an island, and the weather can come at us from any direction, although in practice, it comes from some directions more than others – this wind rose shows the direction the wind was recorded coming from at Heathrow airport, near London. The longer the bar, the more often the wind came from that direction, so you can see that our wind comes from between southwest and west most often.
Lets take a step back and remember that warm air rises – whether that’s the air being heated in a hot air balloon or the air above a radiator (watch a simple demonstration).
What happens to the rising air? As it rises it cools. Cloud and rain are caused by warm air rising, warm air rising is called convection (watch a simple demonstration).
You can often see convection going on in the atmosphere – you get puffy cumulus clouds, with flattish bases and puffy tops where the cloud is bubbling up.
More generally, Clouds form when there is more condensation going on than evaporation in the atmosphere.
The colder it is, the less evaporation happens – so cloud forms when the air cools.
This isn’t just when warm air rises.
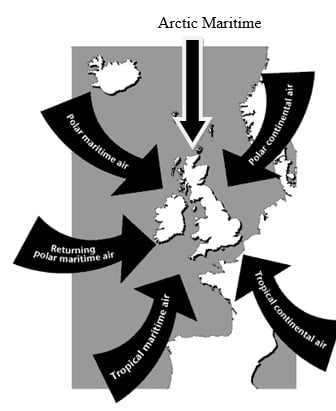
Now we can think about air masses, they are classified according to where they have come from, and what they have passed over:
One air mass generally covers the whole country.
However, it can bring different weather conditions to different places. For example, Tropical continental air can carry Saharan dust, but it mostly falls on the south of the UK – there isn’t much left in the air by the time it reaches Scotland.
Lets consider Polar maritime (Pm) air first (click on the map to start the animation):
Polar maritime air comes towards us from further North in the Atlantic. It starts cold, but is slowly warmed by the ocean below as it travels over progressively warmer water. It also picks up moisture from the ocean.
As it is warmed, it becomes more unstable and inclined to rise, leading to convection and puffy Cumulus clouds, mainly over the ocean. As the air hits land (the western coast of Ireland, Wales, Scotland and England) the air, which was already inclined to rise, is forced up a bit more – forming more cloud, and giving rise to rainfall.
Polar maritime air, our dominant air mass, brings cloud and rain to the west of the UK and relatively dry air to the east.
This satellite image is typical of Pm air – you can see the puffy cumulus clouds over the ocean, and the belt of cloud over the western side of the country.
Returning Polar maritime air (rPm) is air which is Polar in origin but which swings round to hit the UK from the west or even slightly south of west – but if you were to follow its path back, you would see that it was Polar.
Arctic maritime (Am) air is extreme Polar maritime air, coming down to the UK straight from the north, over the Arctic ocean. It tends to bring wintry weather to Scotland and isolated snowy showers further south, triggered by air rising over the local orography.
Polar continental (Pc) air will also be cold to start with and get progressively warmer as it moves south, so you would also expect convection. However, the air will be very dry as it passes over continental Europe, so little cloud will form. The UK is a set of islands though and to reach us, the air must pass over the North Sea, picking up water vapour as it does so. The cloud and precipitation (typically snow in winter) it brings therefore primarily affect the east coast. The longer the path it takes over the North Sea, the more precipitation there will be.
This satellite image is typical for Pc air – you can see the cloud free areas immediately to the west of the land masses, with cloud forming further east (ignore the front to the west of the UK and Ireland).
Of course, the characteristics of the air masses can be very different in the summer and the winter. Siberia, for example, is extremely cold in winter but relatively warm in summer – so a polar continental air mass can bring us bitterly cold weather and heavy snowfall (for eastern counties) in the winter, but much warmer weather in the summer.
The processes at work in Tropical maritime (Tm) air are a bit different. This is warm air, which is being cooled from below as it moves north. You therefore wouldn’t expect any convection with air rising, cooling and forming cloud. However, the air is being cooled just by moving north and so eventually may reach the temperature at which cloud forms – flat, featureless sheets of stratus cloud because, on the whole, the air is staying at the same level.
As it is maritime air, there is plenty of water vapour available to form cloud droplets. The processes which give us big, fat raindrops are mainly associated with the vertical air motion and circulations in cumulus clouds. So Tm air at best gives a persistent drizzle.
The satellite image below shows the extensive sheet of stratus cloud over the Atlantic associated with Tm air.
We rarely experience Tropical continental (Tc) air – air that flows up from the Sahara over continental Europe. This is the warmest and driest air we can get – any moisture picked up over the Mediterranean will be rained out before it reaches us.
Tc air gives clear skies, as you can see in the satellite image below – again ignore the front to the west of the UK. In the summer, this can mean that some areas get particularly warm – maybe because of their colour (dark) or aspect (facing the Sun) – giving rise to late afternoon localised thunderstorms
A front is where two air masses meet. In the UK, the weather fronts associated with depressions usually separate polar and tropical maritime air.
If there is a front, then different parts of the UK can be experiencing different air masses. The weather on the fronts themselves is more extreme.
Look out of the window now – what cloud types can you see? Does that tell you anything about where the air is coming from? You can have a look at earth.nullschool to see if you are right.
We use cookies on this site to enhance your user experienceBy clicking any link on this page you are giving your consent for us to set cookies. More info
By clicking any link on this page you are giving your consent for us to set cookies. More info
Strictly Necessary Cookies
Strictly Necessary Cookie should be enabled at all times so that we can save your preferences for cookie settings.
If you disable this cookie, we will not be able to save your preferences. This means that every time you visit this website you will need to enable or disable cookies again.