


By clicking any link on this page you are giving your consent for us to set cookies. More info
This tool is best used on a laptop or other larger screen and may not function correctly on a phone.


We are delighted to have worked with the Young People’s Trust for the Environment to develop a four lesson scheme of work looking at heatwaves.
This package of lesson plans consists of 4 lessons:
By the end, students should be able to show which places in the school are most affected by extreme heat, understand what measures could be put in place to reduce the impact of extreme heat and be able to present their learning and research.
You are welcome to modify the lessons by adding your own slides to the presentations, or deleting ones you don’t need.
The lessons have been designed to support learners in Key Stage 2 (or equivalent) with understanding more about heatwaves, the reasons why we are likely to face more of them in the future and some steps that schools can take to protect young people during these events. The lessons can be adapted to suit other age groups by modifying the information given in the linked notes.
Heatwaves lesson plans – notes for teachers, start here!
PowerPoint (higher resolution)
Heatwaves_Sheet_Quiz_Questions
Heatwaves_Sheet_Research_Solutions
Heatwaves_Simple_Fieldwork_Record_Sheet
Heatwave_Solutions_Pros_and-Cons


These resources are designed to be used in one session with year 6 (10/ 11 year old) students. Although they will support numeracy, literacy and various other aspects of the curriculum, they are designed to prepare students for secondary school rather than support the year 6 curriculum.
There are 6 suggested activities. Although they are designed to be run sequentially, you may choose to use only some of the activities, or to supplement them with your own ideas.
You may like to ask them to summarise their learning after each activity – this could be on post it notes on a cloud, or …
It should be possible to use these activities with any class size.
Many people, including Ellie Highwood, Cristina Charlton-Perez, Helen Johnson and Laila Gohar, have contributed to these resources.
Time: 30 minutes
You will need: Weather or Climate.pptx, one printed copy of Weather or Climate.docx for each pair of students and two dice per pair of students.
a) Show the images in the PowerPoint presentation and ask the students what each image shows and whether it is ‘weather’ or ‘climate’. Some may not have a clear answer!
b) Ask the students to get into pairs and give each pair one sheet and two dice.
c) Give them 5 minutes to roll both dice and record the combined score each time they roll as a tally chart.
d) Optional: ask them to turn this tally into a bar chart on the graph paper provided.
e) Can they predict what number they would roll next, if they had the chance?
f) Talk about how the graph shows the most likely score (the climate) but also the complete range of possible scores (the weather). What scores are ‘extreme’?
g) What happens to the numbers if the ‘1’ on one of the dice is changed into a ‘7’?
Time: 30 minutes
You will need: 120 multicoloured lollipop sticks (at least 10 sticks each of 6 colours), Climate_Change_Picture.pptx, lollipop.xls, blue tack or similar
Note: this probably works best with groups of about 6 students working on each graph, with larger groups more teacher involvement will be required to keep the whole group engaged.
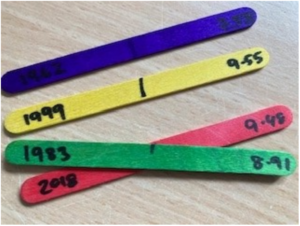
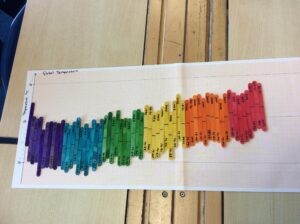
a) Before the event, mark on the middle of each lollipop stick. On each stick, write the year and the temperature for one of the data points in the spreadsheet (e.g. 1970 14.47), differentiating between global and CET data. Use a different coloured lollipop for each decade – so the 60s are all one colour etc.
b) You’ll also need to print a blank graph – the document supplied will work on A3 paper.
c) Divide the students into two groups. Within each group, divide out the lollipop sticks.
d) They should then work together to stick the sticks to the graphs in the right places, using the line in the middle of the stick as the marker.
e) Whilst doing so, they can look at years that mean something to them – the year they were born, their parents were born etc.
f) When they’ve finished, ask them to complete the table on the ppt
g) What does their graph show? What surprises them? What are the similarities and differences between the graphs?
h) Optional: take the sticks back off the graph and, within their groups, line the sticks up in temperature order with the coldest on the left and the warmest on the right. What does this show?
Time: 30 – 60 minutes
You will need: Lucky dip bag of things that have some link (vague or otherwise) to climate change. Each group takes an object, and then together works out what the connection is. After 10 mins groups swap
objects until all groups have seen all objects. (You could make a simple worksheet with a box for them to write their ideas for each item).
At the end – ask for feedback on each object and give them the “correct answer” – this can take a while – if you have 4 objects, this would make a 60 minute activity. I think they lose interest after 4 objects.
Example objects, depending on what you have available. Try and use objects which have both obvious and higher level ideas associated with them. Try and balance ‘doom and gloom’ with ‘opportunity and hope’ ideas.
Toy car: Emissions of greenhouse gases, also ozone and air pollution. Move talk
onto electric vehicles, nighttime charging etc.
Tree ring slice: Tree rings are an indirect way of measuring our climate etc, trees remove
carbon dioxide from the atmosphere, forestation and deforestation.
Cuddly cow: Methane – but you could also talk about the climate impact of beef etc. as
that is now much more talked about.
Butterfly brooch: Most of the kids talk about different species adapting to climate change (they do evolution in year 6) but you can also refer to chaos and internal links between different parts of the climate system
Mini trainer shoe: Some “air” trainers used to have SF6 in which is a really strong
greenhouse gas. You could also use baby shoes to represent babies and population growth. Also transportation – where were these shoes made?
Mirror: Geo-engineering and space mirrors – but can also explain albedo in this
way.
Solar powered toy: Renewable energy sources
Windmill: Renewable energy sources, changing weather patterns
Bag of rice: Methane production, plants as absorbers of CO2
Cuddly polar bear, puffin or other iconic animal threatened by climate change.
Sponge: Link to bleaching coral reefs and plankton as photosynthesisers equivalent to land plants.
Chocolate bar: Clearing of rainforests for production and threat to cocoa plants as
temperature rises.
Bottle of frozen water: Melting glaciers and ice caps; link to albedo and positive feedback;
hydrogen fuel
Piece of charred wood: Sustainable fuels; increased forest fires.
Time: 30 minutes
You will need: money.docx printed in colour, WeatherRiskGame.pptx, 6 dice – large ones which the whole class can see work best. I got some foam ones very cheaply.
a) Before the event, mark the dice ‘p’ and 1-5. On the die marked 1, cross out or otherwise mark one side, on the die marked 2 cross out or otherwise mark two sides etc.
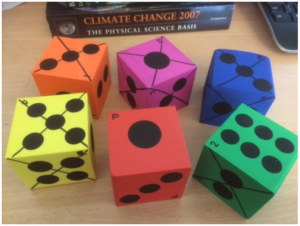
b) Use the ppt to guide the activity.
c) The students will need to get into 6 groups. Give each group one colour of money and ask them to cut it up. You should keep the ‘insured’ slips.
d) Each time you play, roll the P dice first. On the basis of which side it shows, the students should decide whether to insure their businesses or not (if a 6 is shown, then there is no chance of bad weather and presumably no-one will insure). If they choose to insure, they should pay you the appropriate sum in return for an ‘Insured’ slip. Then, roll the appropriate die (so if the P die gave a 3, next roll the die labelled 3). If a crossed-out side is rolled, then anyone who was not insured should pay you the appropriate sum.
e) Collect in all the insured slips and start again.
f) Continue until either one team, or all teams except one are out, depending on time.
Time: 2.5 hours
You will need: Laptop and projector (for PowerPoint)
Whiteboard or flipchart for recording “purchases” by teams and competition results
5 or 6 small ziplock bags containing soil or sand and representing the crops of the garden.
Large and deep plastic box for use as “lake”
Towels
Access to water
Bundles of building materials e.g. plastic straws, lolly sticks, willow sticks, elastic bands, string, corks
Tape dispenser and scissors for each team
Additional materials for teams to “purchase” e.g. small plastic bottles with lids, plastic trays, bubble wrap, bags (anything else you can think of).
Topic: Flooding and climate change, developing world, adaptation.
Skills: teamwork, raft building, communication, budgeting, testing
Based on the Flooding Gardens activity from Practical Action.
Summary:
• Short powerpoint on flooding and impact of climate change. (15 mins)
• Set up problem of agriculture in Bangladesh (5 mins)
• Design and build of floating garden rafts according to specification in the power point (see also
below) – 40 mins including one opportunity for testing design
• Public competition – 20 mins
• Final few slides on real life application – 10 mins
Plus need a bit of time to set up in advance and definitely some to pack / clear up afterwards
Raft building part:
Each team needs to build a raft that could hold a floating garden. The winner is the team that builds a raft that can hold the most weight (small bags of soil) without the top surface of the raft being inundated with water. If using the budgeting version, secondary awards for cheap designs that work (although maybe not quite as well as the expensive ones).
Students are provided with a bag containing e.g. straws, willow sticks, elastic bands, sellotape dispenser, scissors, corks, lolly sticks. These represent “free” and available materials.
Also available are plastic bottles, plastic trays, bubble wrap and anything else you can think of – but these are kept at the front and have a price attached to them. The actual value you give them is arbitrary but they are supposed to represent things that are scarce in the communities we are considering. For example, plastic bottles might represent sealed oil drums, bubble wrap might be tarpaulins etc.
(Note, all materials can and should be recovered at the end of the session – the rafts are broken down and materials reused on other occasions).
With a year 6 group, you should be able to get them to discuss and draw out their design as a team first (maybe first 10 mins of building section), then send one person to get what they need (including paying – I haven’t given them a budget as such, just kept a record of what they have “spent”, but you could give each group a fixed budget if you wanted to (and then judge your winner differently).
Time: 30 minutes
You will need: A playground. Chalk or similar. Hats or sashes (see below).
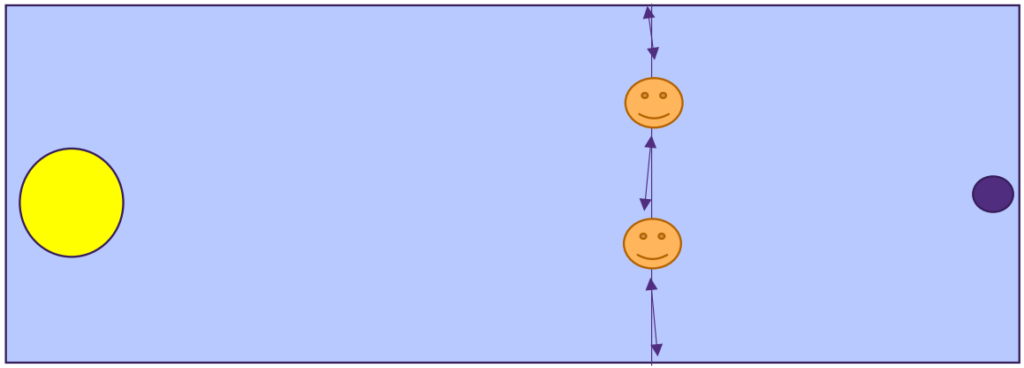
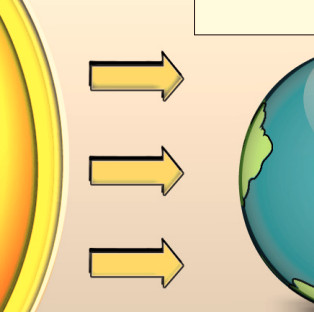
This playground game demonstrates the way Greenhouse gases return energy to the Earth’s surface – as well as allowing the students to run off some energy!
a) With chalk or similar, mark a Sun and an Earth at opposite ends of the school playground. If possible also draw a line across the playground, a third of the way between the Earth and the Sun.
b) Choose 2 students to be greenhouse gases – if possible give them a hat or sash to identify them.
Which greenhouse gases have they heard of? One could be water and the other carbon dioxide.
They are allowed to move only along the line you have drawn. Their role is to try and touch the other students as they run past but only when they are running from the Earth towards the Sun!
c) The other students are all ‘energy’ and start off by the Sun.
d) The ‘energy’ should run to the Earth and back again, repeatedly. If the ‘greenhouse gas’ students manage to touch them, then they have to run 10 times between the greenhouse gas line and the Earth before being allowed to return to the Sun.
e) After a few minutes of doing this, stop the students and increase the numbers of ‘greenhouse gas’ students – you could add a methane, or another water.
f) Again, let them play this for a while, then stop them and ask what has changed. They should notice that there is now more ‘energy’ trapped near the Earth.
g) You could increase the amount of greenhouse gas again and let them see what happens.
h) Finish by talking about how greenhouse gases are essential to maintaining our climate, but that increasing the amount of greenhouse gas leads to heating. You may need to talk a little bit about the different forms energy can take – light, heat etc.
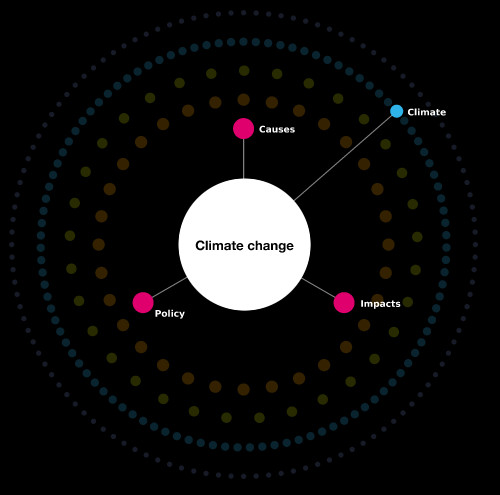
Climate is the average weather over a long time period (30 years) for a particular region or place. The climate affects a number of environmental factors within the region including the type and growth of vegetation and wildlife. The climate is determined by large scale factors such as the Earth’s orbit around the Sun, the position of the continents and the composition of the atmosphere. Weather describes the short-term state of our atmosphere. This may include information about the air temperature, precipitation, air pressure and cloud cover. Our local weather changes daily due to the movement of air in our atmosphere.
I can investigate the relationship between climate and weather.
2 dice
Tally chart for numbers 2-12 Graph paper
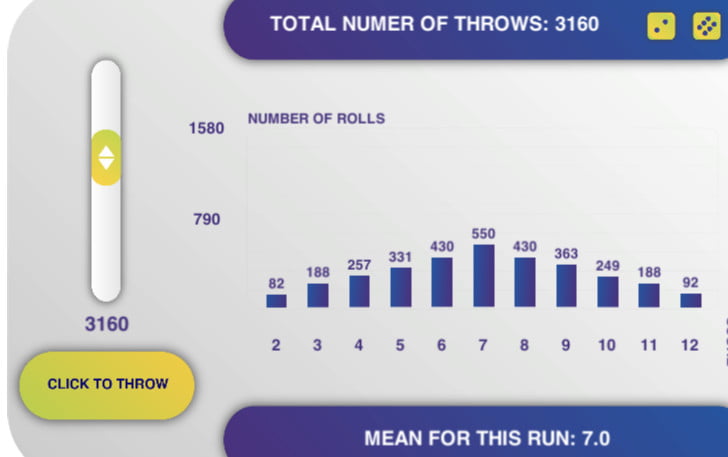
In pairs, throw the two dice about 100 times and record the combined score shown each time.
Draw a bar graph of the results.
The results should show a smoothish distribution, with a score of 7 being most frequent. Ask each group to predict what their score will be if they throw the dice one more time – they can’t. However, with one more throw, the mean of all the scores will stay about the same (about 7). In the same way, the weather may be very different from day to day but the climate, the weather we ‘expect’, stays about the same.
If you don’t have access to dice, you can do this activity online at https://www.metlink.org/blog/weather-climate-extreme-weather-and-chaos-theory/
Can the students design a concept cartoon to illustrate the difference between weather and climate? See https://www.stem.org.uk/system/files/elibrary-resources/legacy_files_migrated/1292WEATHER.PDF and http://www.millgatehouse.co.uk/concept-cartoons-research/
A YouTube video showing an owner and his dog, as an analogy for weather and climate
I can describe the physical processes of a natural disaster (extreme weather event)
and discuss its impact on people and the landscape.
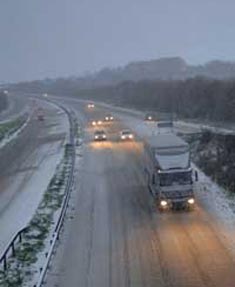
Suggested Lessons: The Beast from the East

Fieldwork activity Using Bubbles to Map the Wind Microclimate of Your School
Resource developed for National Fieldwork Week 2022
Download Instructions as a pdf
Length of time: One Lesson
Suitable locations: School grounds – including at least one building which students can walk all the way around. Choose a day which is windy or the results will be disappointing. If possible, repeat when the wind is in a different direction.
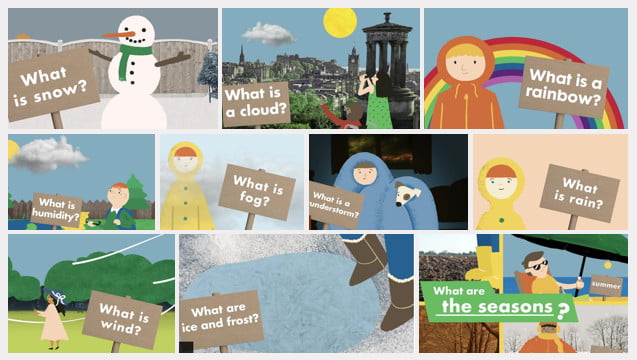
We were delighted to support BBC Bitesize Scotland in the creation of these 21 videos for primary schools. Here are some of our best resources to support the teaching of these topics:
[all images on this page are copyright of the BBC]

Label the diagram using the words and phrases.

Words: Bedrock, River Flow, Storage, Precipitation, Transportation, Condensation, Sea (storage), Transpiration, Infiltration, Percolation, Groundwater, Absorption, Run off, Evaporation
Web page reproduced with kind permission of the Met Office

Label the seasons in the Northern Hemisphere.

Web page reproduced with kind permission of the Met Office
© 2024 Royal Meteorological Society
RMetS is a registered charity No. 208222
By clicking any link on this page you are giving your consent for us to set cookies. More info
Strictly Necessary Cookie should be enabled at all times so that we can save your preferences for cookie settings.
If you disable this cookie, we will not be able to save your preferences. This means that every time you visit this website you will need to enable or disable cookies again.