The Bise
A cold dry wind which blows from the north-east, north or north-west in the mountainous regions of southeastern France and western Switzerland in winter months. The bise is accompanied by heavy cloud.
The Bora
 The bora is a strong, cold and gusty north-easterly wind which descends to the Adriatic Sea from the Dinaric Alps, the mountains behind the Dalmatian coast (the coast of Croatia). It is a winter phenomenon that develops when a slow-moving depression is centred over the Plain of Hungary and western Balkans so that winds are blowing from the east towards the Dinaric Alps. These mountains form a barrier which trap the cold air to the east of them whilst the Adriatic coast remains comparatively mild. Gradually, though, the depth of the cold air increases until the air flows over passes and through valleys to reach the Adriatic Sea.
The bora begins suddenly and without warning and the cold air typically descends to the coast so rapidly that it has little time to warm up.
The bora can reach speeds of more than 100 km/h and has been known to overturn vehicles and blow people off their feet.
The Chinook Wind
A warm, westerly wind found in western North America – Canada and the USA, when air from the Pacific blows over the Rocky Mountains and other upland areas. On January 15th, 1972, the Chinook caused the temperature in Lorna, Montana to rise from -48°C to 9°C in 24 hours! The fastest wind speed recorded during a Chinook was 107mph, in Alberta, Canada.
The Crachin
The name given to the drizzly weather with low stratus, mist or fog which occurs from time to time during the period January to April over the China Sea and in coastal areas between Shanghai and Cape Cambodia. It occurs when cool, moist air from the north encounters warm, moist air, and it is intensified by orographic lifting and/or by coastal convergence.
The Etesians/ Meltemi
The strong northerly winds which blow at times over the Aegean Sea and eastern parts of the Mediterranean Sea during the period May to October. The winds are known as meltemi in Turkey.
The Föhn (or Foehn)
 The Föhn is a warm, dry, gusty wind which occurs over the lower slopes on the lee side (the side which is not directly exposed to wind and weather) of a mountain barrier. It is a result of forcing stable air over a mountain barrier. The onset of a Föhn is generally sudden. For example, the temperature may rise more than 10°C in five minutes and the wind strength increase from almost calm to gale force just as quickly. Föhn winds occur quite often in the Alps (where the name Föhn originated) and in the Rockies (where the name chinook is used). They also occur in the Moray Firth and over eastern parts of New Zealand’s South Island. In addition, they occur over eastern Sri Lanka during the south-west monsoon.
 The danger of a Föhn where there are steep snow-covered slopes is that avalanches may result from the sudden warming and blustery conditions. In Föhn conditions, relative humidity may fall to less than 30%, causing vegetation and wooden buildings to dry out. This is a long-standing problem in Switzerland, where so many fire disasters have occurred during Föhn conditions that fire-watching is obligatory when a Föhn is blowing.
An explanation of the Föhn effect in the UK from BBC weather.
The Gregale (or Grigale)/ Euroclydon/ Euraquilo
A notorious wind of the western Mediterranean which also blows across central parts of the Mediterranean Sea. It is a strong and cold wind from the north-east and occurs mainly in winter. It is most pronounced on the island of Malta, where it sometimes reaches hurricane force and endangers shipping.
The Bible tells us that the ship which carried St Paul and other prisoners across the Mediterranean en route to Rome was driven by a storm from Crete to Malta, where it was eventually wrecked.
The ship set sail from a bay called Fair Havens near Lasea on the south coast of Crete, having put into this bay to wait for favourable conditions after being delayed by contrary winds. As the bay was exposed to storms, it was not considered a safe place to remain at the time of year in question, which was either late September or early October. The harbour at Phoenix on the south-western coast of Crete was considered a safer place to spend the winter. Soon after the ship left Fair Havens, however, a severe gale began to blow. So violent was the storm that the sailors could do no more than drift with the wind. The Bible tells us that the ship reached Malta fourteen days later.
Paul experienced a gregale. As these winds normally last no more than four or five days, the storm he experienced appears to have been unusually persistent.
The Harmattan
A dry and comparatively cool wind which blows from the east or north-east on the coast of North Africa between Cabo Verde and the Gulf of Guinea during the dry season (November to March). It brings dust and sand from the Sahara Desert, often in sufficient quantity to form a thick haze which hinders navigation on rivers. Dust and sand are sometimes carried many hundreds of kilometres out to sea.
The Helm Wind
An easterly wind found in Cumbria, N. England, where the winds blow over Cross Fell and then descend into the Eden Valley. A bank of cloud forms over the hill tops, and the roaring of the wind can be heard as far away as Penrith.
Discovering Britain A walk across Great Dun Fell from the RGS, exploring the Helm wind and lots of other weather, as well as stories of sheep, socks, snow and spies and a relevant article from Weather: The Helm wind of Cross Fell .
The Kaus/Suahili
The name given to the south-easterly winds which prevail in winter (December to April) in the Persian Gulf. They are accompanied by gloomy weather, rain and squalls and are sometimes followed by very strong south-westerly winds called suahili.
The Khamsin
A hot, dry, dust-laden, southerly wind over Egypt, the Red Sea and eastern parts of the Mediterranean Sea ahead of eastward-moving depressions. It occurs during the period February to June, being most frequent in March and April. The Khamsin is a Sirocco wind, whose name comes from the Arabic word for ‘fifty’, which is approximately the length of time the wind blows for. In the nineteenth Century, the plague was worst in Egypt when the Khamsin was blowing.
The Kharif
A strong south-westerly wind which blows daily over the Gulf of Aden from about 22:00 hours until about noon the following day. It occurs in June, July and August (during the south-west monsoon) and frequently reaches gale force.
The Leste
A hot, dry, southerly wind which occurs in winter and spring between Madeira and Gibraltar and along the coast of North Africa ahead of an advancing depression.
The Levanter
A moist wind which blows from the east over the Strait of Gibraltar. It is frequently accompanied by haze or fog and may occur at any time of year, though it is most common in the period June to October. A feature is the occurrence of a ‘banner cloud’ extending a kilometre or more downwind from the summit of the Rock of Gibraltar.
The strength of the Levanter does not normally exceed Beaufort Force 5. When it is strong, however, complex and vigorous atmospheric eddies form in the lee of the Rock, causing difficult conditions for yachtsmen and the pilots of aircraft. The levanter can also cause persistently foggy weather on the coast of Spain.
The Levenche
A hot, dry, southerly wind which blows on the south-east coast of Spain ahead of an advancing depression. It is typically laden with sand and dust, and its approach is often heralded by a belt of brownish cloud on the southern horizon.
The Libeccio
A strong, squally, south-westerly wind which occurs over central parts of the Mediterranean Sea, most common in winter.
The Maestro
The name given to north-westerly winds over the Adriatic Sea, the Ionian Sea and coastal regions of Sardinia and Corsica.
The Marin
A strong south-easterly wind over the Golfe du Lion. It is usually accompanied by warm, cloudy weather with rain.
The Mistral
 The mistral is also a strong and often violent wind. It blows from the north or north-west down the Rhône Valley of southern France and across the Rhône Delta to the Golfe du Lion and sometimes beyond. Though strongest and most frequent in winter, it may blow at any time of year and develops when stable air is forced through the Rhône Valley. It occurs when a depression is centred over north-west Italy and the Ligurian Sea and a ridge of high pressure extends north-eastward across the Bay of Biscay.
It may blow continuously for a day or two and attain speeds of 100 km/h, causing considerable damage to crops and making driving conditions difficult in the Rhône Valley. It clears clouds and pollution out of the air. In the Rhone valley in France, trees lean to the South because of the force of the Mistral.
The Norther
This name for a wind is used in more than one place. In Chile, a Norther is a northerly gale with rain. It usually occurs in winter but occasionally occurs at other times of year. Typically, it can be identified by falling air pressure, a cloudy or overcast sky, good visibility and water levels below normal along the coast.
Over the Gulf of Mexico and western parts of the Caribbean Sea, Northers are strong, cool, northerly winds which blow mainly in winter. Over the Gulf of Mexico, they are sometimes humid and accompanied by precipitation, but over the Gulf of Tehuantepec they are dry winds.
Pampero
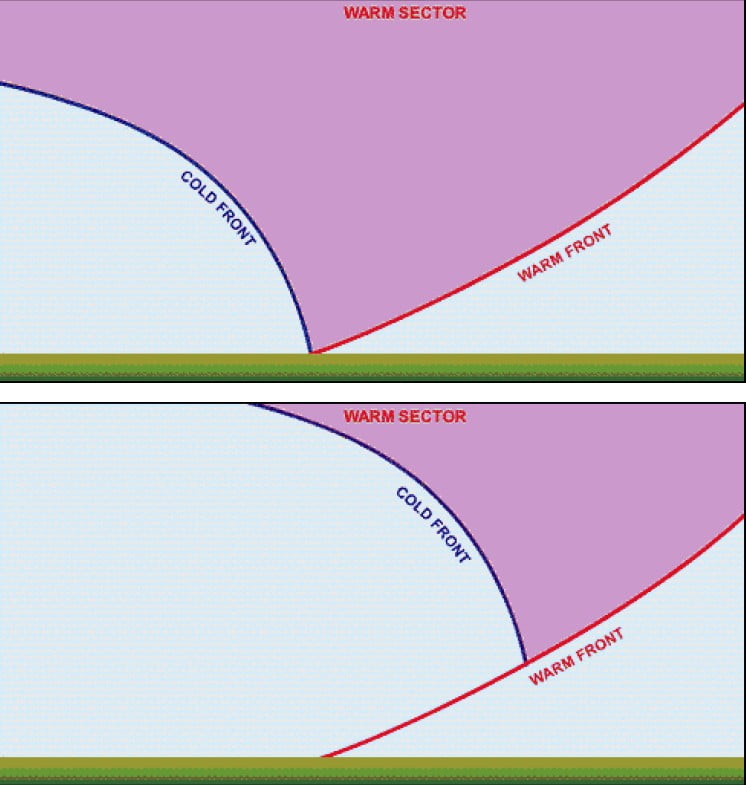
The name given to severe line squalls in Argentina and Uruguay, particularly in the Rio de la Plata area. They are associated with marked cold fronts and are usually accompanied by rain, thunder and lightning, a sharp drop in temperature and a sudden change of wind direction from northerly or northwesterly to southerly or south westerly. They are most likely to occur during the period June to September.
Roaring forties
Strong westerly winds found in the Southern Hemisphere between 40 and 50 degrees South. Sailing ships have always made use of them. The winds are much stronger in the Southern Hemisphere because there is very little land to slow them down – only Tasmania, New Zealand and the very bottom of South America.
The Santa Ana
A hot, dry, strong, blustery, föhn-type wind which blows from the north-east or east over southern California and carries with it large quantities of dust. It is most frequent in winter but may also occur in spring or autumn. It may get its name from the Santa Ana Mountains or the Santa Ana Canyon but other possibilities are that it derives from santanas, meaning ‘devil winds’, or the Spanish Satanás, meaning Satan. These winds can cause a great deal of damage. As they are hot and dry, they cause vegetation to dry out, so increasing the risk of wildfires; and once fires start the winds fan the flames and hasten the spread of the fires. In spring, Santa Ana winds can cause considerable damage to fruit trees.
Shamal
Strictly, the shamal is any north-westerly wind over the Persian Gulf and Gulf of Oman, but the term usually refers not to the normal prevailing winds but to the squally gale-force winds accompanied by rain and thunder which occur in winter.
The Scirocco/ Sirocco
A hot, dry wind southerly wind which blows from the Sahara in northern Africa into the southern Mediterranean. It picks up moisture as it crosses the Mediterranean and can reach Spain, France, Italy and Greece bringing Saharan dust and hot, windy, damp weather, often with fog or low stratus cloud. In spring, the Sirocco can bring gale force winds. There are many local names for the Sirocco, including chom, arifi, Simoom, Ghibli, Chili, Khamsin, Solano, Leveche, Marin and Jugo.
The Solano
An easterly or south-easterly wind, with rain, which occurs in the Strait of Gibraltar and over south-eastern coasts of Spain.
Southerly-buster
The name given to the violent squalls which are associated with well-defined active cold fronts over coastal regions of southern and south-eastern Australia. They are accompanied by lightning, thunder and gale-force winds and are similar to pamperos. They are most frequent in summer but may also occur in spring and autumn.
Sumatra
These are characteristically squally local winds which occur over the Malacca Strait several times a month during the period April to November. They are always accompanied by heavy rain from cumulonimbus clouds and are almost always accompanied by lightning and thunder. They are initiated by katabatic winds and therefore tend to occur at night.
Tehuantepecer
A violent squally wind from the north or north-east in the Gulf of Tehuantepec in winter. It originates in the Gulf of Mexico as a norther and blows across the Isthmus of Tehuantepec.
The Trade wind
Easterly winds in the Tropics (between the Tropic of Cancer and the Tropic of Capricorn). The Trade winds helped European explorers reach America.
Tramontana
A cold, dry, northerly or north-westerly wind over the coast of Catolina and a cold, dry northerly or north-easterly wind over the west coast of Italy and the north coast of Corsica. It is typically a strong wind but does not often reach gale force.
The Vendavales
Strong, squally, south-westerly winds off the east coast of Spain and in the Strait of Gibraltar. They occur mainly during the period September to March and are often accompanied by violent squalls, heavy rain and thunderstorms.
Williwaw
A sudden, cold, violent wind found in Alaska and Cape Horn which blows from the mountains to the sea.
Willy-Willy
A willy-willy is a dust storm over north-west Australia. More information.
The Zonda/Sondo
This term applies to two different phenomena. It usually refers to a dry and often dusty föhn wind that occurs over the eastern slopes of the Andes in central Argentina in winter months. It is also the name (or sondo) given to a hot, humid, northerly wind over the Pampas region of South America in advance of an eastward-moving depression and preceding a pampero occurrence.


 This work was funded by the


 One of these is lightning, though the possibility of its occurrence may be indicated indirectly in a forecast or station report as ‘thundery showers’. In fact, lightning is not such a risk to sailors as it might at first appear. Boats are surrounded by a very good conductor of electricity – water – and unless the boat suffers a direct hit, which is unlikely, the current is dissipated much more quickly than on land.
 Mountain tops are often hidden by clouds, which can result in people getting lost. But why does this happen? Clouds are formed by the condensation of water vapour in rising air. Air is very moist (holds lots of water) when it is near the sea or when there is persistent rain. In the UK the cloud base (i.e. the bottom of the clouds) is often below 1000m, so low in fact that much of the time the clouds cover the mountain tops. Cloud cover on the mountains is particularly common in the west of the UK where the moist air blows in across the Atlantic. Clouds can be supercooled i.e. water remains as a liquid even when the temperature is below freezing (0°C)! these droplets of water freeze when they hit solid objects such as fences and even people. The soft ice can build up into a think layer, known as rime which can cause as much difficulty for walkers as lying snow.
 The rain and snow which falls over mountains tends to come from nimbostratus clouds, and occasionally cumulonimbus clouds, tend to be heavier and longer lasting than over nearby low lying areas. This is because the air is forced to rise over the mountains, causing the air to cool as it rises condensing the water from a gas to liquid; forming more clouds. However strong winds at the mountain top can blown the heavier rain over the mountain top, so the heaviest rain will not necessarily be at the highest point. Waterproof clothing and footwear on mountains is essential as there can be heavy rain, driving winds and mountain streams can become deep quickly. Deep depressions coming in from across the West coast of the UK can bring heavy rain and strong winds to the UK. Snow combined with wind can be life-threatening on a mountain top.
 The higher up the mountain we climb, the colder and windier it usually gets so that the wind chill factor increases. Warm clothing on the top of mountains is definitely needed. On the Munros (the Scottish mountains with tops above 3000m) it can be 10°C cooler at the top of the mountain in comparison to the valley bottom below. In fact air can cool by 6°C in every 1000m and sometimes as much as 10°C. But why does the air get cooler and windier? It is windy high up in the atmosphere as the effect of gravity is reduced and cooler because air temperatures decrease as you get closer to the poles. Therefore gale force winds are stronger and more common at the top of mountains than at sea level. Winds also get faster around mountains as they do around tall buildings in our towns and cities. Over the Himalayas winds of 150km/hr (approximately 42 metres per second) are not uncommon!
 Snow combined with poor visibility in cloud also causes problems because shadows disappear. Navigation becomes almost impossible and can lead to blundering into dangerous places ‘ even over the edges of cliffs. This is known as a ‘whiteout’. If there is already much lying snow and a risk of the cloud base descending onto the hills, many climbers often consider it wise to abandon the trip.
 Local winds occur on a small spatial scale, their horizontal dimensions typically several tens to a few hundreds of kilometres. They also tend to be short-lived lasting typically several hours to a day. There are many such winds around the world, some of them cold, some warm, some wet, some dry. There are many hazards associated with the winds.
 This wind is caused by thermal (heat) processes. Anabatic (upslope) winds occur over slopes which are heated by the sun. Air which is in contact with slopes that are warmed expands upward and cool and sinks over neighbouring valleys (see diagram). Anabatic winds are usually slow, at only 1-2m/s and are rarely important expect near coasts where they can increase the strength of sea breezes.
 Katabatic (downslope) winds occur over slopes which are cooled. Katabatic winds occur where air in contact with sloping ground is colder than air at the same level away from the hillside over the valley (see diagram). Katabatic winds are nocturnal phenomena in most parts of the world (i.e. they tend to happen at night) as there is surface cooling, especially when there is little cloud and due to lack of heating by the sun.


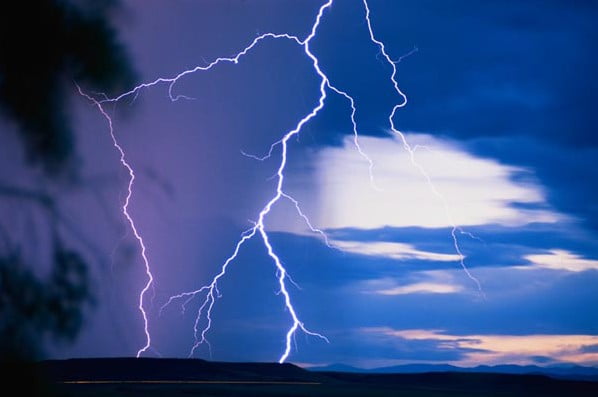
 Thunder is the loud noise which follows a flash of lightning. Lightning can be seen before thunder is heard as light travels faster than sound. The speed of sound in air is just over 300m/s. This means that if you count the seconds between seeing the lightning and hearing the thunder, and divide by three, you can work out how many kilometres away the storm is (for example, if you start counting when you see the lightning and get to 9, then the storm is about 3km away). The noise of thunder is caused by the rapid expansion of heating the air. You can normally hear thunder up to 6 miles (10km) away from the lightning flash. The sound can last quite a few seconds!
 Lightning can be seen virtually instantaneously as light travels very fast (about 300,000,000 m/s!). Lightning can be seen up to 50 miles away! lightning. Lightning is produced by discharges of electricity from cloud to cloud or from cloud to ground. A large positive charge builds up in the upper part of a thunder cloud and a negative charge builds up near the base of the cloud. When the potential difference between the charged areas becomes large enough, electrical energy is discharged and a flash of lightning occurs. Huge quantities of electricity are discharged in lightning flashes and temperatures of over 30,000°C or more can be reached!
 In a thunderstorm you should not stand under a tree! Lightning tends to strike the highest point around and everything near this can be a target for the lightning too. Very few people survive being hit by lightning. To increase your safety in a thunderstorm you should avoid high ground, water, open spaces such as parks and golf courses, staying in a tent or shed, being within 30m of wire fences or using your umbrella. You should make yourself as small as possible – curling up in a ball is good. It is however safe to stay in the car…do you know why?! It is because the car acts as what is known as a Faraday cage, protecting you from the electric field generated by the storm.
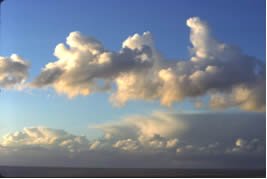
 For thunderstorms to occur, cumulonimbus clouds are required. These are heavy, dense, towering clouds with tops shaped like anvils or vast plumes, where the speed of air rising through the cloud can reach 20m/s. Pilots tend to fly around these clouds if they can. They can fly around them as often they are only 10-12km in width. In cumulonimbus clouds weather such as heavy rain, lightning, hail, turbulence and strong winds can occur.